
EUR/USD:
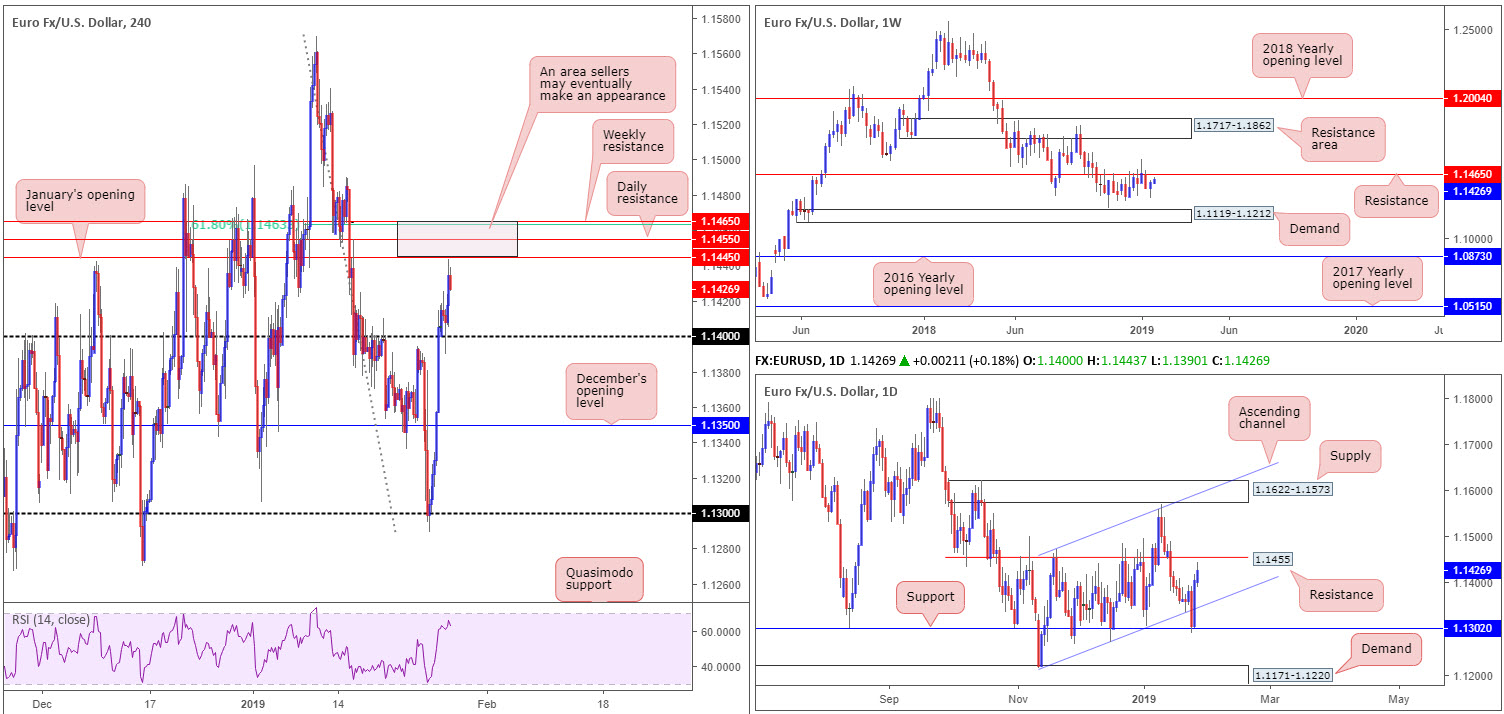
Entering the early junctures of London’s session Monday, the H4 candles retested 1.14 as support and held ground by way of a reasonably nice-looking bullish pin-bar formation. As the US dollar index (DXY) extended losses beyond its 96.00 mark, the EUR/USD explored higher ground off 1.14, reaching highs just south of January’s opening level at 1.1445. Directly above this barrier, Traders may also want to acknowledge nearby daily resistance plotted at 1.1455, a 61.8% H4 Fibonacci resistance at 1.1463 and a weekly resistance at 1.1465 (marked in a subtle shade of red).
ECB’s Draghi also took to the stage Monday, reiterating similar language put forward during last Thursday’s dovish post-policy meeting press conference. Despite this, the single currency was unfazed. In fact, the euro carved out additional gains above 1.14.
Areas of consideration:
For folks who read Monday’s briefing you may recall the piece underscored a possible retest play off 1.14 in the shape of a bullish candlestick pattern, targeting 1.1465/1.1445. Well done to any of our readers who managed to jump aboard this move, it played out as expected.
Another scenario penciled down in Monday’s briefing was the 1.1465/1.1445 area as a sell zone (highlighted above in red), targeting the 1.14 handle as an initial take-profit zone. The levels included within this base are prominent and incorporate all three timeframes, therefore worthy of a place on the watch list. Having seen price action yet to test this area, the zone is still worthy of attention today/this week. For conservative traders wishing to add a little more confirmation to the mix, however, waiting for additional bearish candle confirmation to form is an option. Not only would this provide entry/exit parameters to work with, it also displays seller intent.
Today’s data points: Spanish Unemployment Rate; US CB Consumer Confidence.
GBP/USD:
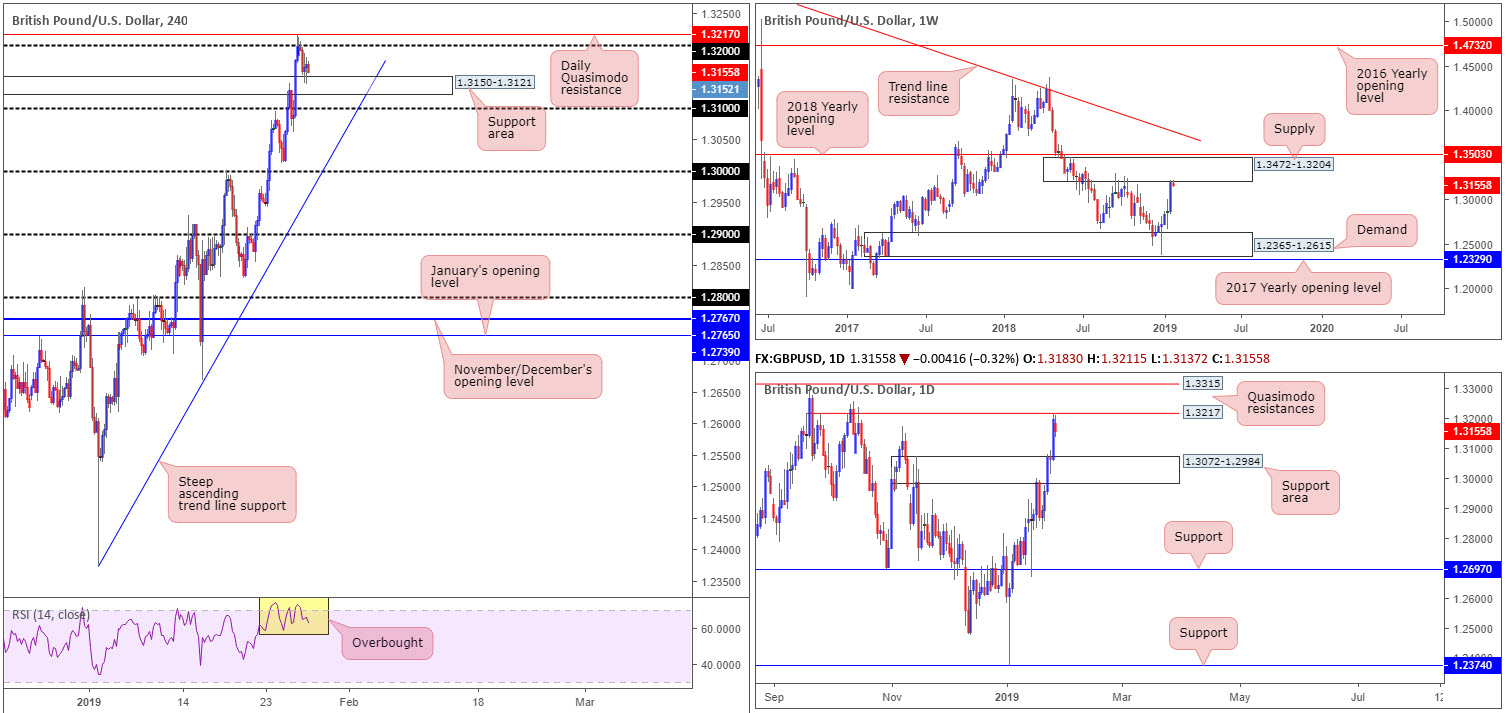
Operating via a top-down approach this morning, the research team notes weekly price action is engaging with the lower boundary of supply drawn from 1.3472-1.3204. Tailed closely by a 2018 yearly opening level at 1.3503, the current supply, which already capped upside successfully once already in October 2018, houses a healthy chance of repeating history here.
A closer reading of the market shows the unit also confronting the underside of a daily Quasimodo resistance level priced in at 1.3217, complementing the current weekly supply zone. In the event sellers continue to defend this region, our technical studies show a possible retracement towards 1.3072-1.2984 could be in store: a daily supply zone-turned support area.
Turning eyes over to the H4 timeframe, we can visibly see after advancing to yearly peaks above the 1.32 handle, the candles encountered fresh sellers, pulling the pair towards a nearby support area marked at 1.3150-1.3121, which, as you can see, is so far holding firm. In addition to price action, traders may want to note overbought conditions remain present on the RSI indicator (yellow). Market caution is likely the cause of Monday’s pullback ahead of today’s Parliament Brexit vote. The House of Commons will be voting on Prime Minister May’s Brexit plan B, including a number of amendments nominated by the speaker.
Areas of consideration:
Both weekly and daily timeframes advocate a selloff in this market. Weekly structure trades from supply, while daily flow tackles the underside of a Quasimodo resistance.
Placing a question mark on potential selling, though, is H4 structure. Not only is there a support area in the mix at 1.3150-1.3121, beyond here we have the 1.31 handle to contend with, shadowed closely by the top edge of the daily support area underlined above at 1.3072. In view of this, selling based on higher-timeframe structure is complicated: either take the risk and sell, hoping higher-timeframe sellers push price through the aforementioned H4 supports until reaching the noted daily support area, or remain on the side lines and wait for a higher-probability setup to appear.
Today’s data points: UK Parliament Brexit Vote; US CB Consumer Confidence.
AUD/USD:
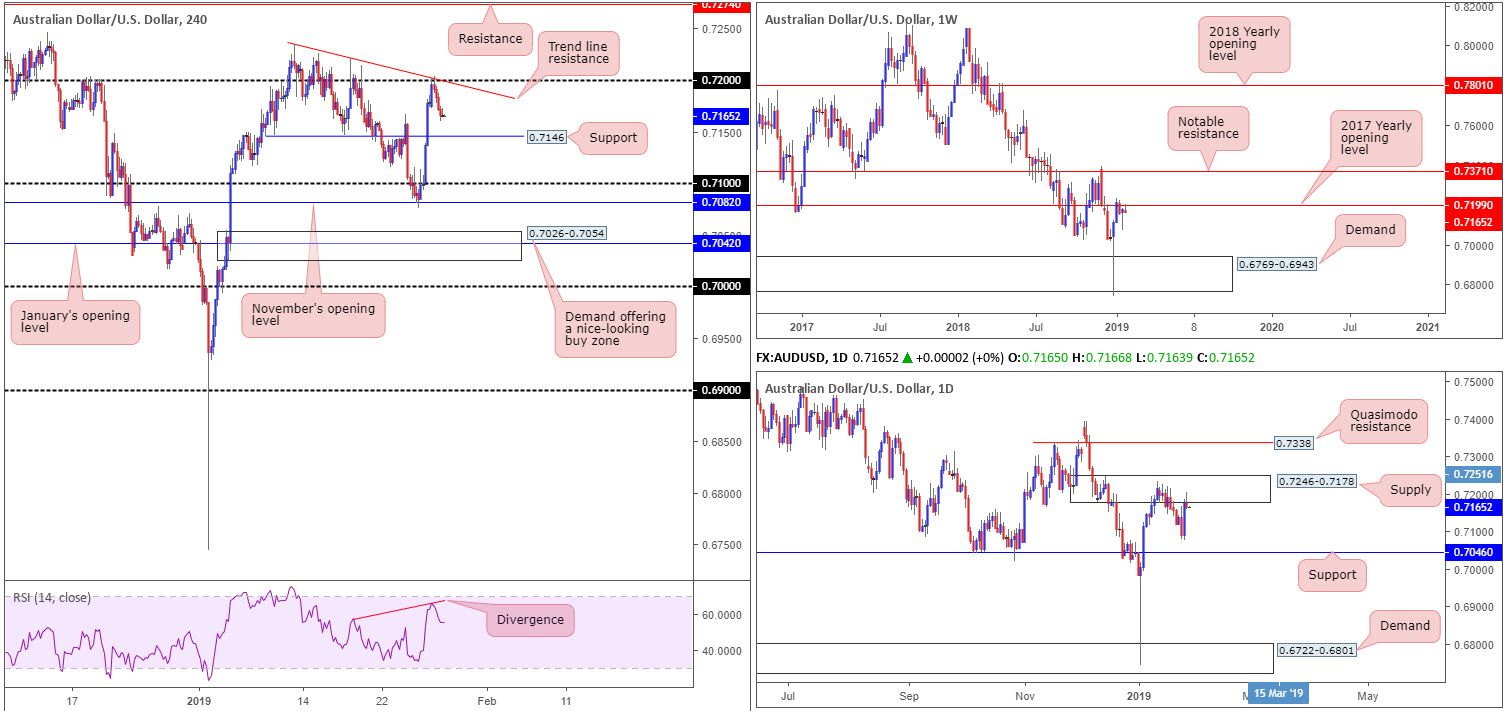
The Australian dollar yielded ground to its US counterpart Monday once price shook hands with its 0.72 handle. For traders who read Monday’s briefing you may recall the piece highlighted 0.72 as a number likely on the radar for many sellers this week.
The ingredients behind 0.72 as a sell zone are down to the following:
• Converges with a local H4 trend line resistance (etched from the high 0.7235).
• H4 RSI divergence.
• 0.72 represents weekly resistance in the shape of the 2017 yearly opening level at 0.7199.
• 0.72 is tucked within the limits of daily supply notched up at 0.7246-0.7178.
As is evident from the above, there was plenty of confluence supporting a short from 0.72. The H4 candles even presented additional candlestick confirmation by way of a mild bearish pin-bar pattern. With the first take-profit target eyed at H4 support drawn from 0.7146, well done to any of our readers who managed to sell this market.
Areas of consideration:
Assuming our analysis is precise and the unit continues to discover lower levels, a H4 close beyond the current H4 support could be on the cards, targeting a move towards at least the 0.71 handle, followed closely by November’s opening level at 0.7082.
With this in mind, traders might want to pencil in a possible intraday short play sub 0.7146 today. A H4 close below this number followed up with a retest as resistance (preferably forming a lower-timeframe bearish candlestick pattern as this will help provide entry/stop parameters) would, given the overall picture of the market right now, likely be sufficient enough to draw in further sellers and push lower.
Today’s data points: US CB Consumer Confidence.
USD/JPY:
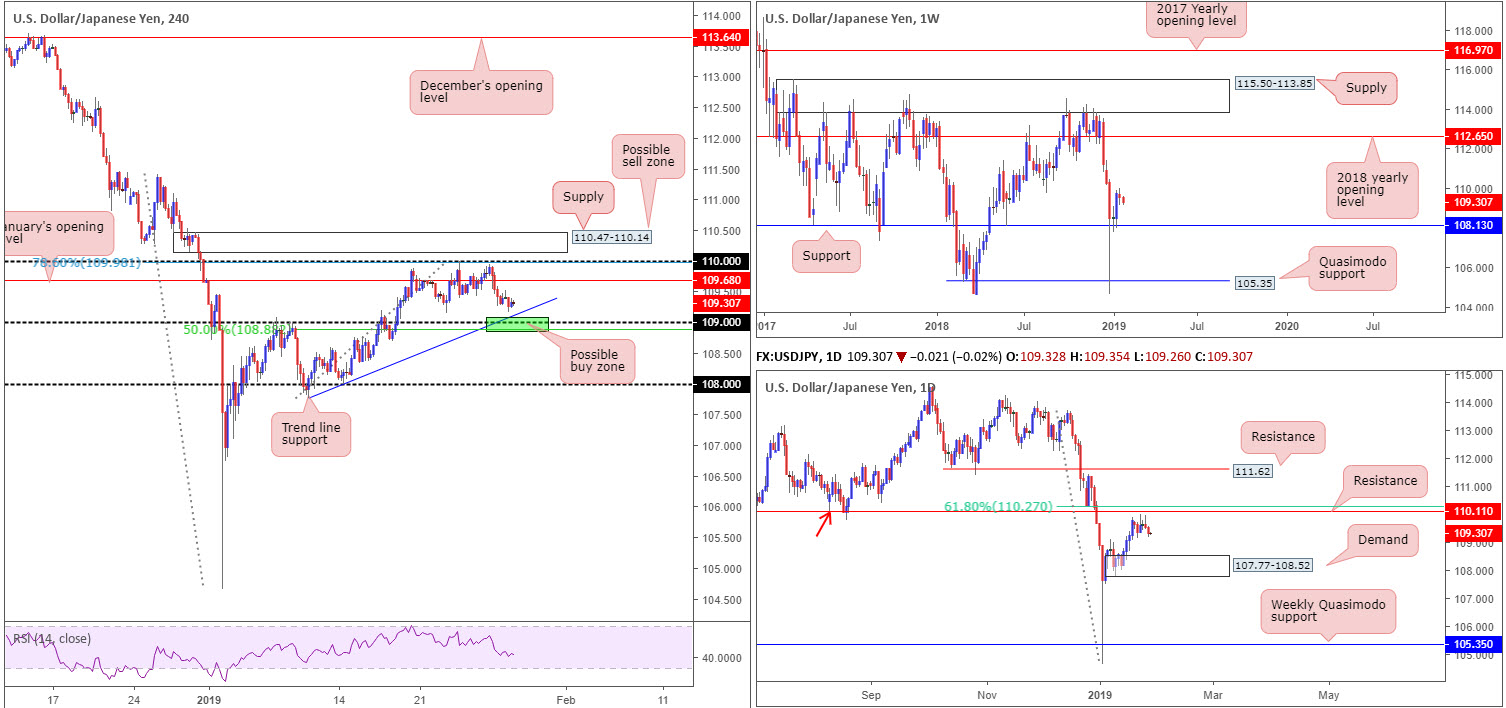
Weighed on by broad-based USD selling, weakening US Treasury yields and a waning US equity market, the USD/JPY pair clawed its way mildly lower Monday, down 0.19%.
In light of yesterday’s jaded performance, much of the following report will echo thoughts put forward in Monday’s briefing.
From the weekly timeframe, the pair is visibly supported by 108.13. The research team notes a relatively clear path to the upside from 108.13 until connecting with the 2018 yearly opening level at 112.65. Should the market spin south, nonetheless, Quasimodo support at 105.35 is the next level on the hit list to be aware of.
Contrary to weekly levels, as highlighted in a number of earlier reports last week, daily price action is seen consolidating gains ahead of resistance coming in at 110.10 that’s trailed closely by a 61.8% Fibonacci resistance value at 110.27. 110.10 is essentially a Quasimodo support-turned resistance (red arrow). On the condition the unit climbs above the noted resistances, as the weekly timeframe suggests, another layer of resistance is realised at 111.62. A downside move, on the other hand, has demand at 107.77-108.52 in sight.
Areas of consideration:
The 109 handle, in light of it aligning with a local trend line support and a 50.0% support value at 108.87 (green – extended from the low 107.77), is worthy of attention for a bounce today. However, the research team urges traders to consider waiting for additional candle confirmation (entry/stop levels can be defined according to the selected pattern) to form before pulling the trigger due to the threat of a fakeout (common viewing at round numbers).
Apart from the 109 handle, eyes also remain on the H4 supply positioned at 110.47-110.14. A push above 110 (aligns closely with a 78.6% Fibonacci resistance value at 109.98) will not only trip stop-loss orders from traders attempting to fade 110, which, when filled, will become buy orders to sell in to, breakout buyers will also likely attempt to join the movement. This offer of liquidity to sell to, coupled with daily resistance seen plotted at 110.10, is likely enough to draw in attention and bring price action lower.
Traders who feel the need to trade the noted H4 supply based on candle confirmation, waiting for a bearish formation to materialise will certainly add weight to a possible rotation lower. Traders who believe the H4 supply and daily resistance is enough evidence to draw sellers’ attention will likely enter short at 110.14 with stop-loss orders planted just north of 110.47. Once, or indeed if, the H4 candles reclaim 109.68 to the downside out of 110.47-110.14, traders can think about reducing risk to breakeven and taking partial profits off the table.
Today’s data points: US CB Consumer Confidence.
USD/CAD:
In recent sessions, H4 price action took a run towards the 1.32 handle, though bottomed just north of the number and turned higher. Bolstered by a frail oil market, which tends to correlate with the Canadian dollar, the USD/CAD pair overthrew nearby December’s opening level at 1.3235 and challenged a trend line support-turned resistance (etched from the low 1.3183), chalking up a bearish pin-bar formation into the closing stages of the day.
Supporting upside is weekly support priced in at 1.3223. This level, as you’ll note from the chart, boasts historical significance, meaning a response from the level was on the cards. Further buying from this angle could eventually advance as far north as the 2017 yearly opening level at 1.3434.
Areas of consideration:
The move off the current H4 trend line support-turned resistance is unlikely to offer much in terms of downside movement, given we have nearby support on the H4 at 1.3235 (December’s opening level) and weekly support in play at 1.3223.
According to our technical studies, the ducks are being lined up for a possible retest play off 1.3235, targeting 1.33 as an initial upside target (red arrows). To avoid being whipsawed out of a trade, should the H4 candles ignore 1.3235 and press towards 1.32, consider waiting for a bullish candlestick signal to take shape. In addition to avoiding an unnecessary loss, it’ll identify buyer interest and provide traders entry and stop levels to trade.
Today’s data points: US CB Consumer Confidence.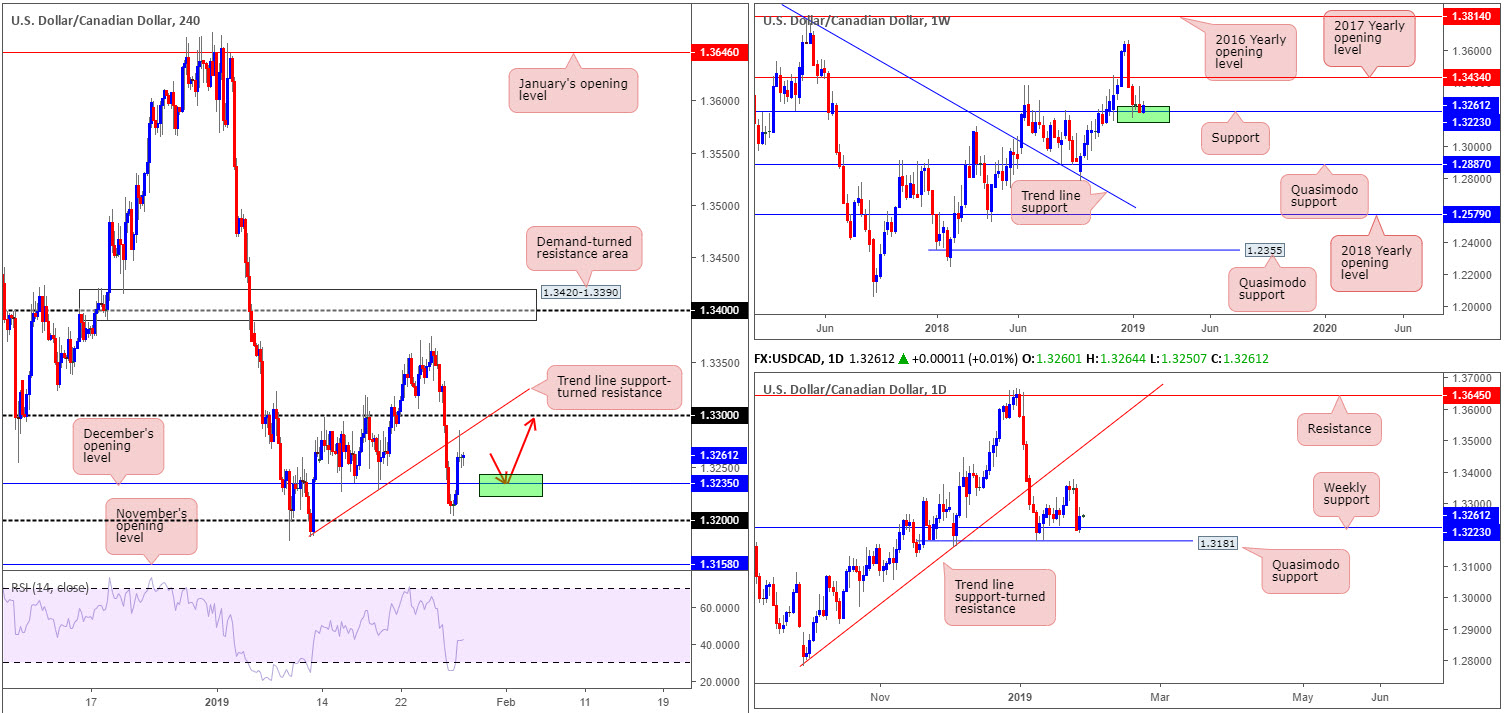
USD/CHF:
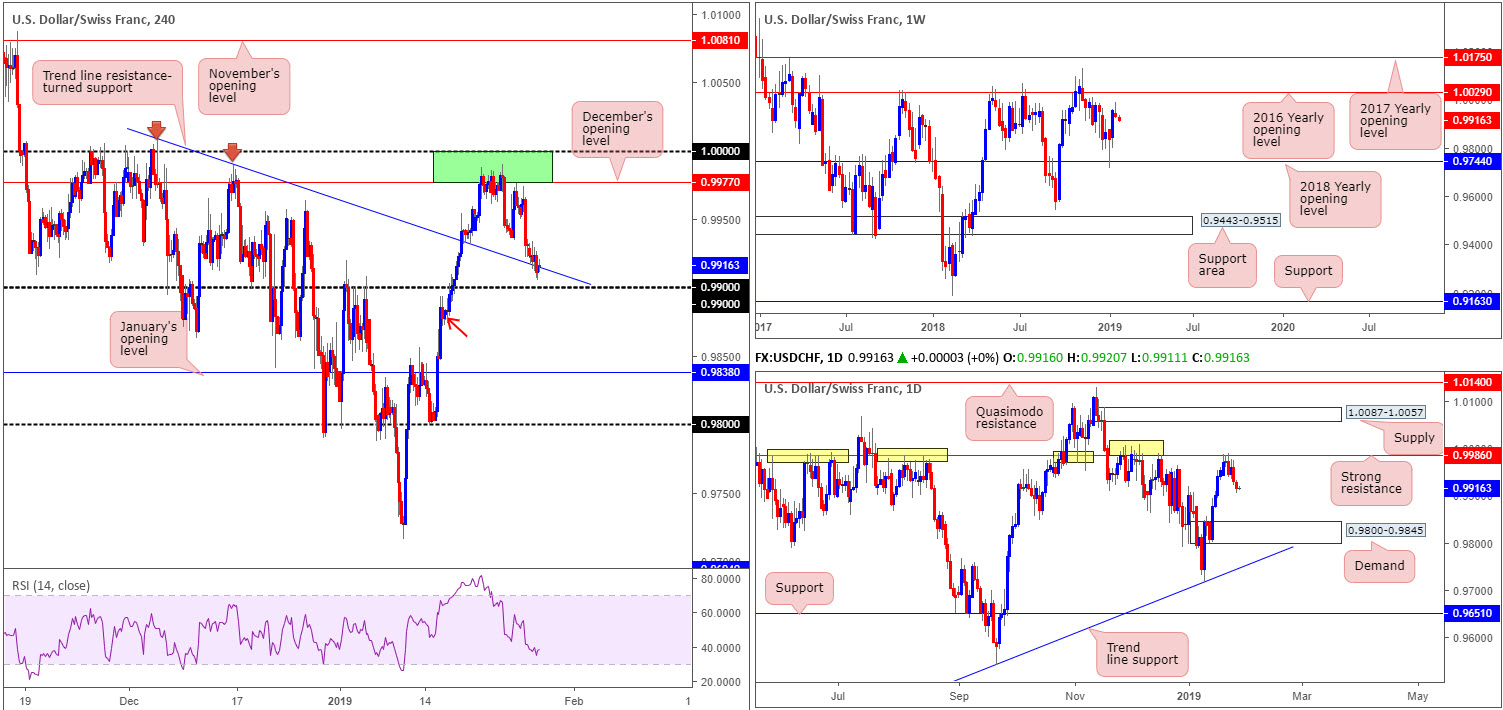
Down 0.16% on the day, Monday’s segment witnessed an influx of safe-haven demand for the Swiss franc based largely on global equities shedding ground. This – coupled with the US dollar index extending Friday’s losses sub 96.00 – marginally forced the H4 candles beyond a trend line resistance-turned support (extended from the high 1.0008) and came within a handful of pips of 0.99.
According to the overall technical picture, scope for further downside beyond 0.99 today/mid-week is a possibility. Factoring in weekly movement, we can visibly see a rather attractive bearish pin-bar pattern formed last week, just south of a 2016 yearly opening level at 1.0029. In support of the weekly timeframe’s bearish candlestick formation, daily price is fading notable resistance fixed at 0.9986. The history surrounding this level is particularly appealing (yellow), alongside the next support target on this scale not emerging until demand printed at 0.9800-0.9845. Therefore, the sellers are noticeably in the driving seat at the moment on the higher timeframes.
Areas of consideration:
Although both weekly and daily structure indicate further selling may be on the menu this week, an intraday bounce from the aforementioned H4 trend line resistance-turned support and nearby 0.99 handle could still be observed. Trading long from here, however, is a chancy move, knowing you’re potentially entering long into higher-timeframe flow.
Should the market ignore the above H4 supports and chalk up a H4 close below 0.99 that’s followed up with a retest as resistance, this is certainly of interest, targeting January’s opening level at 0.9838. There is a minor H4 demand present around 0.9883ish (red arrow), though given the higher-timeframe picture we feel this will likely be consumed. For conservative traders wishing to add a little more confirmation here, consider waiting for a bearish candlestick signal to form (preferably off the underside of 0.99 on the retest – entry/stop parameters can be defined according to this pattern) before pulling the trigger.
Today’s data points: US CB Consumer Confidence.
Dow Jones Industrial Average:
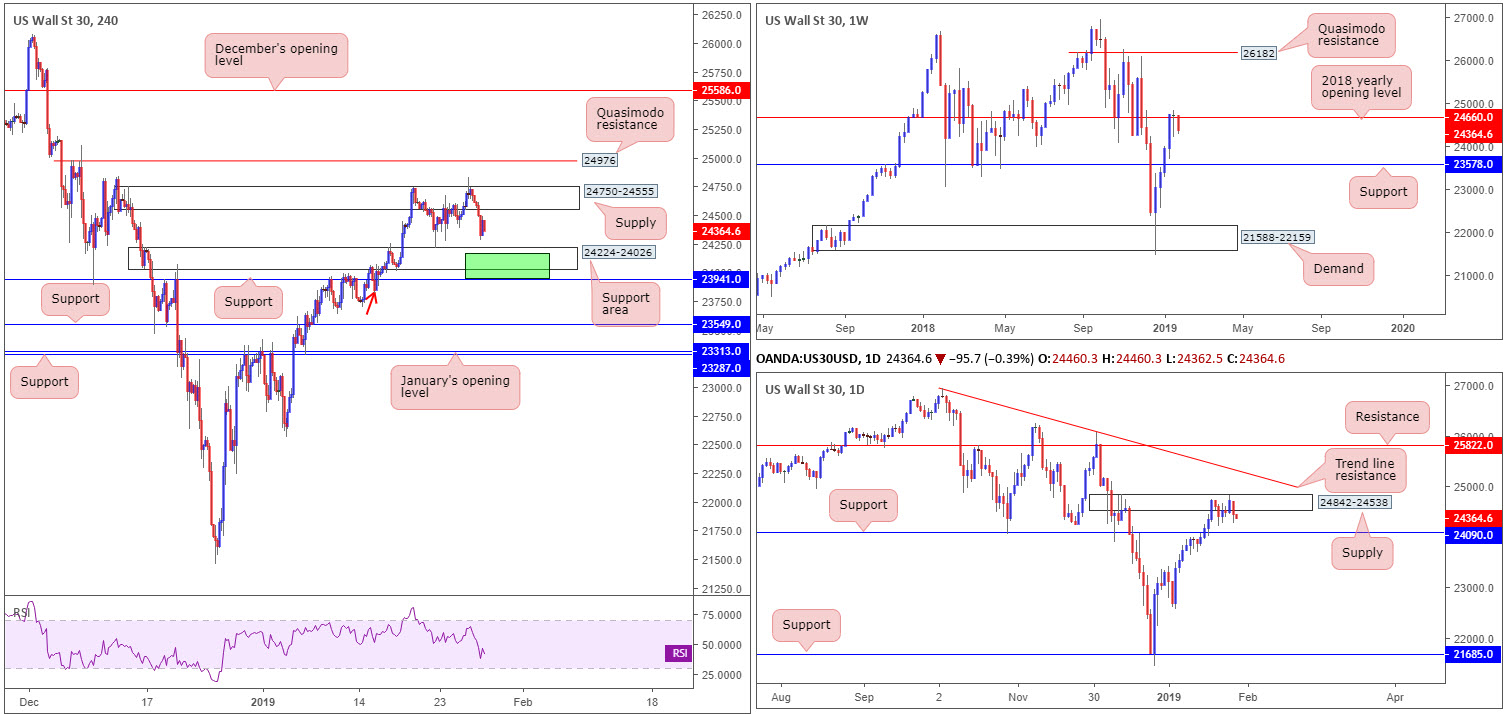
European equity indices concluded Monday’s session in negative territory, with the IBEX 35 recording losses of 1.35%. The Dow Jones Industrial Average followed in a similar manner, down 1.07% (CFD) amid disappointing Q4 earnings.
From a technical standpoint, the H4 candles are seen carving out a consolidation between supply drawn from 24750-24555 and a support area coming in at 24224-24026. Outside of these areas, traders might want to note Quasimodo resistance fixed at 24976 and support plotted at 23941.
The outlook on the bigger picture reveals weekly movement fading the 2018 yearly opening level at 24660, despite wrapping up last week’s session developing a reasonably attractive bullish pin-bar pattern that closed marginally above 24660. Against the backdrop of weekly structure, there also exists a daily supply zone at 24842-24538, which could eventually pressure the unit towards nearby support coming in at 24090. Note 24090 is effectively positioned within the lower limits of the current H4 support area mentioned above at 24224-24026.
Areas of consideration:
Although weekly structure suggests price action may head for 23600ish, a bounce from the H4 support area at 24224-24026 (with the prospect of a fakeout through this area to nearby support at 23941 – essentially the green H4 zone) is a possibility worth exploring, largely because of its connection with daily support highlighted above at 24090. As for targets, the initial port of call falls in around supply at 24750-24555 – essentially completing (or filling) the range.
Aggressive traders will likely enter long from the H4 support at 23941, with stop-loss orders tucked beneath the 23823 Jan 15 low (red arrow). For conservative traders, on the other hand, waiting for a bullish candlestick formation to complete (entry/stop level can be defined based on this structure) might be an idea before pulling the trigger.
Today’s data points: US CB Consumer Confidence.
XAU/USD (GOLD):
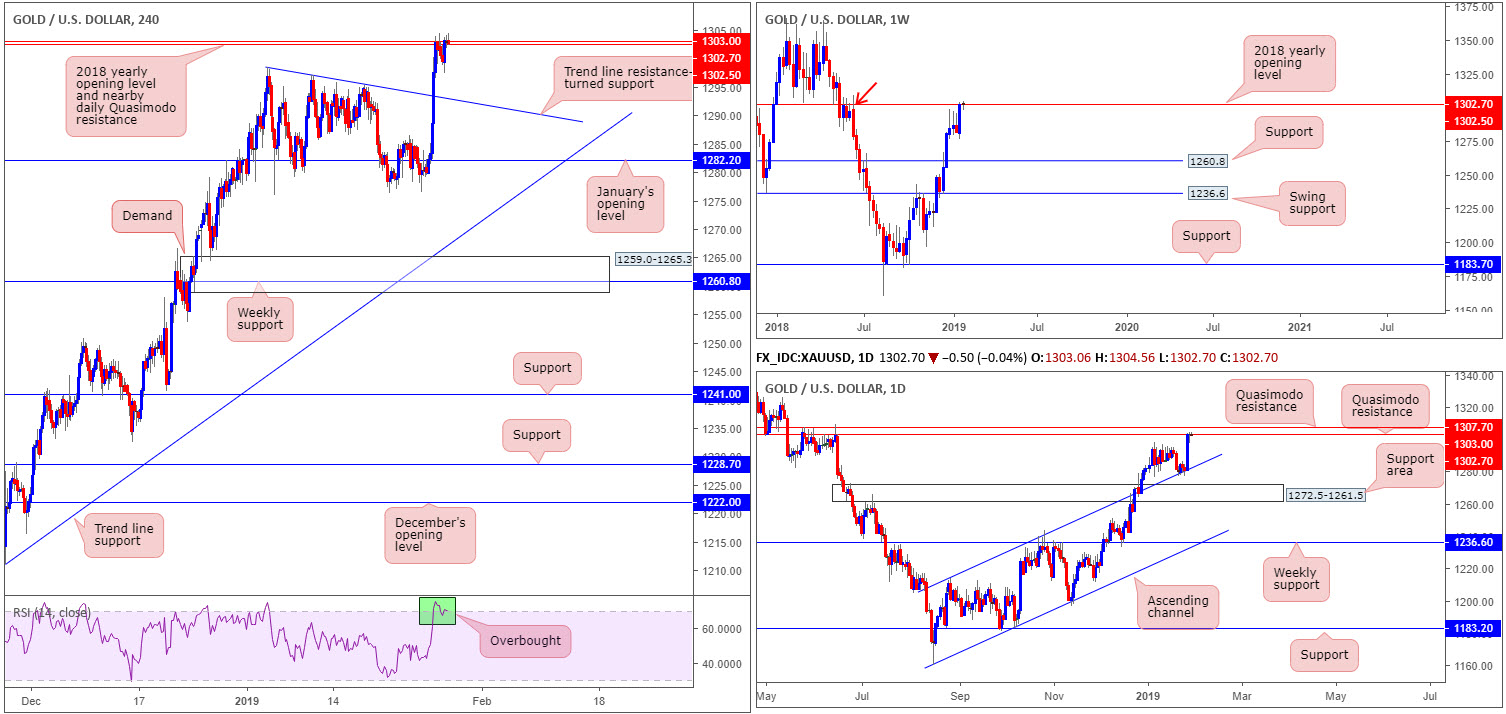
Upside momentum slowed considerably Monday, consequently concluding the session unchanged.
In view of the weekly timeframe, bullion is seen crossing swords with the 2018 yearly opening level at 1302.5, which happens to merge with supply painted at 1309.3-1289.9 (red arrow). In collaboration with weekly structure, daily action is seen challenging a Quasimodo resistance printed at 1303.0, following a strong upsurge north from a channel resistance-turned support (taken from the high 1214.3). In addition to the current Quasimodo, another layer of Quasimodo resistance is seen nearby at 1307.7.
Should the market respond from the aforementioned higher-timeframe resistances, H4 structure reveals the next downside target falls in around a trend line resistance-turned support (extended from the high 1298.5). What’s also notable from the H4 timeframe is the RSI indicator is visibly interacting with its overbought value.
Areas of consideration:
Taking into account the market’s position on the higher timeframes at the moment, it would be particularly difficult to enter long, based on our technical studies. Therefore, the research team notes to keep eyes on H4 action around the aforementioned higher-timeframe resistances today. If price forms a bearish candlestick formation that is of notable size in relation to neighbouring candles, a sell could be something to contemplate, targeting the H4 trend line resistance-turned support underlined above as an initial take-profit zone.
Traders are, however, still urged to take into account risk/reward parameters to the first take-profit target before executing a trade. Anything less than a 1:1 ratio can make it challenging to exit the trade at breakeven should the market react and push higher from the first target.
The use of the site is agreement that the site is for informational and educational purposes only and does not constitute advice in any form in the furtherance of any trade or trading decisions.
The accuracy, completeness and timeliness of the information contained on this site cannot be guaranteed. IC Markets does not warranty, guarantee or make any representations, or assume any liability with regard to financial results based on the use of the information in the site.
News, views, opinions, recommendations and other information obtained from sources outside of www.icmarkets.com.au, used in this site are believed to be reliable, but we cannot guarantee their accuracy or completeness. All such information is subject to change at any time without notice. IC Markets assumes no responsibility for the content of any linked site. The fact that such links may exist does not indicate approval or endorsement of any material contained on any linked site.
IC Markets is not liable for any harm caused by the transmission, through accessing the services or information on this site, of a computer virus, or other computer code or programming device that might be used to access, delete, damage, disable, disrupt or otherwise impede in any manner, the operation of the site or of any user’s software, hardware, data or property.


