
DXY:
Looking at the DXY chart, we can see that there is a strong bearish momentum. There is potential for a continuation towards the first support level at 101.93, which is a swing low support level and coincides with a 78.60% Fibonacci retracement. If prices were to drop further, they could reach the second support level at 100.82, which is also a swing low support level.
On the other hand, the first resistance level is at 103.48, which is an overlap resistance level and coincides with a 38.20% Fibonacci retracement. Breaking through this resistance could lead to a rise towards the second resistance level at 104.60, which is also an overlap resistance level.
It’s worth noting that there is an intermediate support level at 102.62, which is an overlap support level. Traders should keep an eye on this level as a break of this intermediate support could trigger a strong bearish acceleration towards the first support level.
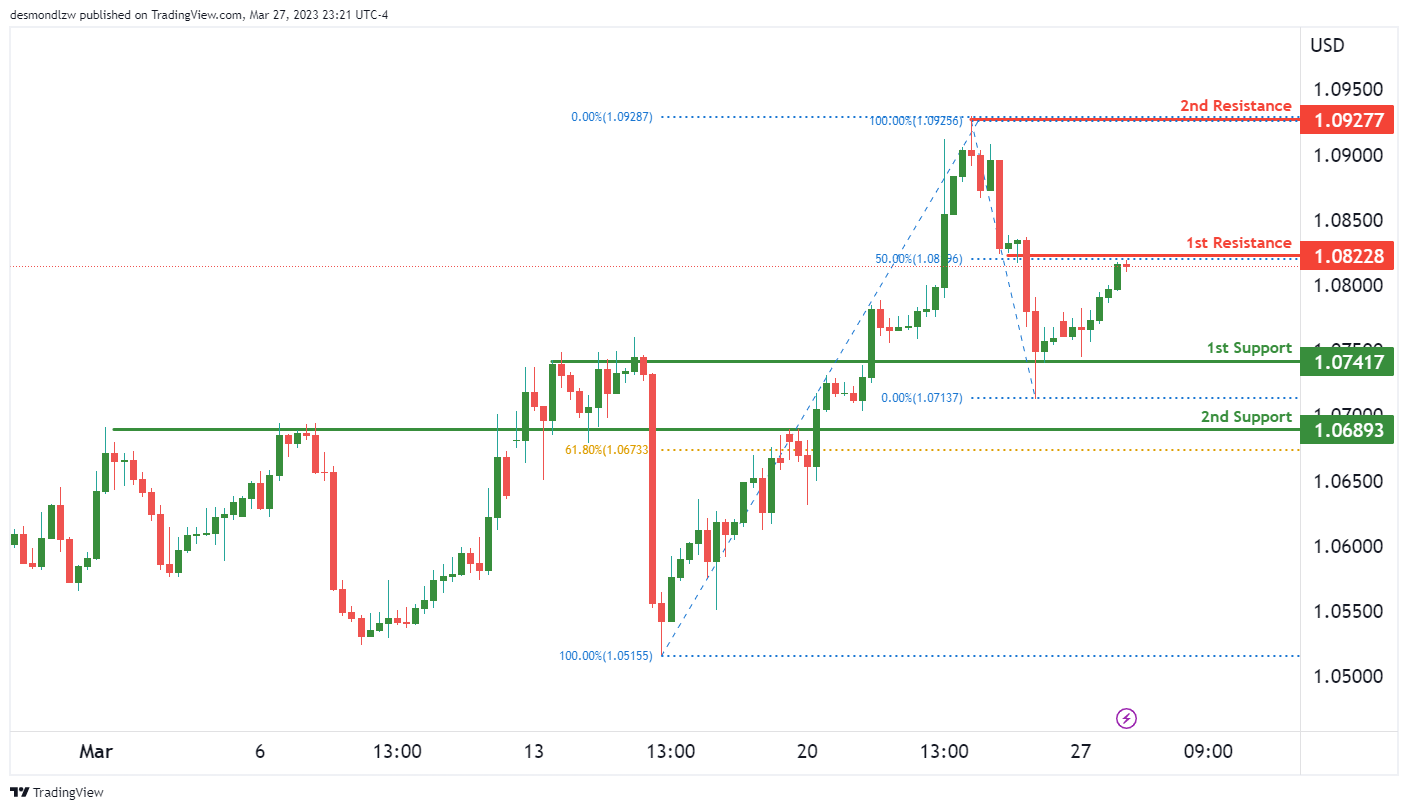
EUR/USD:
The EUR/USD chart is currently showing bearish momentum, with potential for a bearish reaction off the first resistance level at 1.0822 and a subsequent drop to the first support level at 1.0741. The first support level is an overlap support level, while the second support level at 1.0689 is also an overlap support level and coincides with the 61.80% Fibonacci retracement level.
On the other hand, the first resistance level is a swing high resistance at 1.0822, which also coincides with the 50% Fibonacci retracement level. Breaking through this resistance could lead to a rise towards the second resistance level at 1.0927, which is another swing high resistance level.
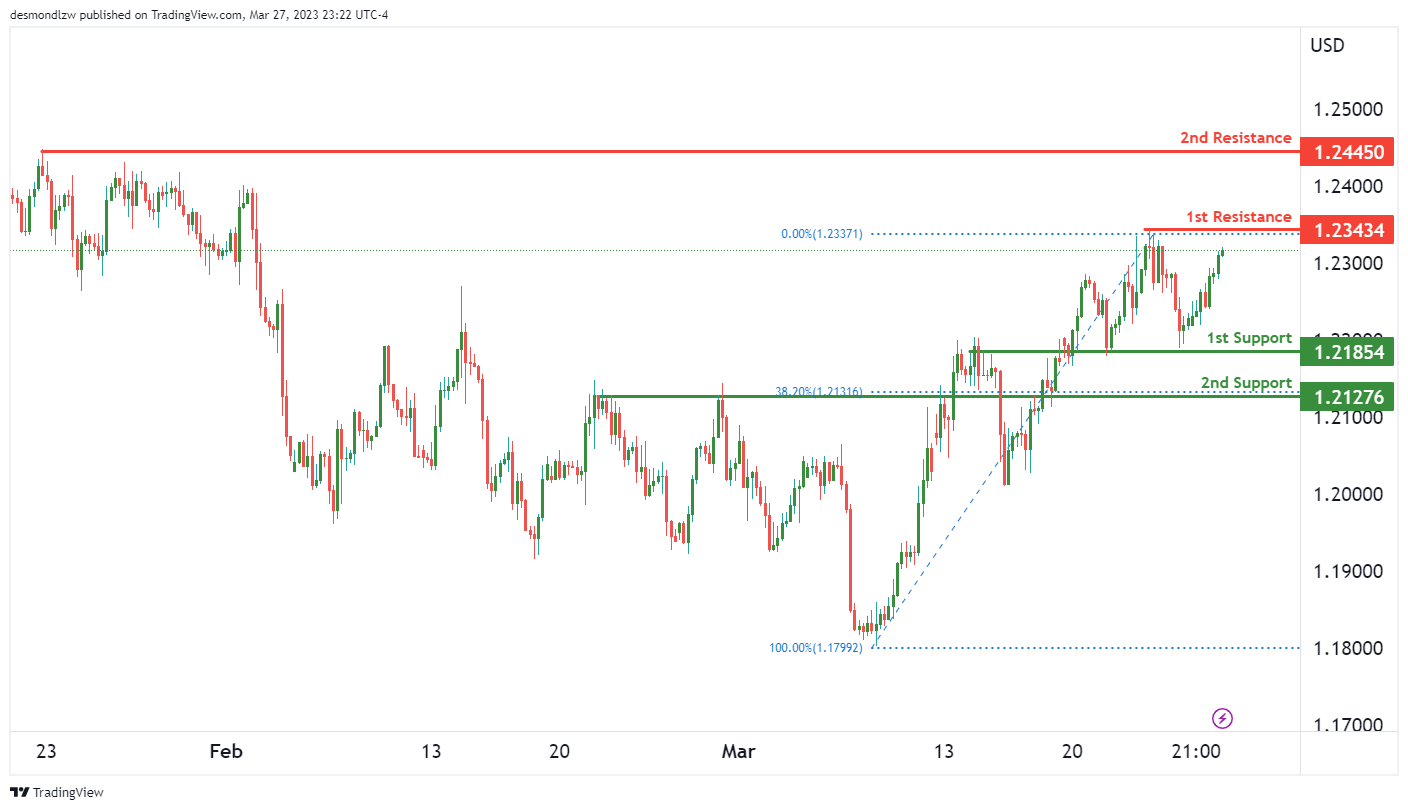
GBP/USD:
The GBP/USD chart is currently showing a bearish momentum with the potential for a continuation towards the first support level at 1.2185, which is an overlap support level. If the price were to drop further, it could reach the second support level at 1.2127, which is also an overlap support level and coincides with the 38.20% Fibonacci retracement level.
On the other hand, the first resistance level is at 1.2343, which is a multi-swing high resistance level. If the price were to bounce from this level, it could potentially drop towards the first support level. However, if the price were to break through the first resistance level, it could rise towards the second resistance level at 1.2445, which is a swing high resistance level.
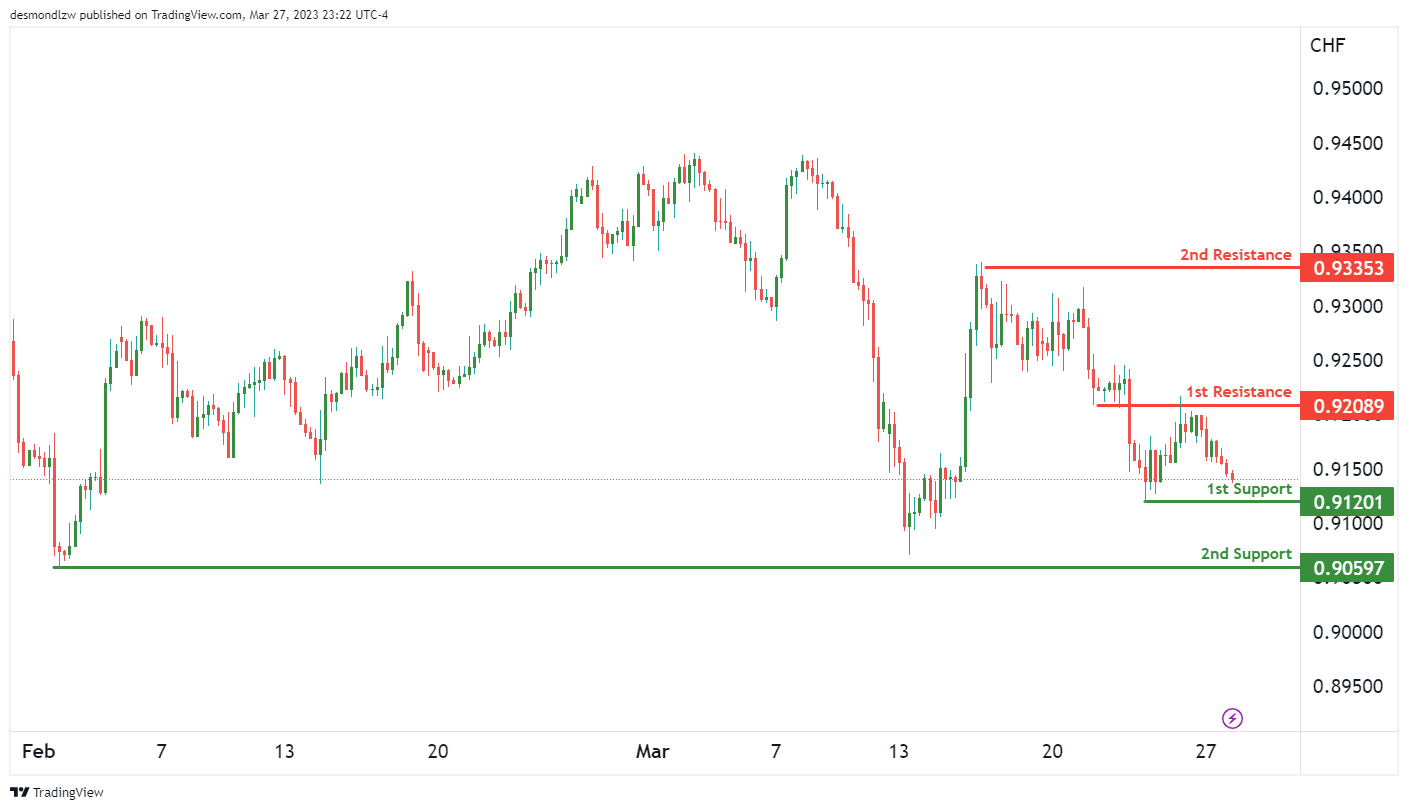
USD/CHF:
The USD/CHF chart is currently showing bearish momentum, indicating a potential for a continuation towards the first support level at 0.9120. This level is a swing low support, which makes it a strong candidate for a potential bounce. In addition, there is a second support level at 0.9059, which is also a swing low support and could provide further support if prices were to drop further.
On the other hand, the first resistance level is at 0.9208, which is an overlap resistance level that coincides with a potential retracement level. If prices were to rise, they could potentially reach the second resistance level at 0.9335, which is a multi-swing high resistance level.
Overall, the momentum of the chart is bearish, indicating that prices could continue to drop towards the first support level. However, traders should keep an eye on the chart for any potential breakouts or market movements that could cause prices to rise towards the resistance levels.
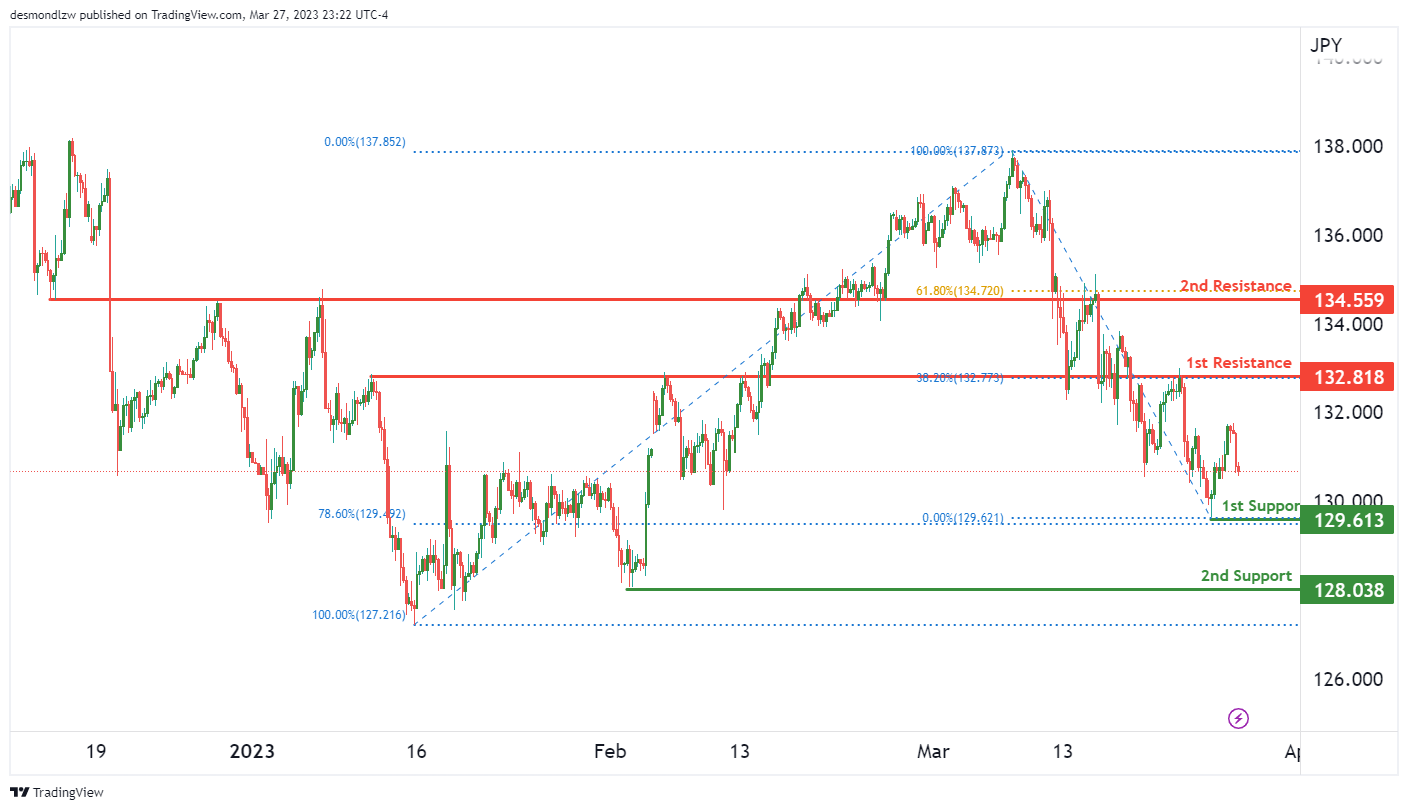
USD/JPY:
The USD/JPY chart currently shows bearish momentum, indicating that prices could potentially continue to move downwards. The first support level is at 129.61, which is a swing low support and coincides with the 78.60% Fibonacci retracement level. The second support level is at 128.03, which is also a swing low support. On the resistance side, the first level is at 132.81, which is an overlap resistance and lines up with the 38.20% Fibonacci retracement level. The second resistance level is at 134.55, which is also an overlap resistance and coincides with the 61.80% Fibonacci retracement level. If prices break the first support, it could potentially drop down to the second support level. However, if prices break the first resistance, it could potentially move upwards towards the second resistance.
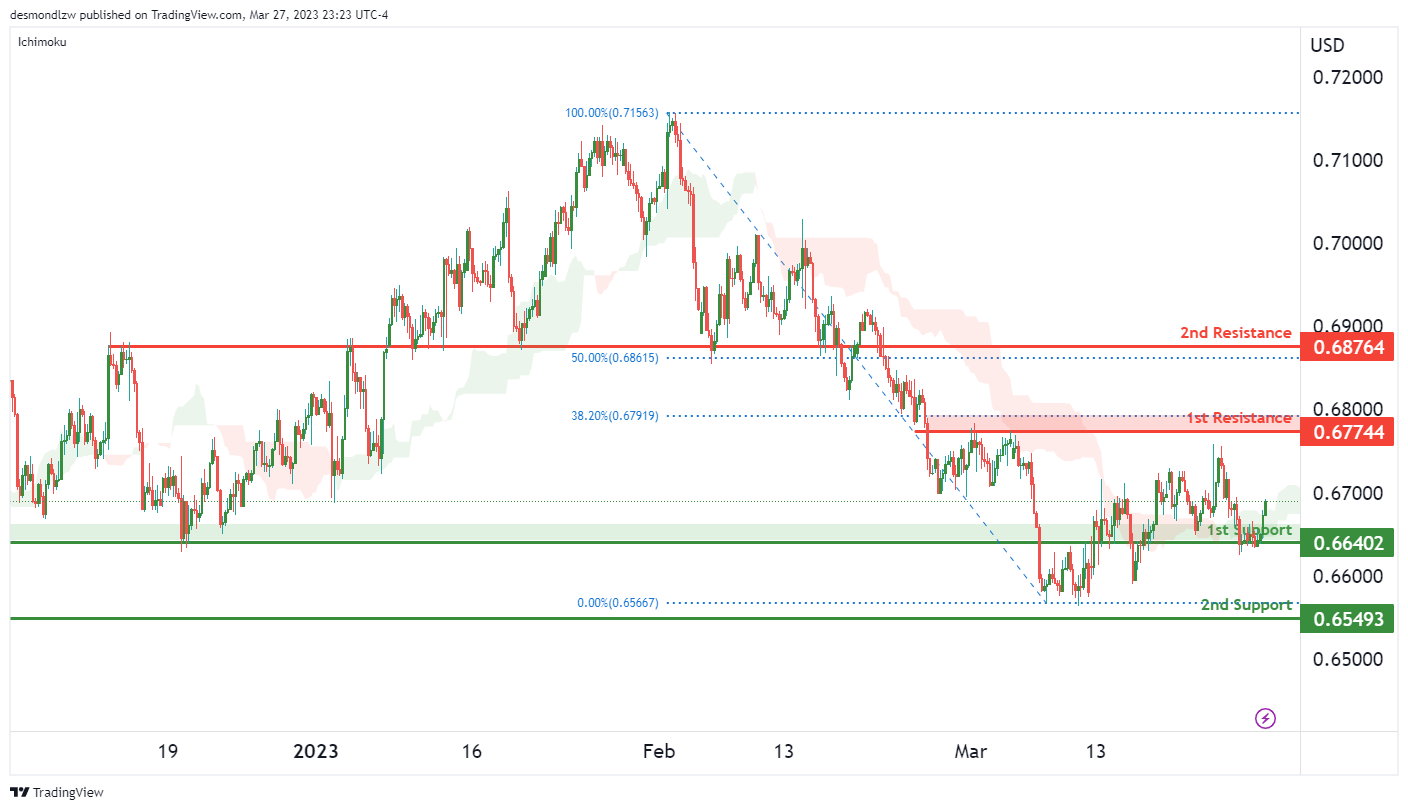
AUD/USD:
The AUD/USD chart is currently showing a bullish momentum, with price above the Ichimoku cloud. This suggests that the uptrend may continue.
If price were to continue to rise, it could potentially reach our 1st resistance at 0.6774, which is a strong overlap resistance level and coincides with a 38.20% Fibonacci retracement.
In the event of a price drop, the first support level to look out for is at 0.6640, which is a strong overlap support level. If price were to break this support level, it could potentially drop to the 2nd support at 0.6549, which is also a swing low support.
There is a 2nd resistance level at 0.6876 which is a significant overlap resistance level and coincides with a 50% Fibonacci retracement. If price were to break this resistance level, it could potentially rise even further.
Overall, the bullish momentum in the AUD/USD chart suggests that price may continue to rise towards the 1st resistance level at 0.6774. However, it’s important to monitor the support levels at 0.6640 and 0.6549 in case of a price drop.
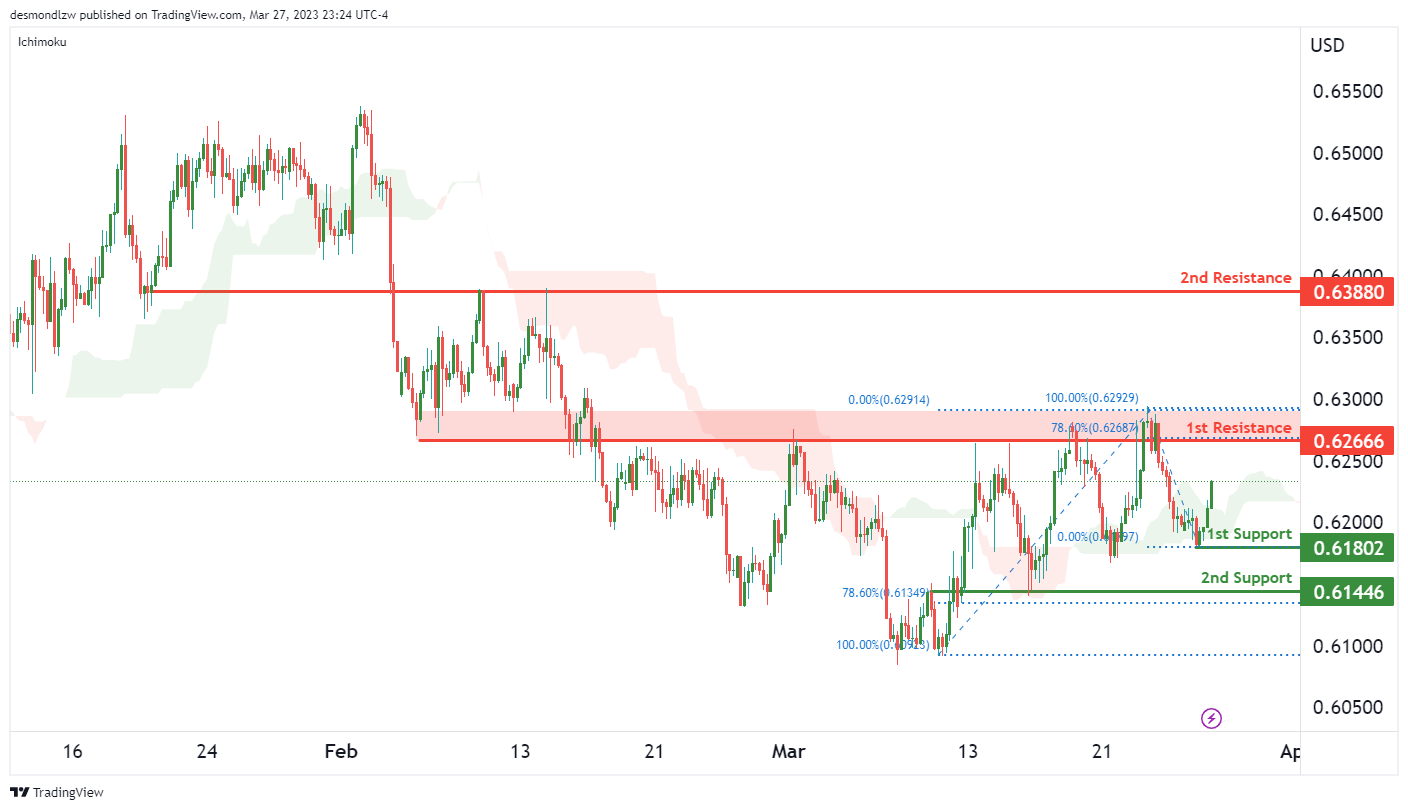
NZD/USD:
The overall momentum of NZD/USD for this particular instrument has been bullish. One of the key factors contributing to this bullish momentum is the fact that price is currently above the bullish Ichimoku cloud. With that in mind, there is a potential for a bullish continuation towards the 1st resistance level.
The 1st support level is situated at 0.6180 and is a good level to look out for, as it is a swing low support. The 2nd support level at 0.6144 is also significant as it is an overlap support and is aligned with the 78.60% Fibonacci retracement.
On the other hand, the 1st resistance level is at 0.6266, which is another overlap resistance and is aligned with the 78.60% Fibonacci retracement. If price were to break this level, the next resistance level to look out for would be the 2nd resistance at 0.6388, which is also an overlap resistance.
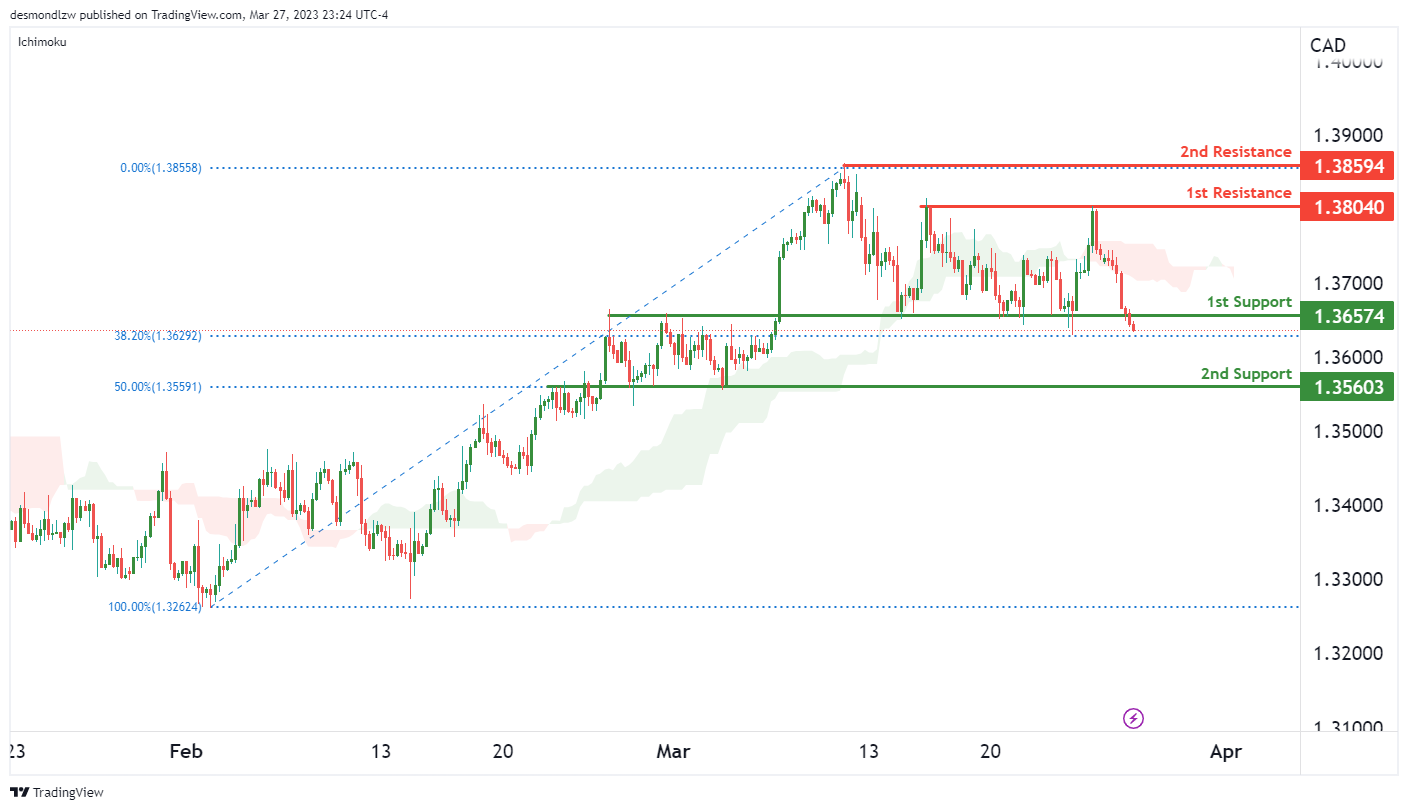
USD/CAD:
The overall momentum of the USD/CAD chart is bearish, with price currently trading below the bearish Ichimoku cloud. There is a possibility of a bearish break off the 1st support level, which could result in a drop towards the 2nd support level
The 1st support level is at 1.3657, and it is a strong overlap support level, coinciding with a 38.20% Fibonacci retracement. If price were to break below this level, it could potentially drop towards the 2nd support level at 1.3560, which is another overlap support level coinciding with a 50% Fibonacci retracement.
On the other hand, there are two resistance levels to watch out for. The 1st resistance level is at 1.3804, and it is a swing high resistance. The 2nd resistance level is at 1.3859, which is also a swing high resistance.
Given the current bearish momentum of the chart, there is a higher probability of a drop towards the support levels rather than a rise towards the resistance levels. However, it is important to monitor price action closely, as a break above the 1st resistance level could potentially shift the bias towards a more bullish outlook.
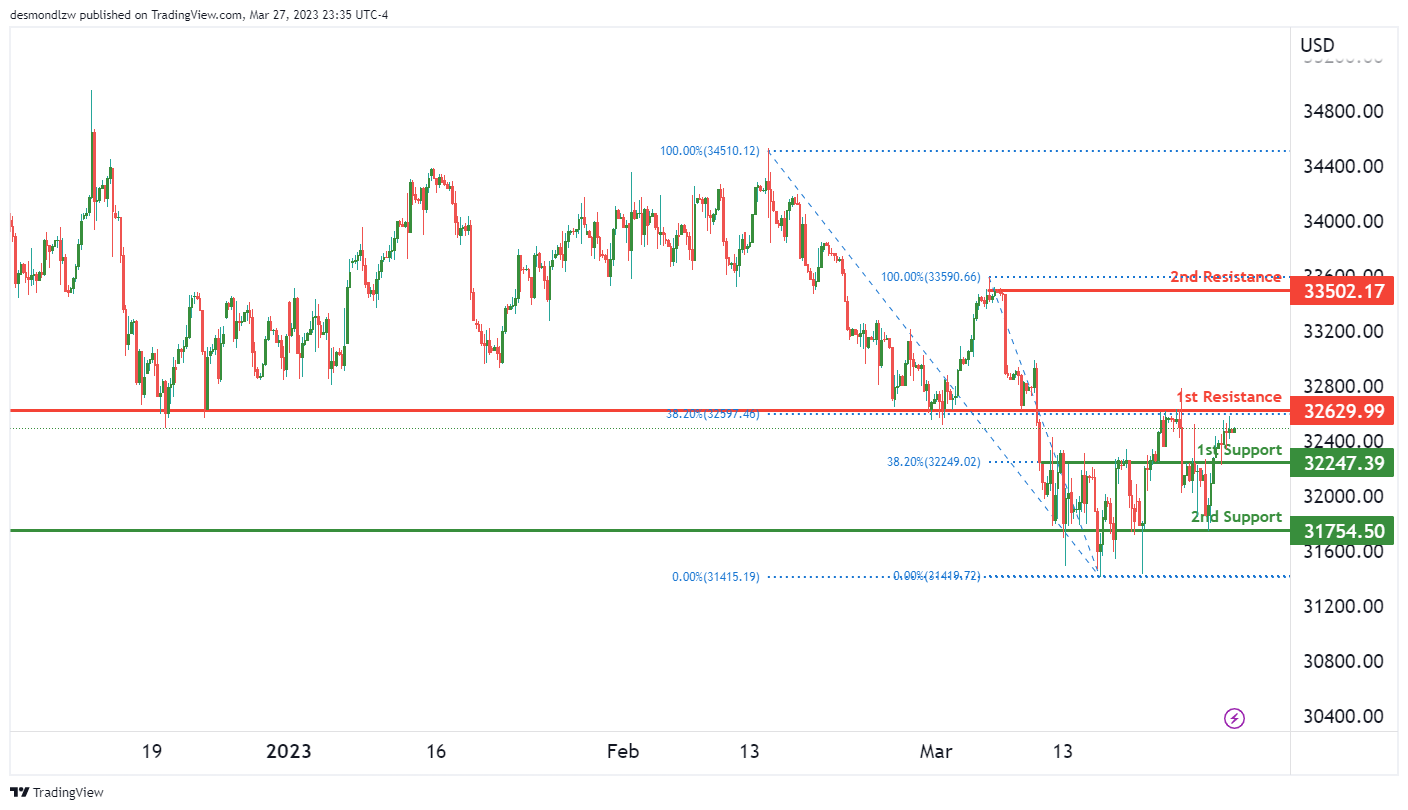
DJ30:
The DJ30 chart is currently showing a neutral momentum, indicating that there is no clear direction or trend at present. The price may fluctuate between the first resistance and support levels in the near future.
The first support level is at 32,247 and is a strong overlap support level that coincides with the 38.20% Fibonacci retracement level. The second support level is at 31,754 and is a swing low support level that has been tested multiple times in the past.
On the other hand, the first resistance level is at 32,629 and is another strong overlap resistance level that coincides with the 38.20% Fibonacci retracement level. The second resistance level is at 33,502 and is a swing high resistance level.
It is important to note that there is no clear momentum driving the price in a certain direction at present.
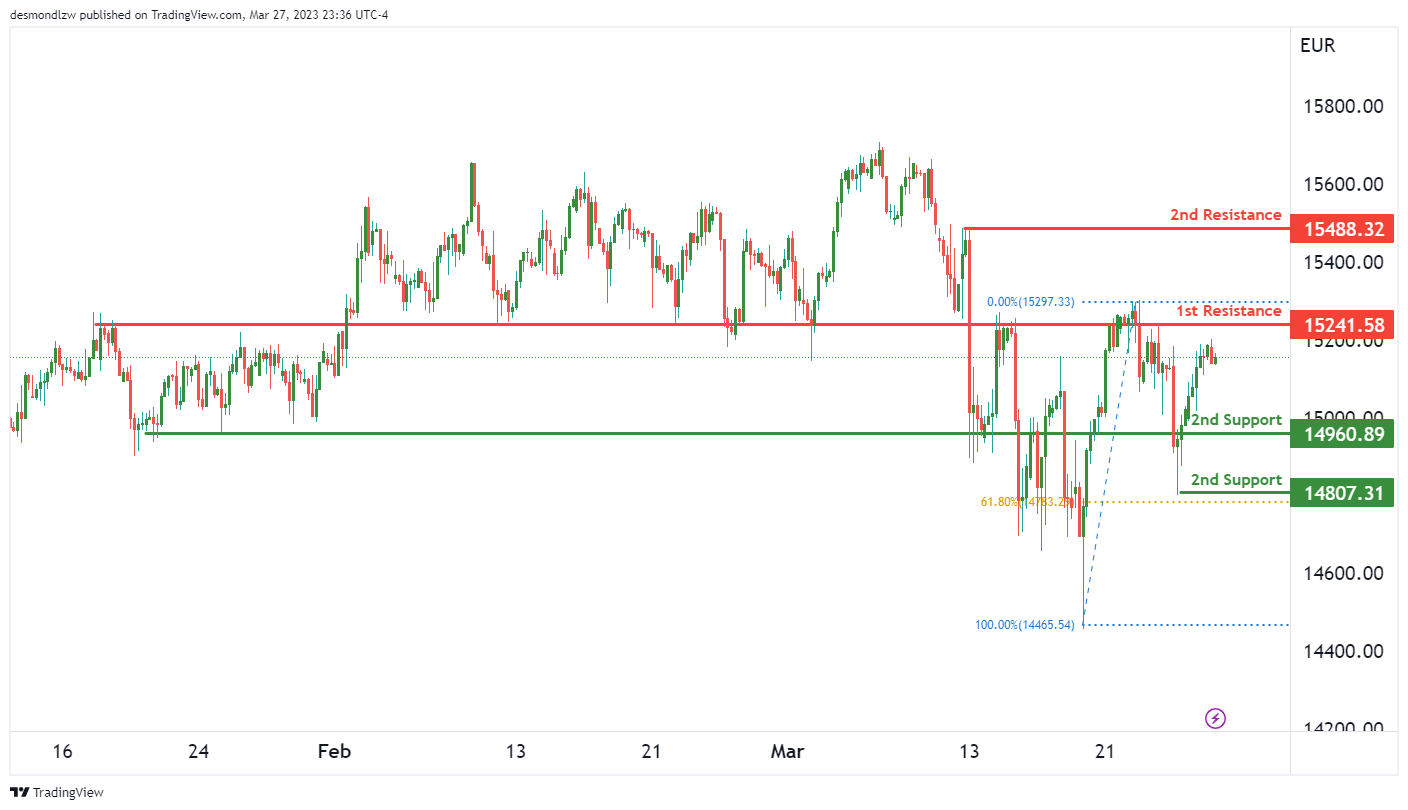
GER30:
The GER30 chart is currently showing bullish momentum, with price potentially making a continuation towards the 1st resistance level. Price is currently above the Ichimoku cloud, which suggests further bullish momentum could be in store.
The 1st support level is at 14960, which is a strong overlap support. If price were to bounce from this level, it could rise to the 1st resistance level at 15241. This level is also an overlap resistance, which adds to its significance.
If price were to break the 1st resistance, it could potentially rise towards the 2nd resistance at 15488. This level is a multi-swing high resistance and could provide a significant challenge for bulls.
However, if price were to drop, the 2nd support level at 14807 could provide a potential rebound point. This level is a swing low support and also lines up with the 78.60% Fibonacci retracement, making it a strong support zone.
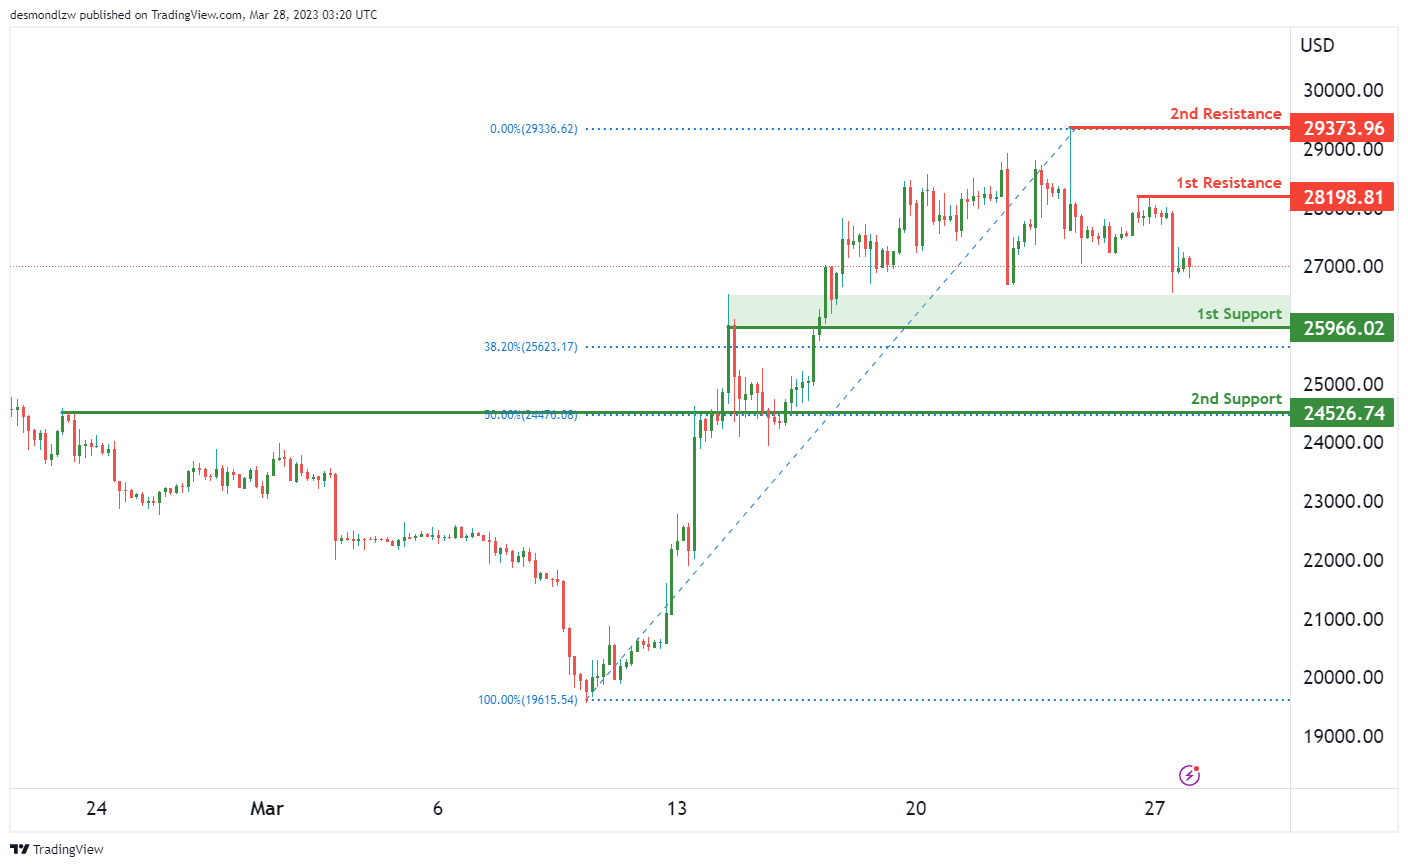
BTC/USD:
The overall momentum of the BTC/USD chart is currently bearish. Price has the potential to make a bearish continuation towards the 1st support level, which is at 25966. This level is an overlap support and coincides with a 38.20% Fibonacci retracement, making it a strong level of potential support. If price were to break below this level, the next support level it could drop to is the 2nd support at 24526. This level is also an overlap support and lines up with the 50% Fibonacci retracement, making it another strong level of potential support.
On the resistance side, the 1st resistance is at 28198. This level is a swing high resistance and could potentially act as a level where price might reverse its downward momentum. The 2nd resistance is at 29373, which is also a swing high resistance and could be another level where price may reverse its downward momentum.
Overall, it seems like the BTC/USD chart is exhibiting bearish momentum. The support and resistance levels discussed above suggest that price could potentially drop further towards the 1st and 2nd support levels. It’s important to keep an eye on these levels as a break of the 1st support could signal a potential move down towards the 2nd support. On the other hand, a break above the 1st resistance could indicate a potential reversal in the bearish momentum.
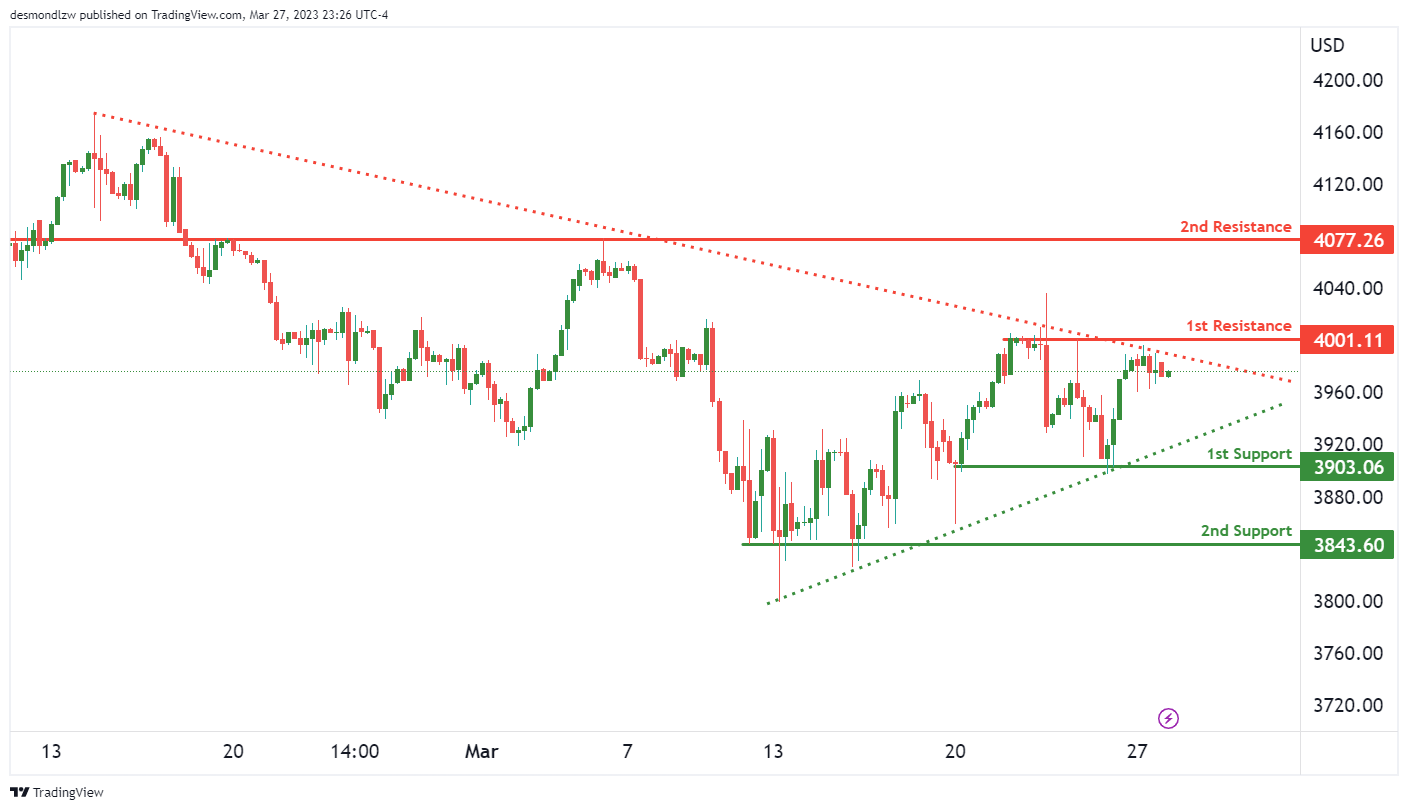
US500
The US500 chart shows overall bullish momentum, with price above a major ascending trend line indicating further potential bullish momentum on the horizon. However, there is also a major descending trend line above price, suggesting that bearish momentum could also be on the cards.
In terms of potential price movement, the US500 could see a bearish continuation towards its 1st support at 3903.06, which is a multi-swing low support level. If this level were to break, the next support is at 3843.60, another multi-swing low support.
On the other hand, if bullish momentum continues, price could rise towards the 1st resistance level of 4001.11, which is a multi-swing high resistance level. The 2nd resistance level is at 4007.26, an overlap resistance level.
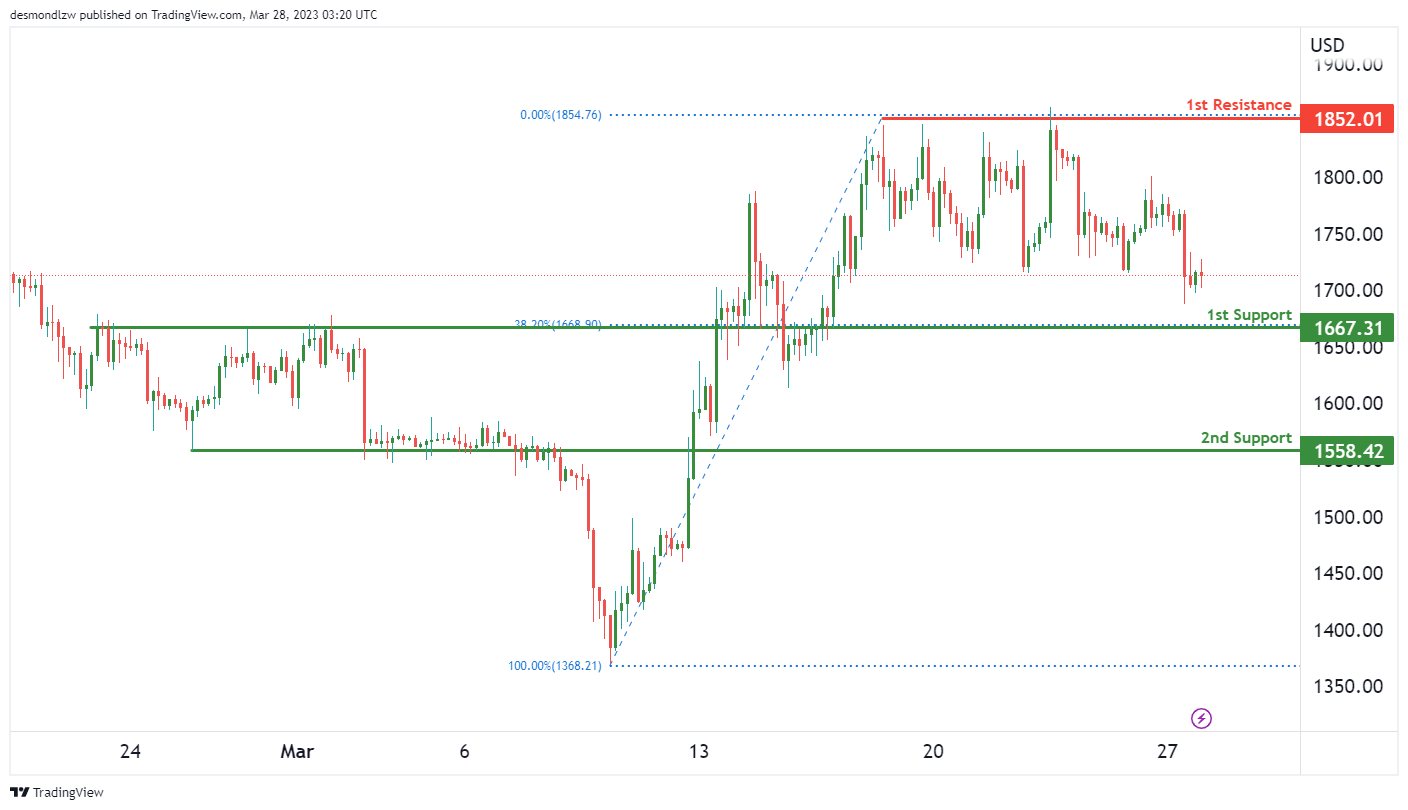
ETH/USD:
ETH/USD Continues Bearish Momentum, Potential for Drop to 1st Support
The overall momentum of the ETH/USD chart is currently bearish, with the price potentially making a bearish continuation towards the 1st support level. This is indicated by the price being below the bearish Ichimoku cloud.
The 1st support level for ETH/USD is at 1667.31. This level is a good support as it is an overlap support and also has a 38.20% Fibonacci retracement lining up with it. If the price were to break below this level, it could potentially drop towards the 2nd support level at 1558.42, which is another overlap support.
On the other hand, the 1st resistance level for ETH/USD is at 1852.01, which is a multi-swing high resistance. The price has struggled to break above this level in the past, indicating strong selling pressure from the bears.
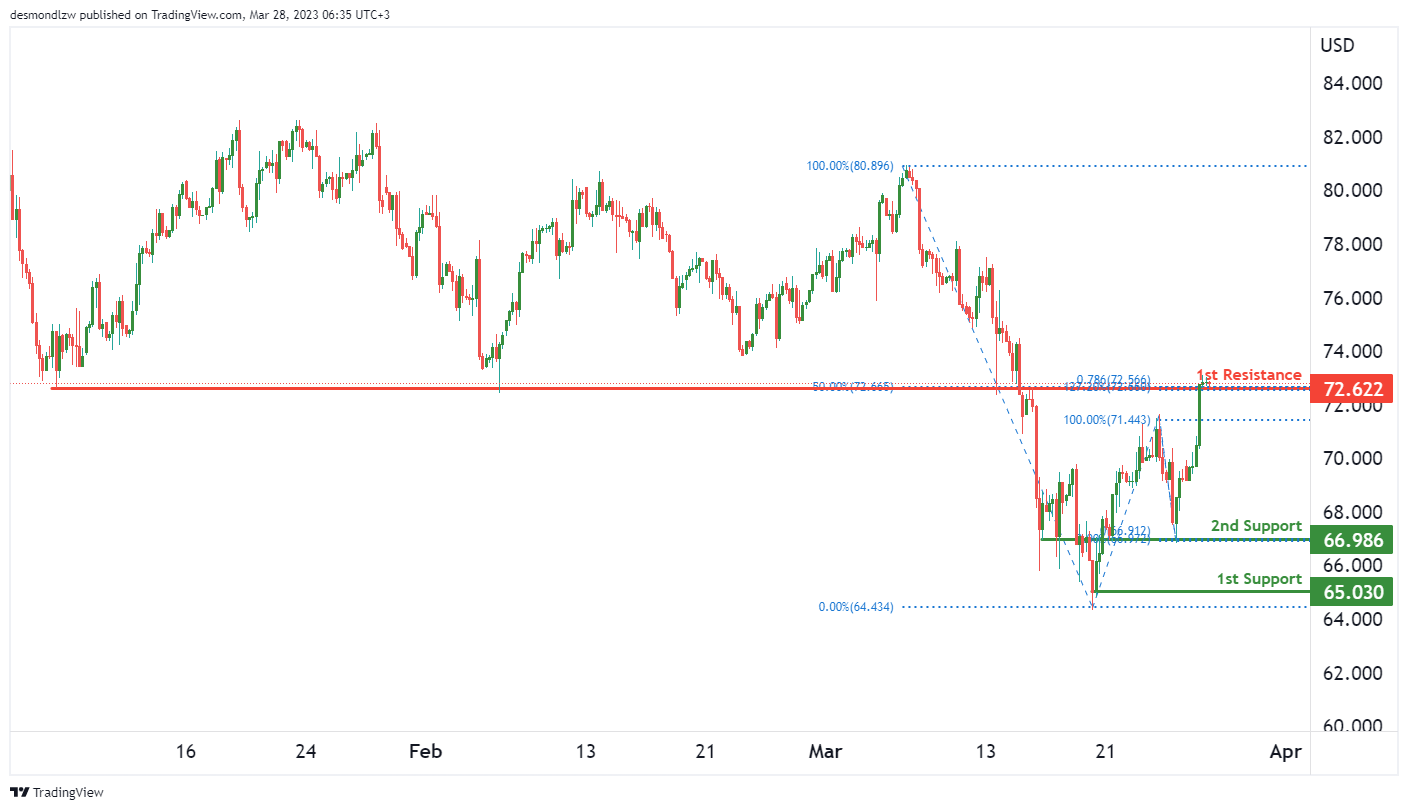
WTI/USD:
Possible Article:
WTI: Potential for Bearish Reaction off 1st Resistance and Drop to 1st Support
The overall momentum of the WTI chart is currently bearish, with price potentially making a bearish reaction off 1st resistance and dropping to 1st support.
The 1st support level to watch is at 66.98. This level is an overlap support and has held as support in the past. If price were to break below this level, it could drop towards the 2nd support at 65.03, which is a multi-swing low support.
On the other hand, the 1st resistance level to watch is at 72.62. This level is an overlap resistance and has acted as a ceiling to price in the past. It also coincides with the 127.20% Fibonacci retracement, adding more significance to the level.
If price were to react off the 1st resistance and drop towards the 1st support, it would confirm the bearish momentum of the chart. However, if price were to break above the 1st resistance, it could potentially rise towards higher resistance levels.
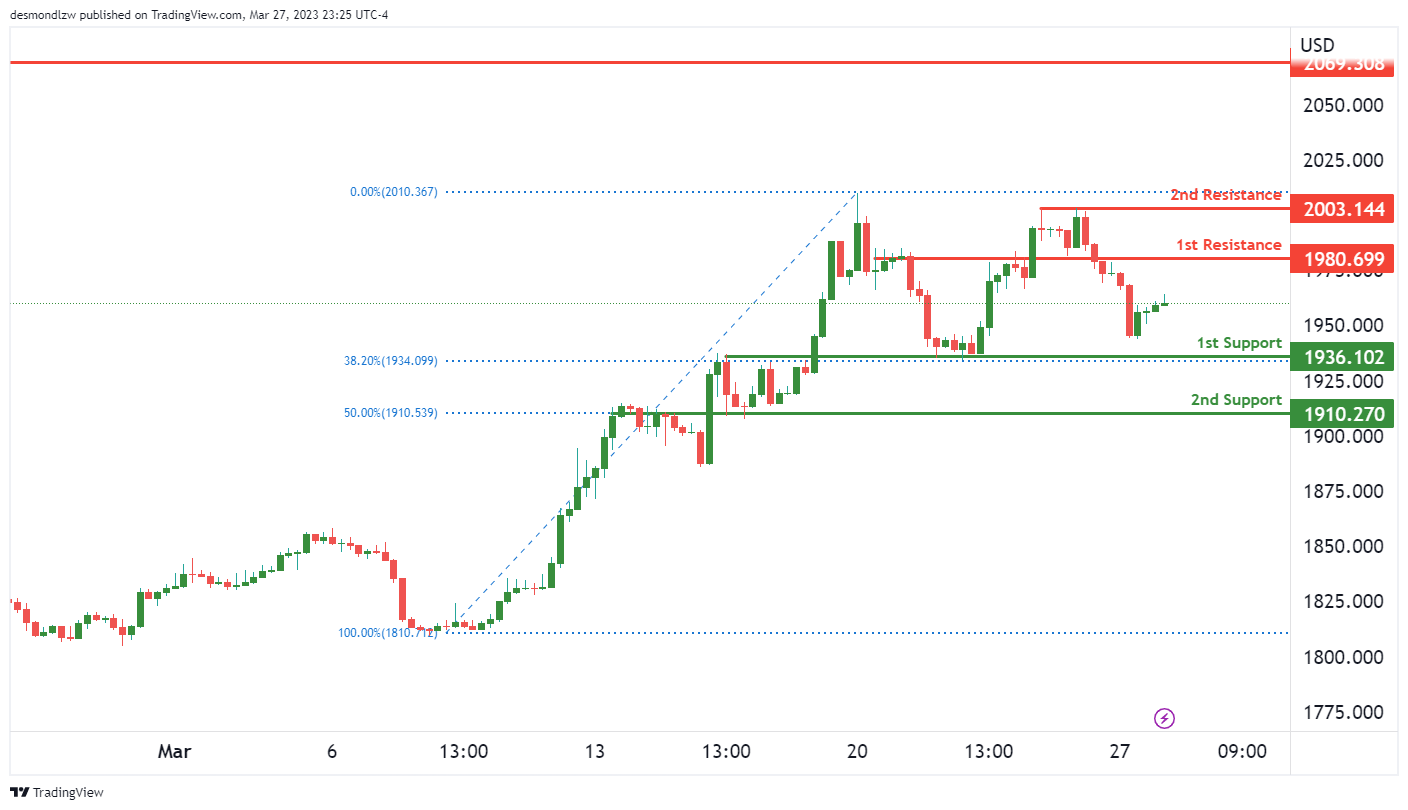
XAU/USD (GOLD):
Gold Maintains Bullish Momentum, Could See Continuation Towards Resistance Levels
Gold’s overall momentum remains bullish, as the precious metal continues to trade above key support levels. Currently, gold is trading at around $1965.00 against the US dollar.
Price could potentially see a bullish continuation towards the 1st resistance level of $1980.00. However, it may encounter some resistance at this level, which coincides with a strong overlap resistance.
If price manages to break through the 1st resistance, it could potentially rise towards the 2nd resistance level of $2003.00, which is a multi-swing high resistance.
On the downside, there are two support levels to watch out for. The 1st support level is at $1963.00, which is a key overlap support level and a 38.20% Fibonacci retracement. The 2nd support level is at $1910.00, which is also an overlap support level and a 50% Fibonacci retracement.
The accuracy, completeness and timeliness of the information contained on this site cannot be guaranteed. IC Markets does not warranty, guarantee or make any representations, or assume any liability regarding financial results based on the use of the information in the site.
News, views, opinions, recommendations and other information obtained from sources outside of www.icmarkets.com, used in this site are believed to be reliable, but we cannot guarantee their accuracy or completeness. All such information is subject to change at any time without notice. IC Markets assumes no responsibility for the content of any linked site.
The fact that such links may exist does not indicate approval or endorsement of any material contained on any linked site. IC Markets is not liable for any harm caused by the transmission, through accessing the services or information on this site, of a computer virus, or other computer code or programming device that might be used to access, delete, damage, disable, disrupt or otherwise impede in any manner, the operation of the site or of any user’s software, hardware, data or property.


