
A note on lower timeframe confirming price action…
Waiting for lower timeframe confirmation is our main tool to confirm strength within higher timeframe zones, and has really been the key to our trading success. It takes a little time to understand the subtle nuances, however, as each trade is never the same, but once you master the rhythm so to speak, you will be saved from countless unnecessary losing trades. The following is a list of what we look for:
- A break/retest of supply or demand dependent on which way you’re trading.
- A trendline break/retest.
- Buying/selling tails/wicks – essentially we look for a cluster of very obvious spikes off of lower timeframe support and resistance levels within the higher timeframe zone.
- Candlestick patterns. We tend to only stick with pin bars and engulfing bars as these have proven to be the most effective.
We search for lower timeframe confirmation between the M15 the H1 timeframes, since most of our higher-timeframe areas begin with the H4. Stops are usually placed 5-10 pips beyond confirming structures.
EUR/USD:
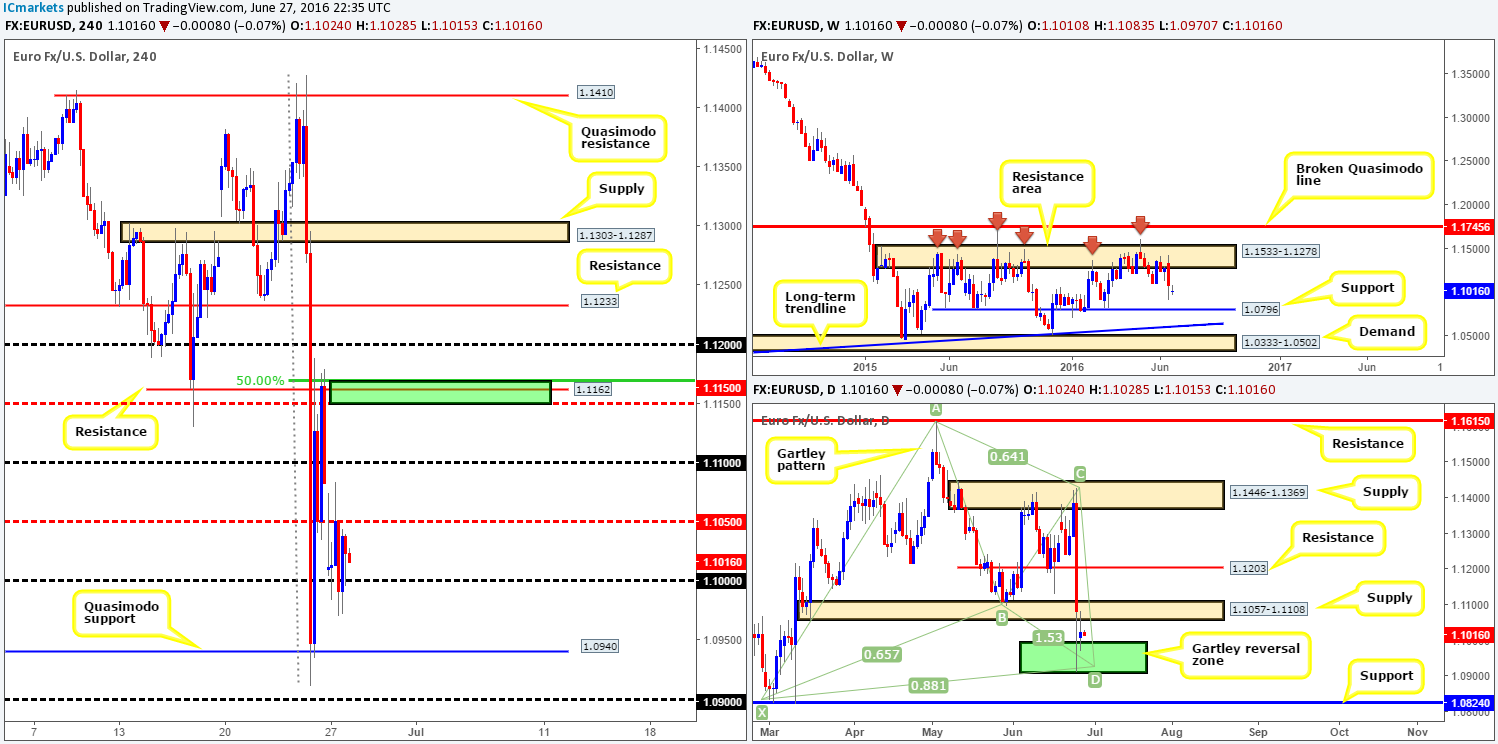
During the course of yesterday’s sessions the EUR/USD took on a more sober tone in comparison with Friday’s ‘Brexit’ action. The day started by gapping 72 pips lower, which, as you can see, was filled going into yesterday’s London open. From there on price entered into a phase of consolidation between the 1.10 handle and the H4 mid-way resistance line 1.1050.
In view of the above, how do things stand on the higher timeframes? The weekly resistance area at 1.1533-1.1278, once again, played a big part in last week’s trading. As a result of, it looks as though the single currency will eventually touch base with weekly support penciled in at 1.0796. Despite this, down on the daily chart we can see that price is now sandwiched between a daily Harmonic Gartley reversal zone (1.0910/1.0994 – green zone) and a daily supply area at 1.1057-1.1108. Beyond this supply we have a daily resistance line registered at 1.1203, and just below the Gartley reversal zone, there’s a daily support which stands at 1.0824.
Our suggestions: Given the somewhat subdued movement seen yesterday, here is what we’re looking at right now:
- Although the weekly chart shows price trading from a weekly resistance area at 1.1533-1.1278, we still really like the look of the H4 Quasimodo support line at 1.0940. Not only is this number positioned within the daily Gartley reversal zone at 1.0910/1.0994, it was also here where price began to reverse following the ‘Brexit’ shock.
- The 1.11 handle. This number is not only supported by a 38.2% Fib resistance at 1.1109, but it is also lodged within the extremes of the daily supply area mentioned above at 1.1057-1.1108.
- The H4 resistance at 1.1162 (green rectangle) is also a line we’ll be keeping an eye on today/this week due to the fact that this is where price also managed to bounce during ‘Brexit’. In addition, this area is bolstered together with a H4 Fib resistance at 1.1170 and a H4 mid-way resistance at 1.1150. Do, however, keep your eyes open here as a fakeout through this zone up to daily resistance at 1.1203 (along with the 1.12 handle) is highly possible.
Given the likelihood of ‘post-Brexit’ volatility, we would not recommend placing pending orders at either of the above said barriers as you’re opening yourself up to the possibility of getting faked out. Waiting for lower timeframe confirmation is, in our opinion, the best path to take. Confirmation for our team is either a break of a supply/demand followed by a subsequent retest, a trendline break/retest or simply a collection of well-defined buying/selling tails/wicks around the higher timeframe level.
Levels to watch/live orders:
- Buys: 1.0940 region [Tentative – confirmation required] (Stop loss: dependent on where one confirms this area).
- Sells: 1.11 region [Tentative – confirmation required] (Stop loss: dependent on where one confirms this area). 1.1162 region [Tentative – confirmation required] (Stop loss: dependent on where one confirms this area).
GBP/USD:
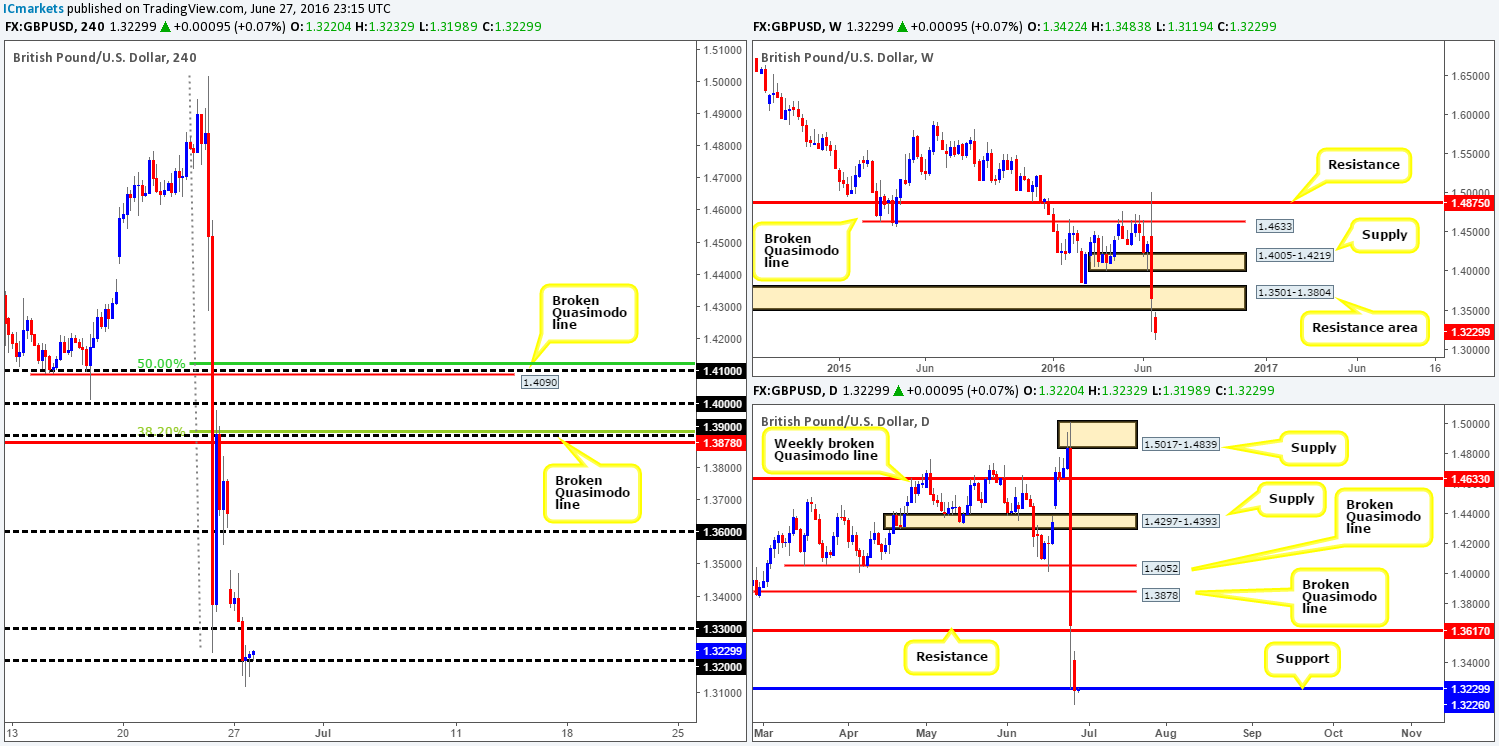
Following Sunday’s 240-pip gap lower, the GBP continued to decline in value against the US dollar yesterday, erasing a further 200 pips in the process! In spite of price finding support around the 1.32 handle as well as trading back around referendum lows 1.3226 (marked support on the daily timeframe), this storm is far from over as political uncertainty continues to plague the GBP currency.
Although one could take the three nice-looking H4 buying tails around 1.32 as a signal to go long, we would not label this a high-probability zone for a trade! We could go on for hours why one should or should not trade this pair. Of course we understand why bearish sentiment on this pair is strong and no doubt a lot of traders are trying to take advantage. However, we’re pretty sure the majority thought the pound was going to appreciate when the ‘remain’ camp was almost sure to take victory! This just proves that following the herd does not always work!
To put it simply, in times of trouble we either look for other opportunity elsewhere or simply remain flat. Trading is all about risk management and about acting in one’s own best interest, and trying a hand in this market when the Brits economy is up in the air is just too much of a gamble for us.
Levels to watch/live orders:
- Buys: Flat (Stop loss: N/A).
- Sells: Flat (Stop loss: N/A).
AUD/USD:
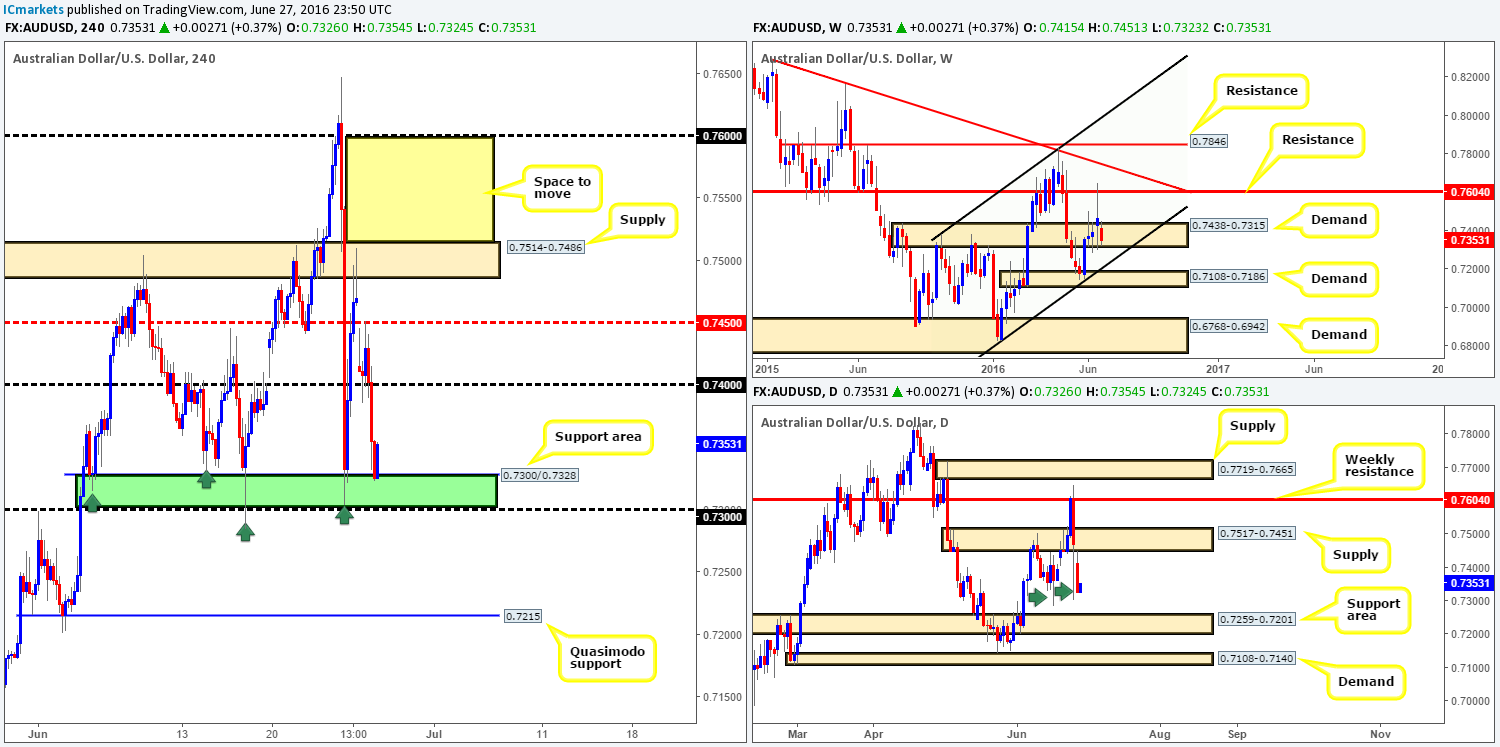
Beginning with a look at the weekly chart this morning, we can see that the bears are currently attacking the lower edge of weekly demand coming in at 0.7438-0.7315. In the event that the bears continue to dig lower from here, we could see the commodity currency touch base with weekly trendline support extended from the low 0.6827 sometime this week.
Looking down to the daily chart, price stabbed the underside of the daily supply at 0.7517-0.7451 yesterday and clocked lows of 0.7323 on the day. From this chart, very little active demand is seen below until price connects with the daily support area penciled in at 0.7259-0.7201. The reasoning behind our current line of thought stems from the two daily tails marked with green arrows at 0.7285/0.7304. These tails, at least in our view, highlight consumption. In other words both tails have already likely consumed the majority of bids around this area thus the path south is potentially clear down to the daily support area we just mentioned above at 0.7259-0.7201.
The picture we’re receiving on the H4 chart at the moment shows that the Aussie is now shaking hands with a H4 support area composed of the 0.73 handle and a H4 support at 0.7328. This barrier has held price higher on four occasions since June 6th and may very well do again today!
Our suggestions: Although the current H4 support area has proved strong during the month of June, our team is still wary since weekly buyers appear weak right now and daily candles indicate that further selling is on the cards (see above). In view of this, our team has come to a general consensus that looking for buys in this market is not something we favor. What we are interested in, nevertheless, is a close beyond 0.73 as this could set the stage for a continuation move south down to the H4 Quasimodo support line at 0.7215 (positioned deep within the aforementioned daily support area). For us to be given a green light to short following a close lower, we’d need to see price retest 0.73 as resistance followed by a lower timeframe sell signal (see the top of this report for ideas on lower timeframe signals).
Levels to watch/live orders:
- Buys: Flat (Stop loss: N/A).
- Sells: Watch for price to consume 0.73 and look to trade any retest seen thereafter (lower timeframe confirmation required).
USD/JPY:
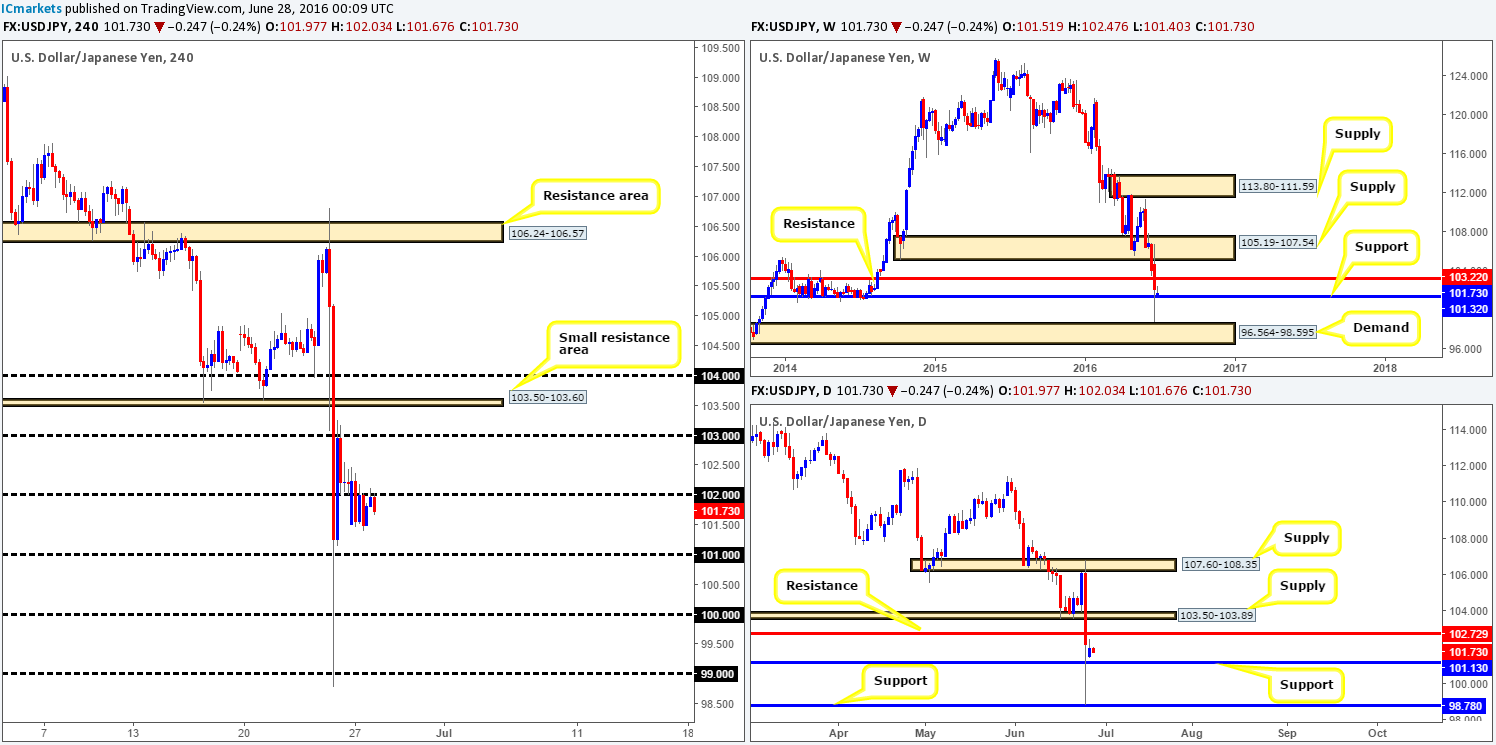
The aftermath of Friday’s sell-off saw the USD/JPY take on a more subdued tone on Monday, as price spent the majority of the day clinging to the underside of the 102 handle. From looking at only the H4 chart it is, at least for us, very difficult to judge direction at this time, so let’s take a quick peek over at the higher timeframe charts… Weekly action shows price flirting with weekly support at 101.32 at the moment, which, as you can see to the left of current price, held this market higher between the 10/02/14-21/07/14. Down on the daily chart, however, the buyers and sellers appear sandwiched in between daily support at 101.13 and a daily resistance at 102.72.
Our suggestions: Seeing as how current activity is trading from weekly support, technically, we would expect this market to cut through the 102 handle today and maybe try for the 103 mark. Nevertheless, safe-haven flows may continue to dominate this pair for the time being given the political uncertainty surrounding Britain. This is not to say that a close above 102 followed by a subsequent retest should be ignored. It simply means to be more cautious and wait for a lower timeframe buy signal to enter (see the top of this report for ideas on lower timeframe signals).
Levels to watch/live orders:
- Buys: Watch for price to consume 102 and look to trade any retest seen thereafter (lower timeframe confirmation required).
- Sells: Flat (Stop loss: N/A).
USD/CAD:
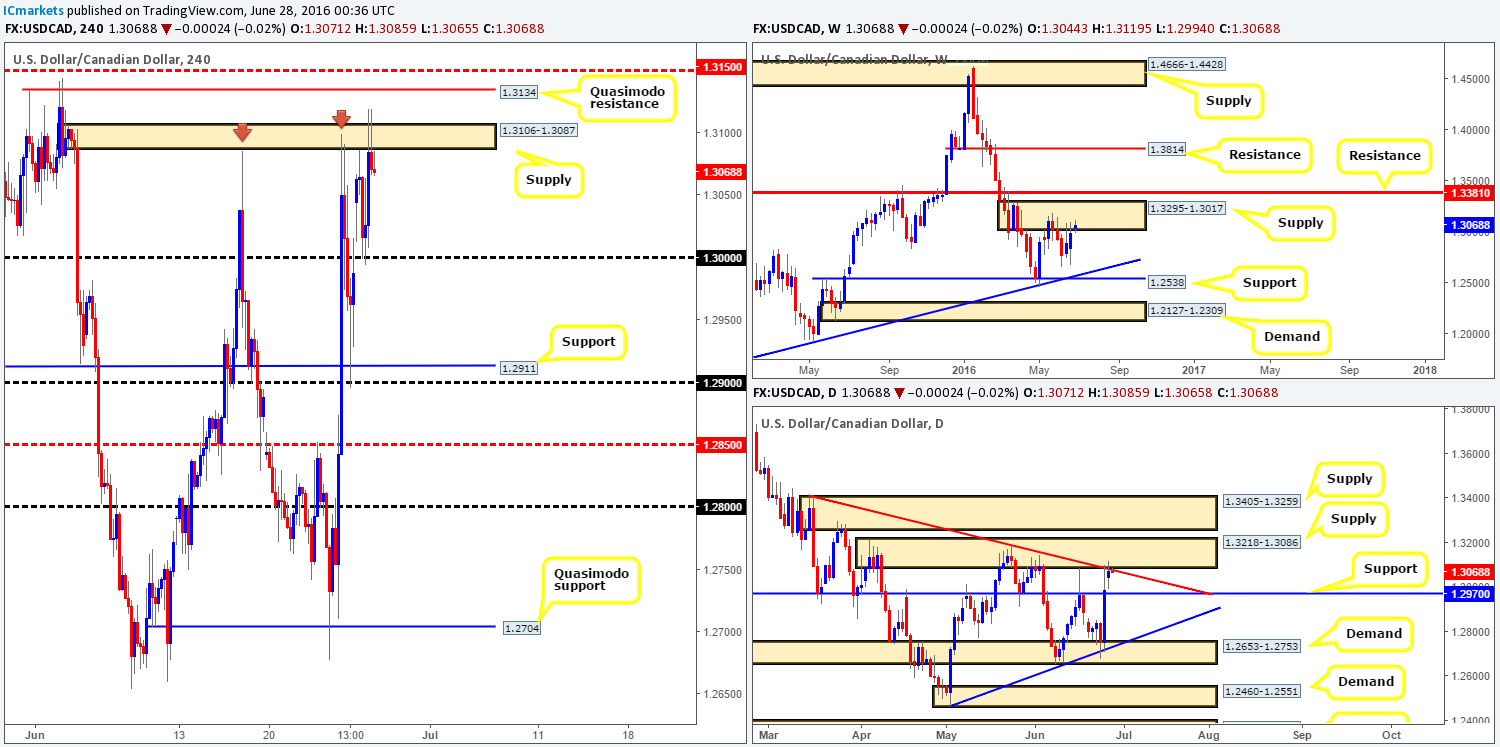
Supported by a bounce over in the oil market from H4 support at 45.95, the USD/CAD pair is seen selling-off following a whipsaw through H4 supply at 1.3106-1.3087. To our way of seeing things at the moment, this selling could continue going into today’s sessions. Our reasoning lies within the higher timeframe structure. On the weekly chart, it’s clear to see that weekly supply at 1.3295-1.3017 was recently brought into the action. This supply, although only a relatively newly-formed area, has managed to cap upside in this market since May 16th. In conjunction with weekly price, the daily chart shows that the buyers and sellers are seen battling for position around the underside of a daily supply base at 1.3218-1.3086 (merges with daily trendline resistance taken from the high 1.3405).
Our suggestions: In light of recent movement, our team is now looking for lower timeframe sell opportunities (see the top of this report for entry techniques), targeting the key figure 1.30. The logic behind this move, apart from the converging higher timeframe structures, is that buy stops above the current H4 supply have very likely been triggered, and these orders are possibly being used as liquidity by well-funded traders to move the market lower
Levels to watch/live orders:
- Buys: Flat (Stop loss: N/A).
- Sells: Look for lower timeframe sell opportunities below the H4 supply at 1.3106-1.3087
USD/CHF:
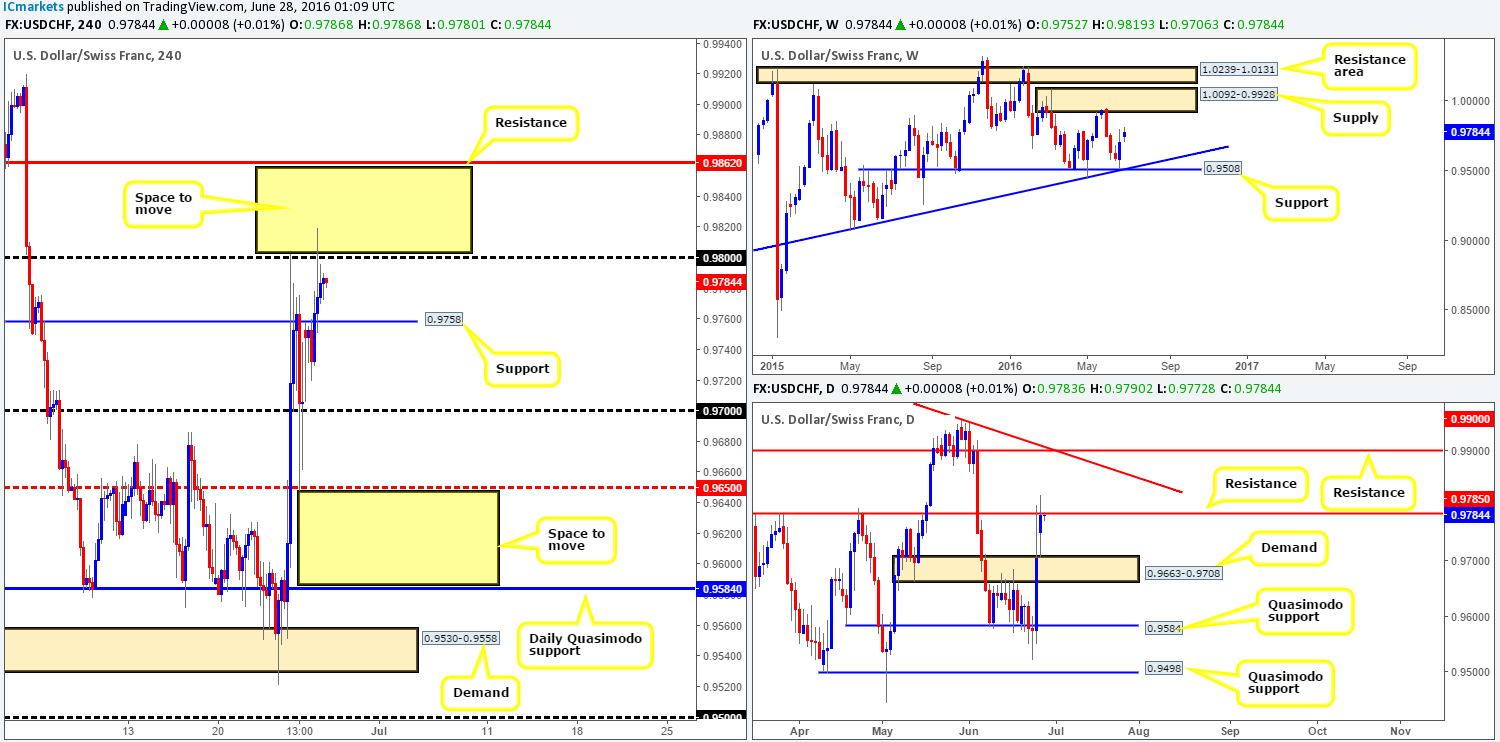
The USD/CHF, as you can see, managed to maintain a relatively strong bid tone during the course of yesterday’s trading, consequently bringing the Swissy to highs of 0.9819 on the day. At the time of writing, offers remain firm around the 0.98 handle which may lead to price shaking hands with H4 support at 0.9758 sometime today. Be that as it may, our team is looking for a close above 0.98 since beyond this number the pair seems all set to advance up to H4 resistance given at 0.9862.
A close above 0.98 would not only clear offers from this psychological boundary, but it would also take out the daily resistance line coming in at 0.9785. What is more, this would allow traders to then buy in-line with weekly expectations which shows that the path north is clear up to weekly supply drawn from 1.0092-0.9928.
Our suggestions: Watch for price to close above and retest 0.98 as support. Should this be fulfilled, one can then begin hunting for a lower timeframe entry, targeting the H4 resistance mentioned above at 0.9862, followed closely by the 0.99 hurdle (not only a round number but also a clear daily resistance). For those interested in looking to confirm this level before trading it, please see the top of this report.
Levels to watch/live orders:
- Buys: Watch for price to consume 0.98 and look to trade any retest seen thereafter (lower timeframe confirmation required).
- Sells: Flat (Stop loss: N/A).
DOW 30:
Despite the bounce seen from H4 demand at 17186-17227 in the early hours of yesterday morning, downside risk continues to plague this market as US stocks suffer for a second day on the back of political uncertainty surrounding Britain leaving the EU. Following a quick run to highs of 17374, price collapsed, taking out the H4 demand zone (now acting supply) and driving lower to greet daily support at 17079 going into the US session. This line – coupled with nearby weekly support which is also in play at 17135 could see this market change direction today. Nevertheless, buying the DOW is tricky given that H4 action is now seen within touching distance of the H4 supply at 17186-17227.
Our suggestions: Quite simply, for us to become buyers in this market the current H4 supply would need to be taken out. Only then could we begin looking to enter long on any dip seen (blue arrows), targeting the underside of the daily resistance area at 17396 (located just above yesterday’s high 17374).

Levels to watch/live orders:
- Buys: Watch for price to consume 17186-17227 and look to trade any retest seen thereafter (lower timeframe confirmation required).
- Sells: Flat (Stop loss: N/A).
Gold:
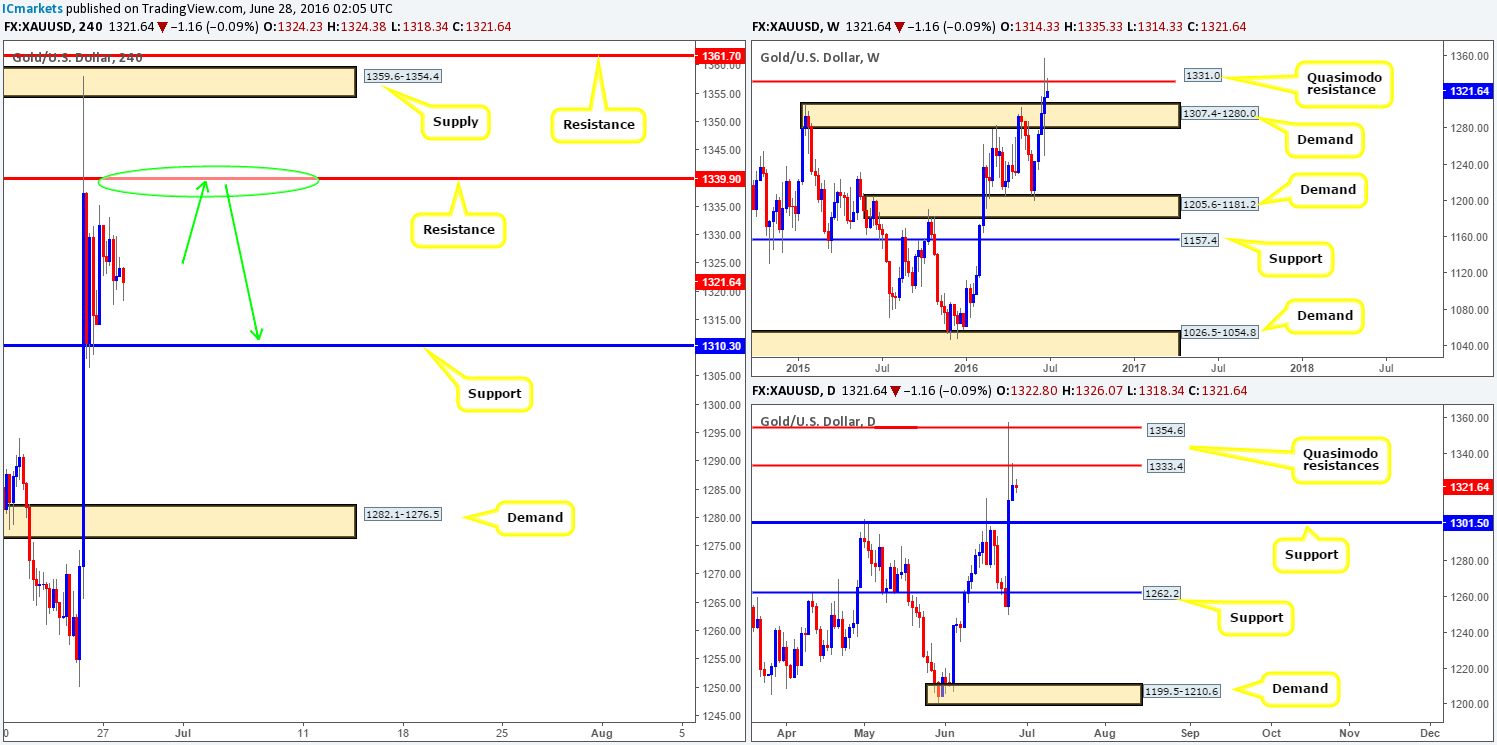
Shortly after the gold market opened for business, the bulls dug in deep and pushed price to highs of 1335.3. Following this spurt of buying, however, momentum diminished and price spent the rest of the day slowly grinding lower. This could have something to do with that fact that yesterday’s high connected almost to-the-pip with a daily Quasimodo resistance line at 1333.4.
Not only is price now trading from a daily Quasimodo resistance, but weekly action is also seen rebounding from a weekly Quasimodo resistance line coming in at 1331.0. With little difference being seen to the overall structure of this market, we’ll continue to focus on the following levels today:
- The current H4 resistance at 1339.9 (green circle). Granted, there is very little converging H4 structure to support this resistance, but given its position on the higher timeframe scale (see above) a short from here (with lower timeframe confirmation) is a high-probability sell in our book. The first take-profit target from this angle would be the H4 support at 1310.3, followed closely by the top-side of weekly demand at 1307.4 (the next downside target on that timeframe).
- We also like the look of the H4 supply area at 1359.6-1354.4. Not only did this zone stop Friday’s safe-haven rally, but it also converges beautifully with the upper daily Quasimodo resistance line at 1354.6! We would recommend waiting for lower timeframe confirmation here since price is likely to fake through the H4 supply to a nearby H4 resistance at 1361.7.
For those interested in confirming the above said levels, please see the top of this report.
Levels to watch/live orders:
- Buys: Flat (Stop loss: N/A).
- Sells: 1339.9 region [Tentative – confirmation required] (Stop loss: dependent on where one confirms this area). 1359.6-1354.4 [Tentative – confirmation required] (Stop loss: dependent on where one confirms this area).


