
EUR/USD:
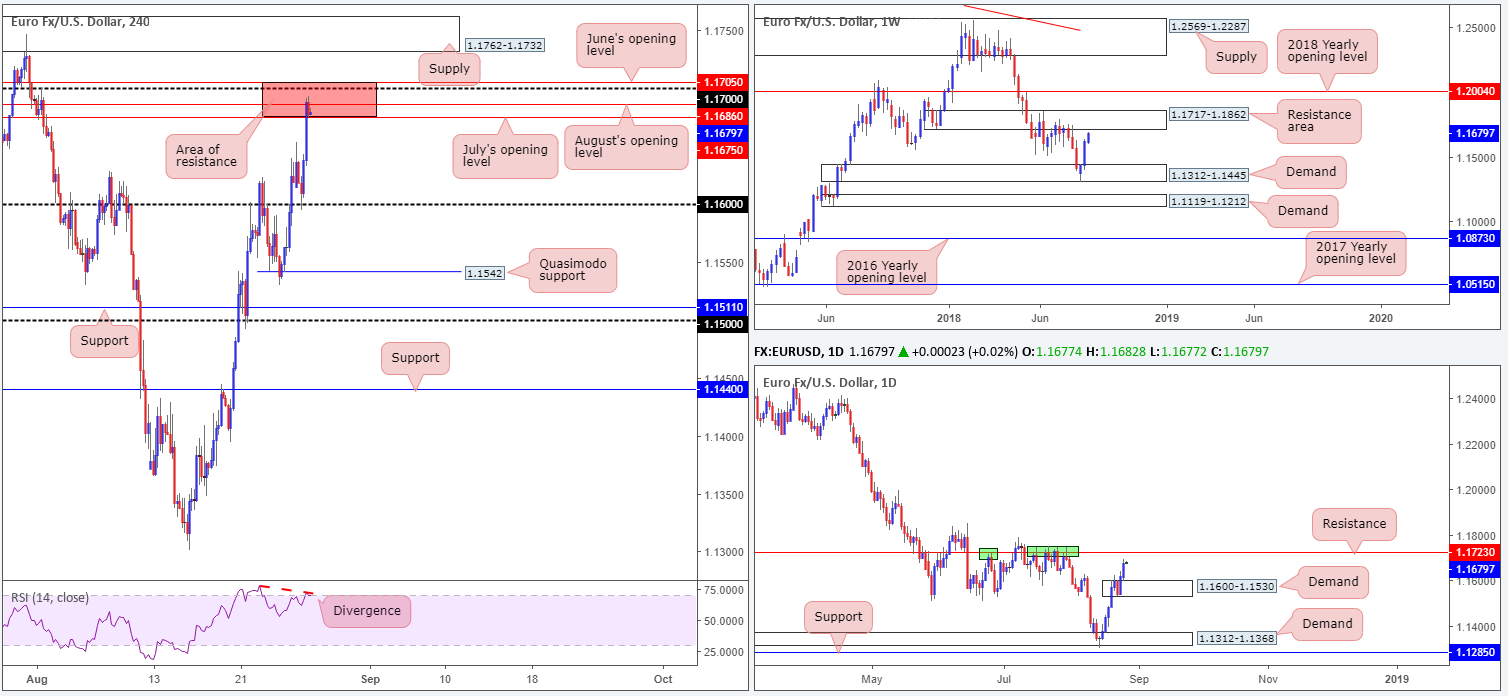
Risk appetite engulfed the markets during Monday’s sessions, forcing the DXY beneath the 95.00 mark. The shared currency, as you can see, established firm support off the 1.16 handle on the H4 timeframe, underpinned by a strong German IFO survey. This led to the candles arriving at a strong area of H4 (red) resistance at 1.1705/1.1675 (comprised of June’s opening level at 1.1705, 1.17 handle, August’s opening level at 1.1686 and July’s opening level at 1.1675).
The story on the bigger picture, however, shows both weekly and daily action approaching significant areas of resistance plotted just above the current H4 resistance area. Weekly price is trading within a stone’s throw away from a resistance area planted at 1.1717-1.1862, while daily flow is seen nearing resistance at 1.1723.
Areas of consideration:
Although the red area of H4 resistance houses a number of resistances, trading short from here is considered chancy given higher-timeframe direction.
The safer, more conservative, area for shorts, therefore, may be the H4 supply zone printed at 1.1762-1.1732, given it is located within the walls of the weekly resistance area and positioned only 10 pips above the current daily resistance level. Stops can be sited above the upper edge of the H4 supply, with traders then likely looking for price to push below 1.17 in order to reduce risk to breakeven and take partial profits off the table.
Today’s data points: US CB consumer confidence.
GBP/USD:
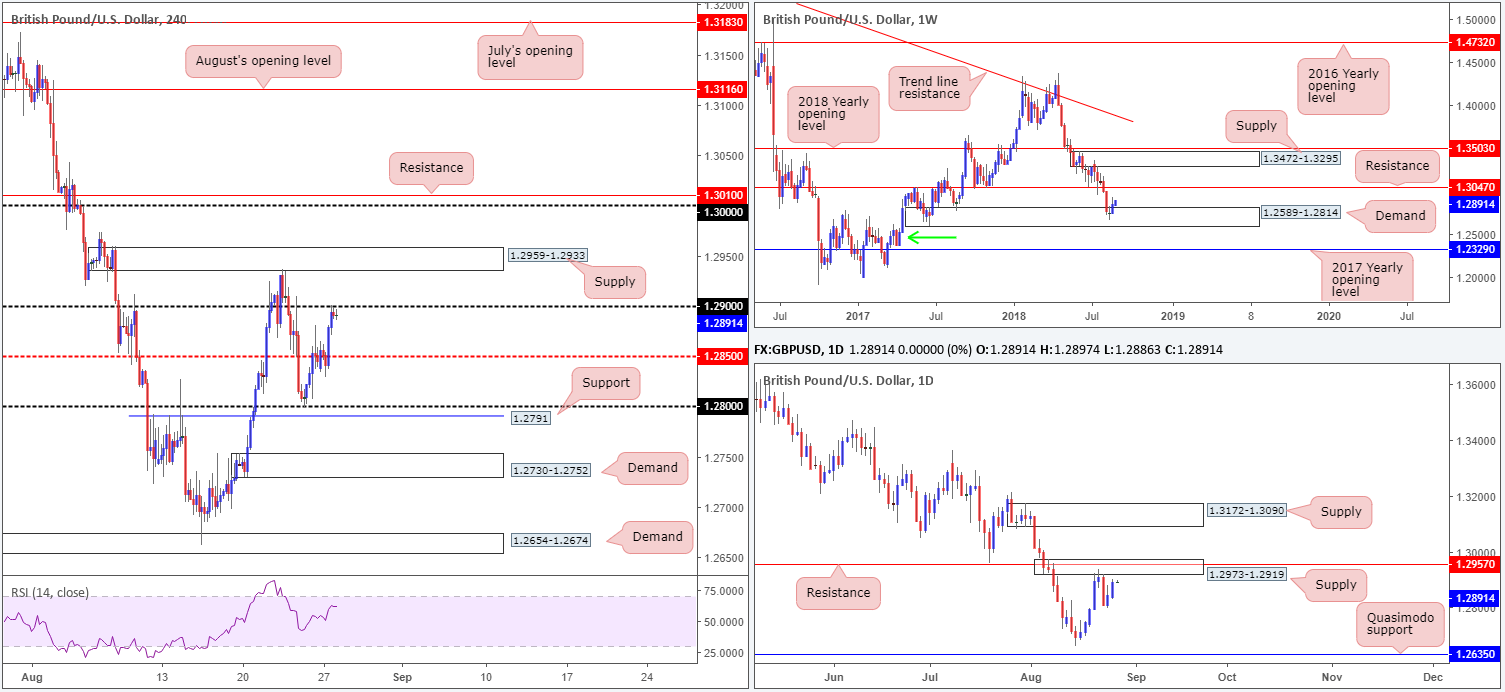
Sterling advanced higher on Monday amid broad-based USD selling, eventually crossing swords with the 1.29 handle seen on the H4 timeframe. Other than the psychological level itself, not a whole lot of additional resistance is seen around this area, which could lead to the market searching for higher levels today. The next port of call beyond 1.29 can be seen at 1.2959-1.2933: a strong supply zone which held price lower on August 22.
The aforementioned supply zone is considered significant from a technician’s perspective we believe, given it is encased within a larger supply area seen on the daily timeframe at 1.2973-1.2919. For that reason, it may be of interest to some traders this morning. Longer term on the weekly timeframe, nevertheless, there’s a chance price could stretch higher than the two noted supply barriers, as weekly price shows room to push as far north as resistance at 1.3047.
Areas of consideration:
Selling from 1.29 has very little to offer in terms of technical resistance, as far as we can see.
Shorts from the H4 supply mentioned above at 1.2959-1.2933 may be an option, as we know it is associated with a daily supply at 1.2973-1.2919. Stops can be positioned around the top edge of the H4 zone, with the first ‘area of concern’ seen around 1.29.
Today’s data points: US CB consumer confidence.
AUD/USD:
The commodity currency benefitted from a waning US dollar and strong upside momentum seen in US equities during the course of Monday’s sessions.
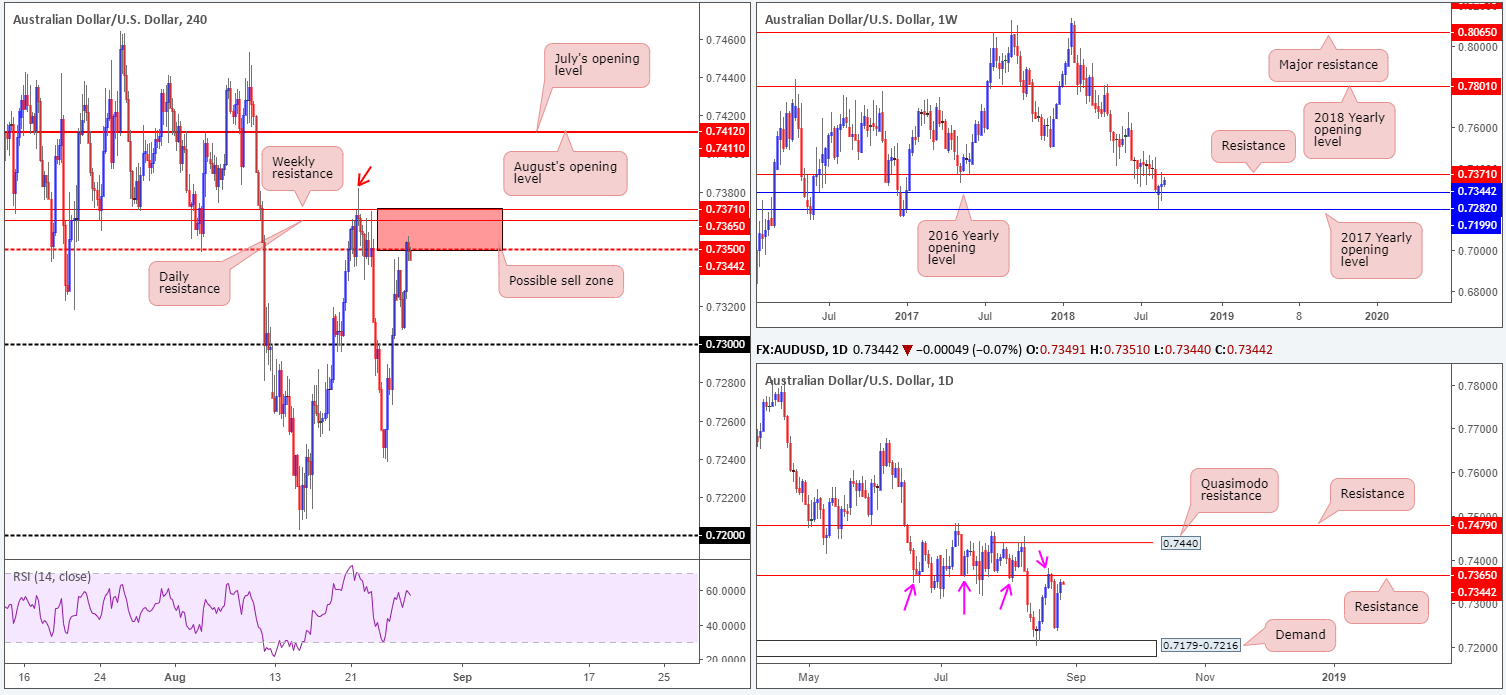
Weekly price action is seen poised to challenge weekly resistance at 0.7371, following last week’s clear-cut indecision candle. This base, as can be seen on the H4 chart, is positioned directly above the mid-level resistance at 0.7350, which is being tested, as we write. Supporting the weekly level is a daily resistance hurdle seen at 0.7365. Note this barrier acted firmly as support not too long ago and also held ground as resistance on Monday last week (pink arrows).
Areas of consideration:
The red H4 zone seen on the H4 timeframe at 0.7371/0.7350 (comprised of the noted weekly and daily resistance levels and the H4 mid-level resistance) is certainly somewhere active sellers likely have their eye on this morning.
Technically speaking, though, waiting for price to touch gloves with the daily resistance level at 0.7365 before pressing the sell button may be the better path to take. Not only will this offer traders more of a favorable risk/reward, it’ll also mean you trade from key higher-timeframe resistance.
Aggressive traders may opt to go in full throttle at market from 0.7365, with stop-loss orders positioned above 0.7381 (August 21 high), whereas conservative traders will likely look for additional H4 candle confirmation before pulling the trigger, and place stops according to those candlestick signals – think bearish pin-bar formations here etc.
Today’s data points: US CB consumer confidence.
USD/JPY:
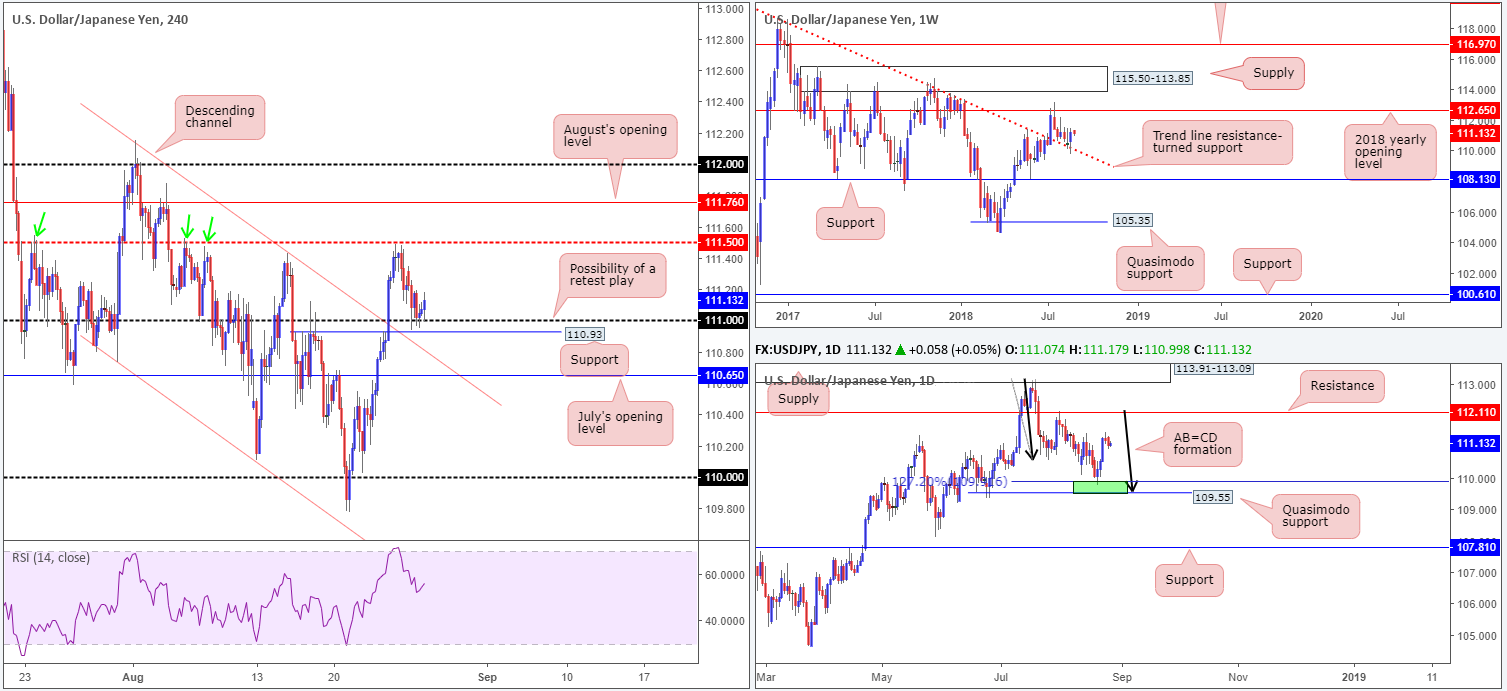
For those who read Monday’s report you may recall the team highlighting a possible retest play off the 111 handle on the H4 timeframe. The reasons behind selecting this level was due to a number of converging structures:
- 111 is shadowed by a minor H4 support at 110.93 and a nearby H4 channel resistance-turned support (taken from the high 112.15).
- Weekly movement, as you can see, retested a trend line resistance-turned support (taken from the high 123.57) last week in the form of a strong bullish candle. Having seen this line hold firm as resistance on a number of occasions in the past, it’s likely to remain a defensive barrier going forward. Further buying from current price has the 2018 yearly opening level at 112.65 to target.
- As can be seen on the daily timeframe, the next obvious upside target on this scale does not come into view until resistance at 112.11.
Areas of consideration:
In regard to entry off of 111, aggressive traders will likely enter at market, placing stops 10-15 pips lower. Well done those traders. So far the level has worked in favor.
As of yet, conservative traders are probably still waiting for additional candlestick confirmation to be seen. A H4 (or an even lower timeframe if you prefer) bullish candlestick formation printed off this number is likely sufficient enough to confirm buyer intent (stop-loss orders should be positioned below the extreme of the confirming candle).
Upside targets from 111 fall in at 111.50, August’s opening level at 111.76, the 112 handle, followed closely by daily resistance mentioned above at 112.11.
Today’s data points: US CB consumer confidence.
USD/CAD:
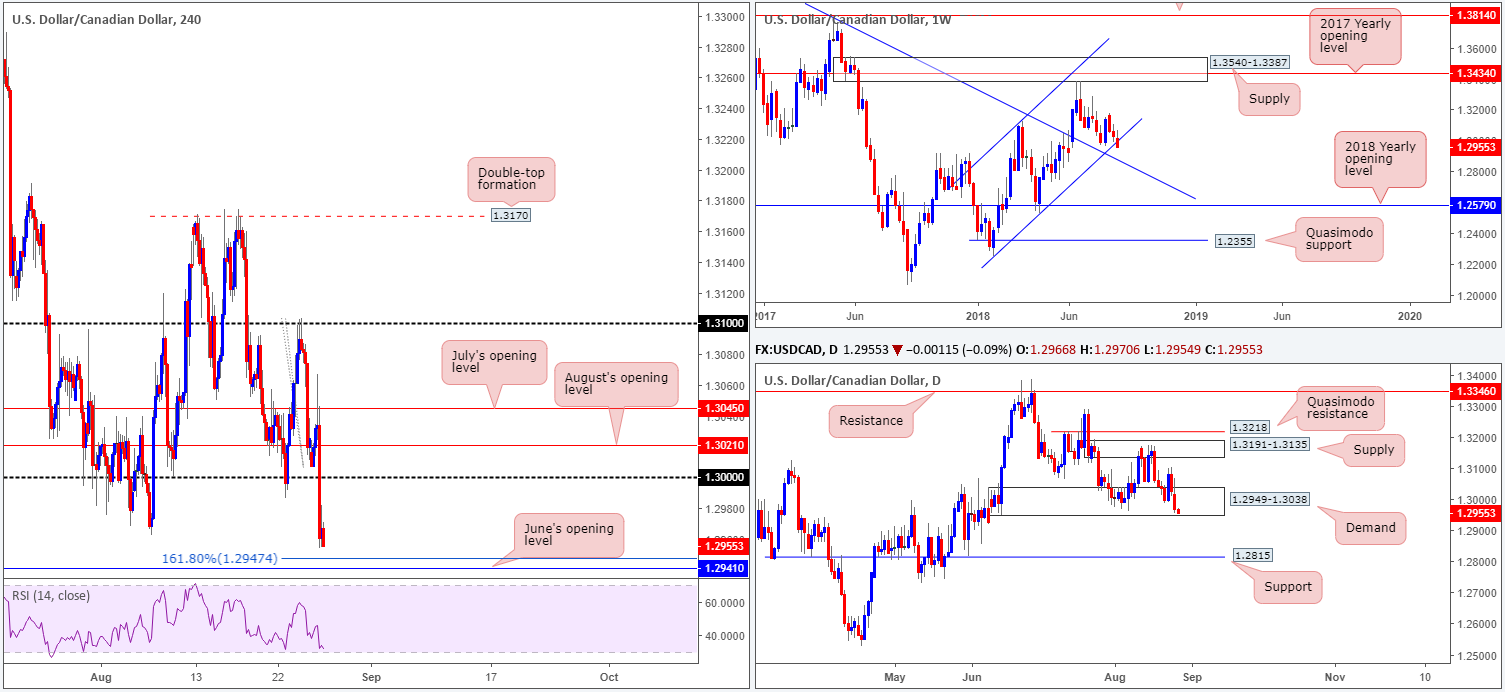
In recent sessions, the H4 candles faded a bullish spike to an intraday high of 1.3067 and aggressively took out the key 1.30 psychological mark. Against the backdrop of persistent USD selling, the pair met additional selling pressure after US and Mexico reached a bilateral trade deal, which President Trump said would replace NAFTA. H4 action, as you can see, is currently facing possible support from a 161.8% Fib ext. point at 1.2947 (taken from the high 1.3103) and June’s opening level at 1.2941. Further adding to this, traders may have noticed the RSI indicator approaching oversold territory.
Weekly movement, on the other hand, recently crossed below channel support (extended from the low 1.2247). This is the first time this year price has traded outside of this level. The next base of support on this scale can be seen in the form of a nearby trend line resistance-turned support (etched from the high 1.4689). The story on the daily timeframe places the unit around the lower limits of a demand base located at 1.2949-1.3038. A break of this area has support at 1.2815 in view.
Areas of consideration:
With weekly price suggesting further selling, and daily price yet to break out of demand, longer term this is not an easy market to trade right now.
Intraday, however, could see the H4 candles touch gloves with June’s opening level seen at 1.2941 today. This would mean a mild break of the current daily demand’s lower edge. A bounce from 1.2941, given it is closely associated with the aforementioned 161.8% H4 Fib ext. point, is possible. How much of a bounce, though, is difficult to judge, having observed recent USD weakness.
On the whole, there is not really much to hang our hat on in terms of high-probability trading setups at the moment, as far as we can see.
Today’s data points: US CB consumer confidence.
USD/CHF:
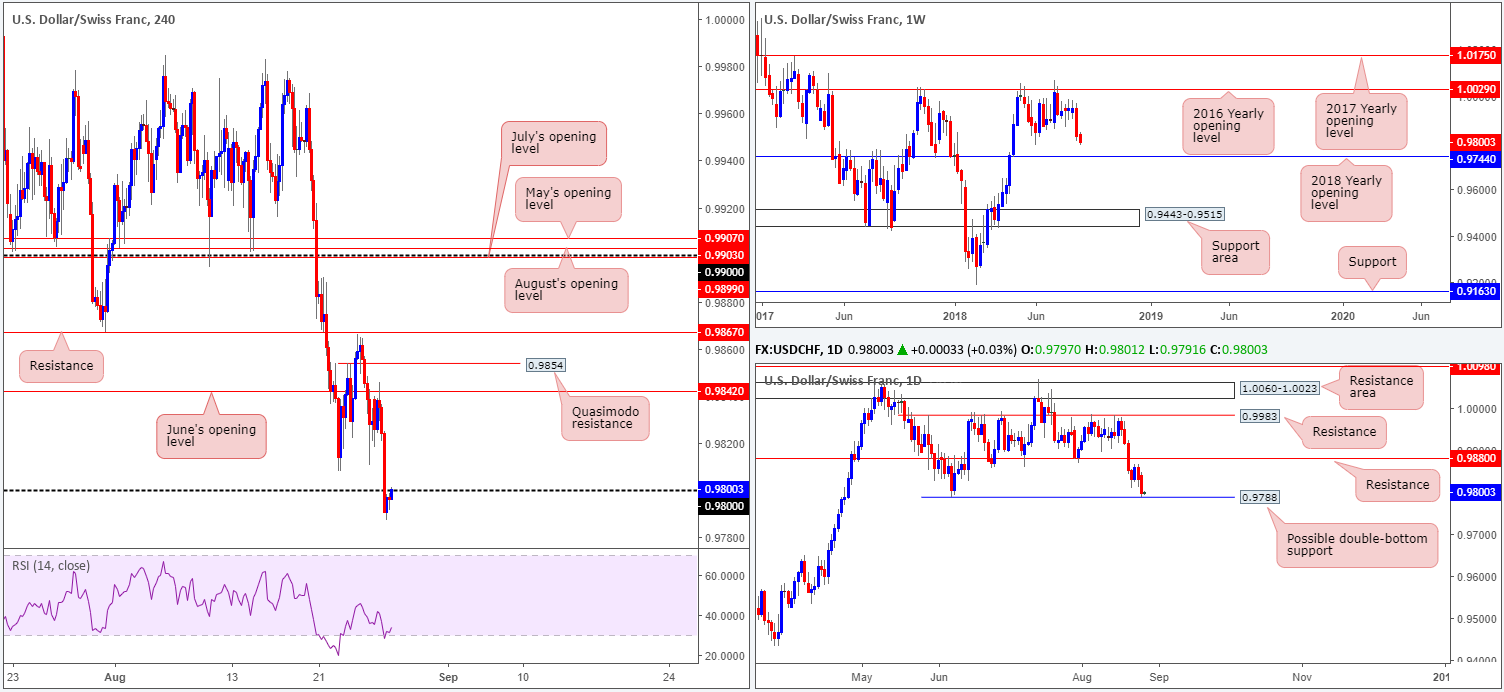
For folks who read Monday’s report you may recall the team highlighting the underside of June’s opening level at 0.9842 on the H4 timeframe as a possible sell. The main reasons behind underlining this level came from the higher timeframes:
- Weekly timeframe – considerable selling was observed on the USD/CHF over the course of last week’s sessions, forming a near-full-bodied bearish candle. The next downside support to keep eyeballs on this week fall in around the 2018 yearly opening level at 0.9744.
- Daily timeframe – lack of enthusiasm off Quasimodo support at 0.9826 (not seen on the screen now).
Well done to any of our readers who managed to jump aboard this move!
Moving forward, the H4 candles are seen trading sub 0.98, now retesting the underside of this number as resistance. Given the current daily Quasimodo support was engulfed, daily action is now seen challenging the June 07 lows at 0.9788, with the possibility of forming a double-bottom support.
Areas of consideration:
The idea selling the underside of 0.98 based on weekly price displaying room to probe lower is not a setup that echoes high probability, in our humble view. The reason being is simple: we’re coming off obvious lows at 0.9788 on the daily timeframe. This, technically speaking, has the ability to lift price action towards at least daily resistance at 0.9880.
On account of the above, the best position, according to our reading, is flat. Sometimes this is the best move a trader can make!
Today’s data points: US CB consumer confidence.
Dow Jones Industrial Average:
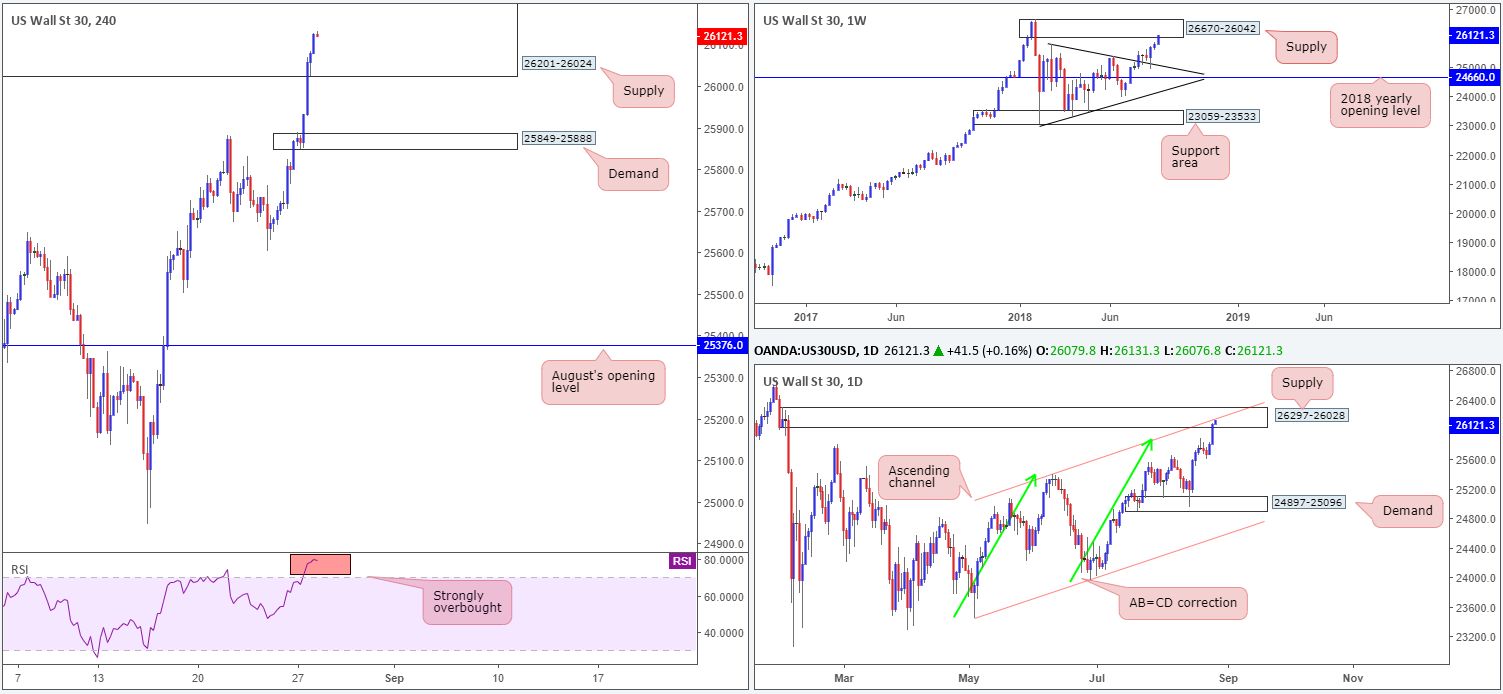
US equities extended recent gains on Monday amid news the US and Mexico reached a bilateral deal that will replace NAFTA. Strong buying, as you can see, has positioned the H4 candles deep within supply at 26201-26024, along with the RSI indicator displaying strong overbought trading conditions.
In addition to the current H4 supply, however, weekly and daily action also exhibit strong supply in play at the moment. Weekly price recently engaged with the lower edge of a supply at 26670-26042, following a strong retest off a trend line resistance-turned support (etched from the high 25807) the week prior. In terms of the daily supply seen at 26297-26028, not only does this zone intersect with a daily channel resistance (taken from the high 25399), it is also glued to the underside of the aforesaid weekly supply area.
Areas of consideration:
In light of the strong emphasis on supply from each timeframe, a pullback, or bout of profit taking, may be on the cards today/this week.
Should traders initiate short positions in this market (traders are urged to wait for H4 candle confirmation in the shape of a full or near-full-bodied bear candle before pulling the trigger, as this shows seller intent [stops can be positioned beyond the rejection candle’s wick or beyond the H4 supply area]), the first area of concern is likely to reside around the H4 demand area seen at 25849-25888.
Today’s data points: US CB consumer confidence.
XAU/USD (Gold)
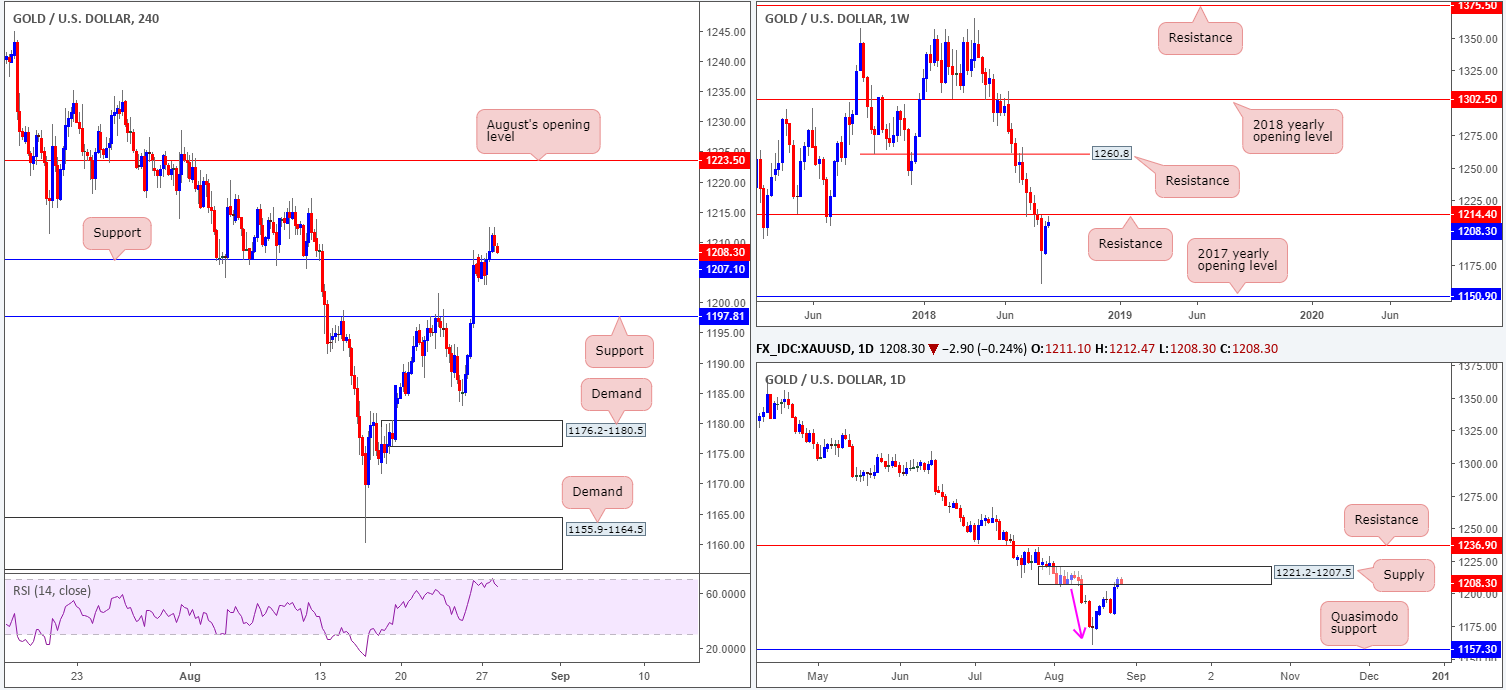
Kicking off with a look at the weekly timeframe, we can see price action recently came within striking distance of resistance plotted at 1214.4 – a level that held strongly as support on May/July of 2017. In terms of daily structure, supply at 1221.2-1207.5 was brought into the mix on Friday. Features worth mentioning here is the strong base comprised of a number of daily candles, robust downside momentum produced from the zone (pink arrow) and the fact it houses the current weekly resistance level on the weekly timeframe. In addition to this, extra weight is credited to this area given it was effectively the obvious decision point to print 2018 yearly lows of 1160.3.
Having seen the USD extend its downside presence on Monday, the price of gold capitalized on this movement, breaking above H4 resistance at 1207.1 (now acting support). Note the H4 RSI indicator is seen touching gloves with its overbought value.
Areas of consideration:
Although the market continues to emphasize a bearish USD tone at the moment, bullion’s higher-timeframe technical picture is strong. Not only is there a weekly resistance in view at 1214.4, there’s also a robust daily supply in play at 1221.2-1207.5. Therefore, attempting to play the retest off 1207.1 as support is precarious. The pressure from higher-timeframe selling may just be too much for this barrier!
Assuming our read is correct, H4 price will likely look to close back below 1207.1. Should this occur, and is followed up with a retest as resistance in the shape of a full or near-full-bodied bearish candle, shorts could be the order of the day, targeting H4 support at 1197.8 as the initial port of call.
The use of the site is agreement that the site is for informational and educational purposes only and does not constitute advice in any form in the furtherance of any trade or trading decisions.
The accuracy, completeness and timeliness of the information contained on this site cannot be guaranteed. IC Markets does not warranty, guarantee or make any representations, or assume any liability with regard to financial results based on the use of the information in the site.
News, views, opinions, recommendations and other information obtained from sources outside of www.icmarkets.com.au, used in this site are believed to be reliable, but we cannot guarantee their accuracy or completeness. All such information is subject to change at any time without notice. IC Markets assumes no responsibility for the content of any linked site. The fact that such links may exist does not indicate approval or endorsement of any material contained on any linked site.
IC Markets is not liable for any harm caused by the transmission, through accessing the services or information on this site, of a computer virus, or other computer code or programming device that might be used to access, delete, damage, disable, disrupt or otherwise impede in any manner, the operation of the site or of any user’s software, hardware, data or property.


