
Key risk events today:
Spanish Unemployment Rate; US CB Consumer Confidence.
(Previous analysis as well as outside sources – italics).
EUR/USD:
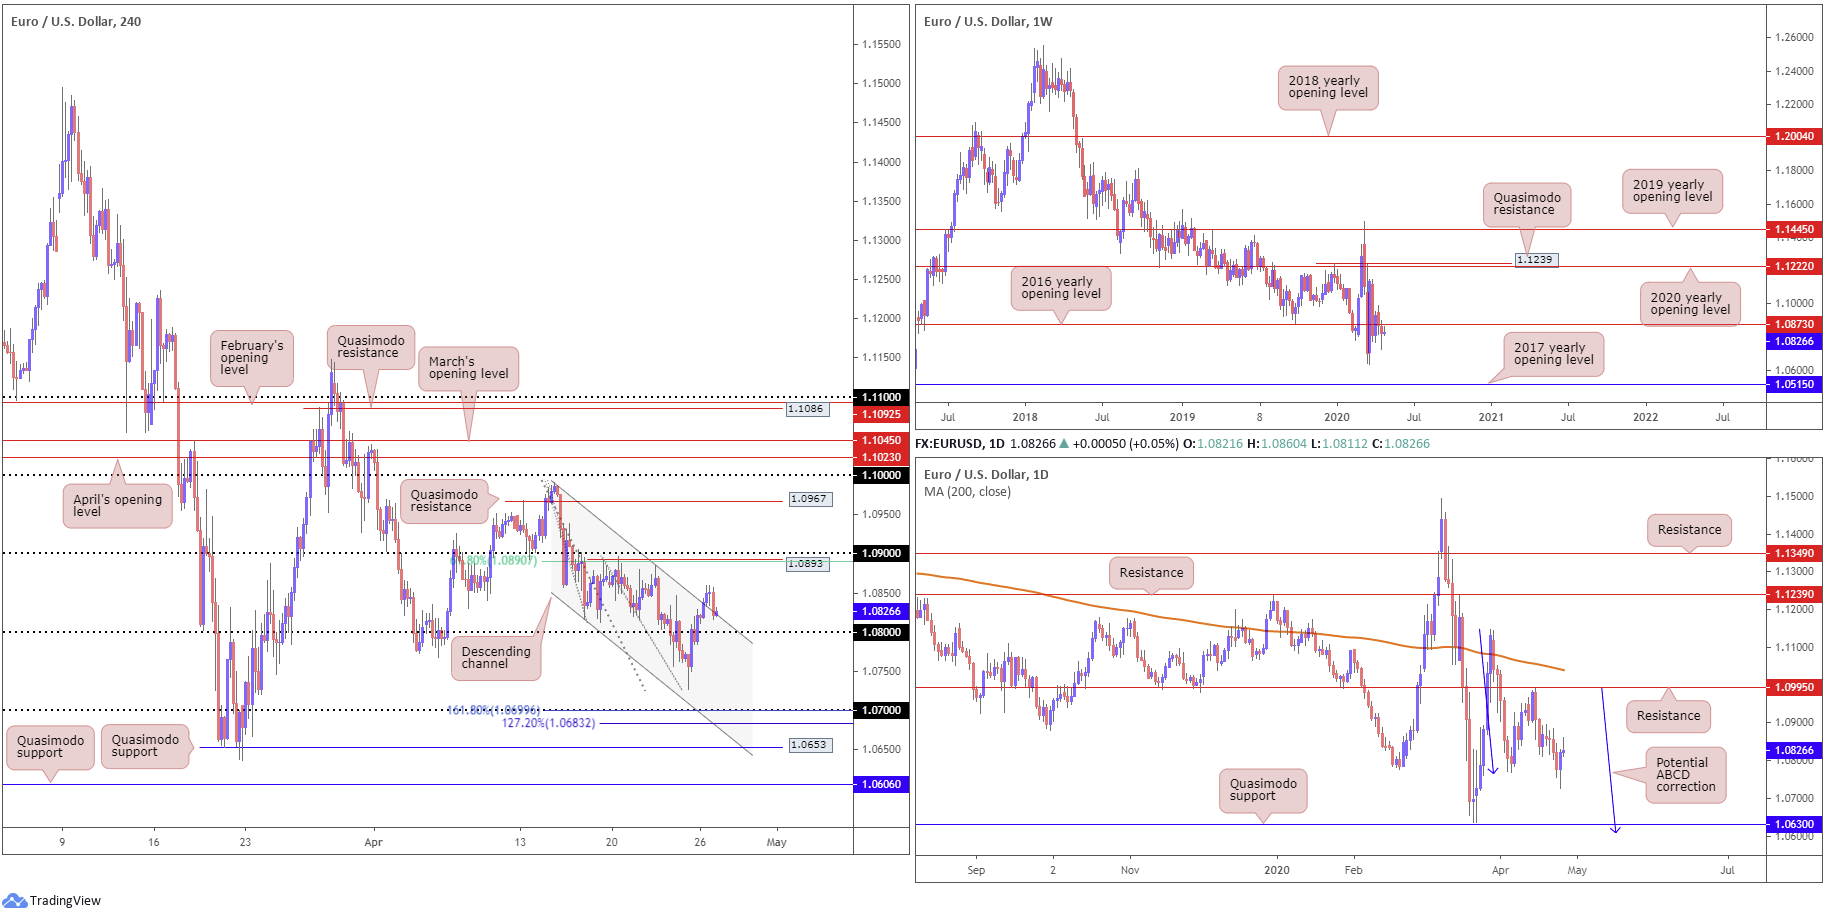
Despite ranging between 1.0860/1.0811, EUR/USD wrapped up Monday mostly unmoved.
The pair marched higher in early European hours, though failed to sustain gains north of 1.0860 heading into US trade, resulting in price retreating to a H4 channel resistance-turned support, taken from the high 1.0990, sited just ahead of 1.08.
From the weekly timeframe, we can see price movement remains subdued south of the 2016 yearly opening level at 1.0873. Poised to retest 1.0873 as resistance this week, multi-year lows at 1.0635 are in view as viable support from here, with follow-through moves shining the spotlight on the 2017 yearly opening level at 1.0515.
The daily timeframe still demonstrates the possibility of further downside, targeting Quasimodo support at 1.0630, closely shadowed by a potential ABCD correction (blue arrows) at 1.0597.
Areas of consideration:
A rebound from H4 channel resistance-turned support/1.08 has a reasonably clear run to approach 1.09, based on the H4 timeframe.
Before reaching 1.09, however, traders are urged to pencil in the possibility of price halting at the 2016 yearly opening level on the weekly timeframe at 1.0873. Therefore, while intraday long opportunities are in the offing off the 1.08ish region, potential bearish themes could also come about between 1.09/1.0873 (note 1.09 comes with a H4 Quasimodo resistance at 1.0893 and a H4 61.8% Fibonacci retracement at 1.0890).
GBP/USD:
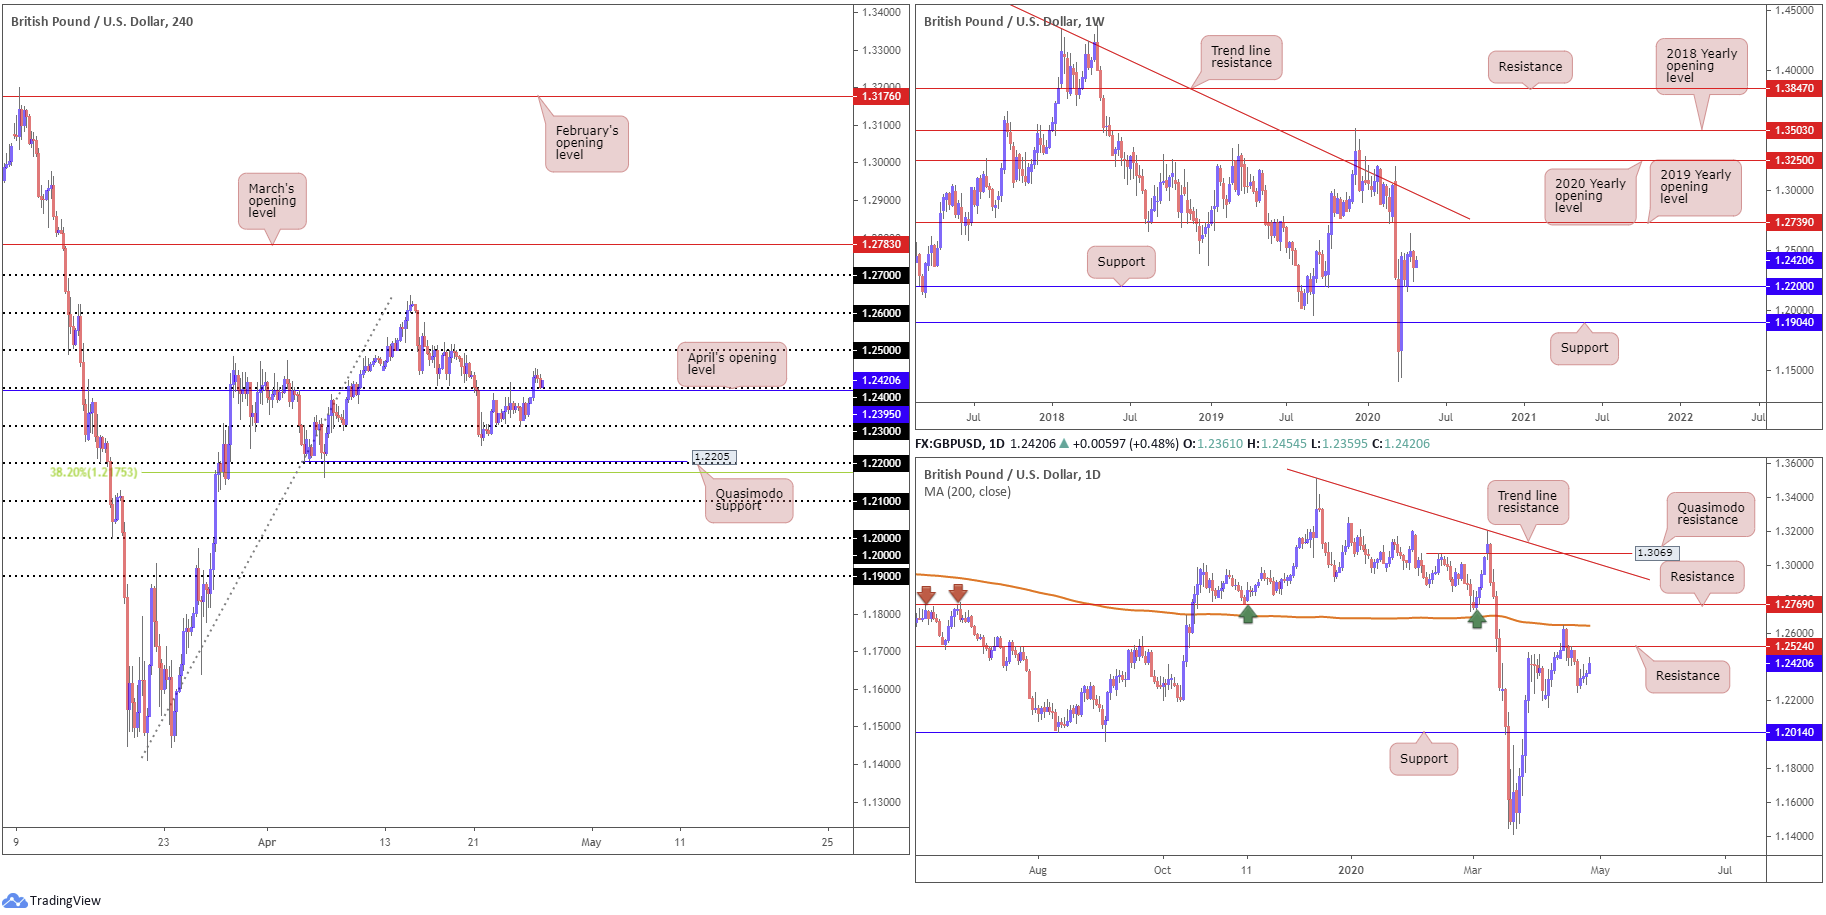
The British pound gleaned early support from UK Prime Minister Boris Johnson returning to Number 10, though lost steam at around 1.2450 vs. the buck. As of current price, H4 activity is retesting 1.24 as support, reinforced closely by April’s opening level at 1.2395. This could be enough to prompt another wave of bidding today, with 1.25 marked as a clear upside target. Failure to hold off 1.24 could result in 1.23 resurfacing.
Technical research based on the weekly timeframe has support plotted at 1.2200. Elbowing through the 1.2647 April 14 high, nevertheless, could land the candles within striking distance of the 2019 yearly opening level at 1.2739, with a break exposing a long-standing trend line resistance, taken from the high 1.5930.
Over on the daily timeframe, the candles appear to be gearing up for a retest at resistance from 1.2524. Interestingly, should this base hold and produce a sizable reaction, we could be in for a head and shoulder’s top formation.
Areas of consideration:
Having noted daily price exhibiting scope to explore higher ground to 1.2524, the H4 retest off 1.24 could have meaning and perhaps draw out an approach towards 1.25. Therefore, should the current H4 candles close as is, this may be enough to draw in buyers, with traders likely tucking protective stop-loss orders beneath 1.24.
A H4 close south of 1.24, on the other hand, may trigger bearish scenarios towards 1.23.
AUD/USD:
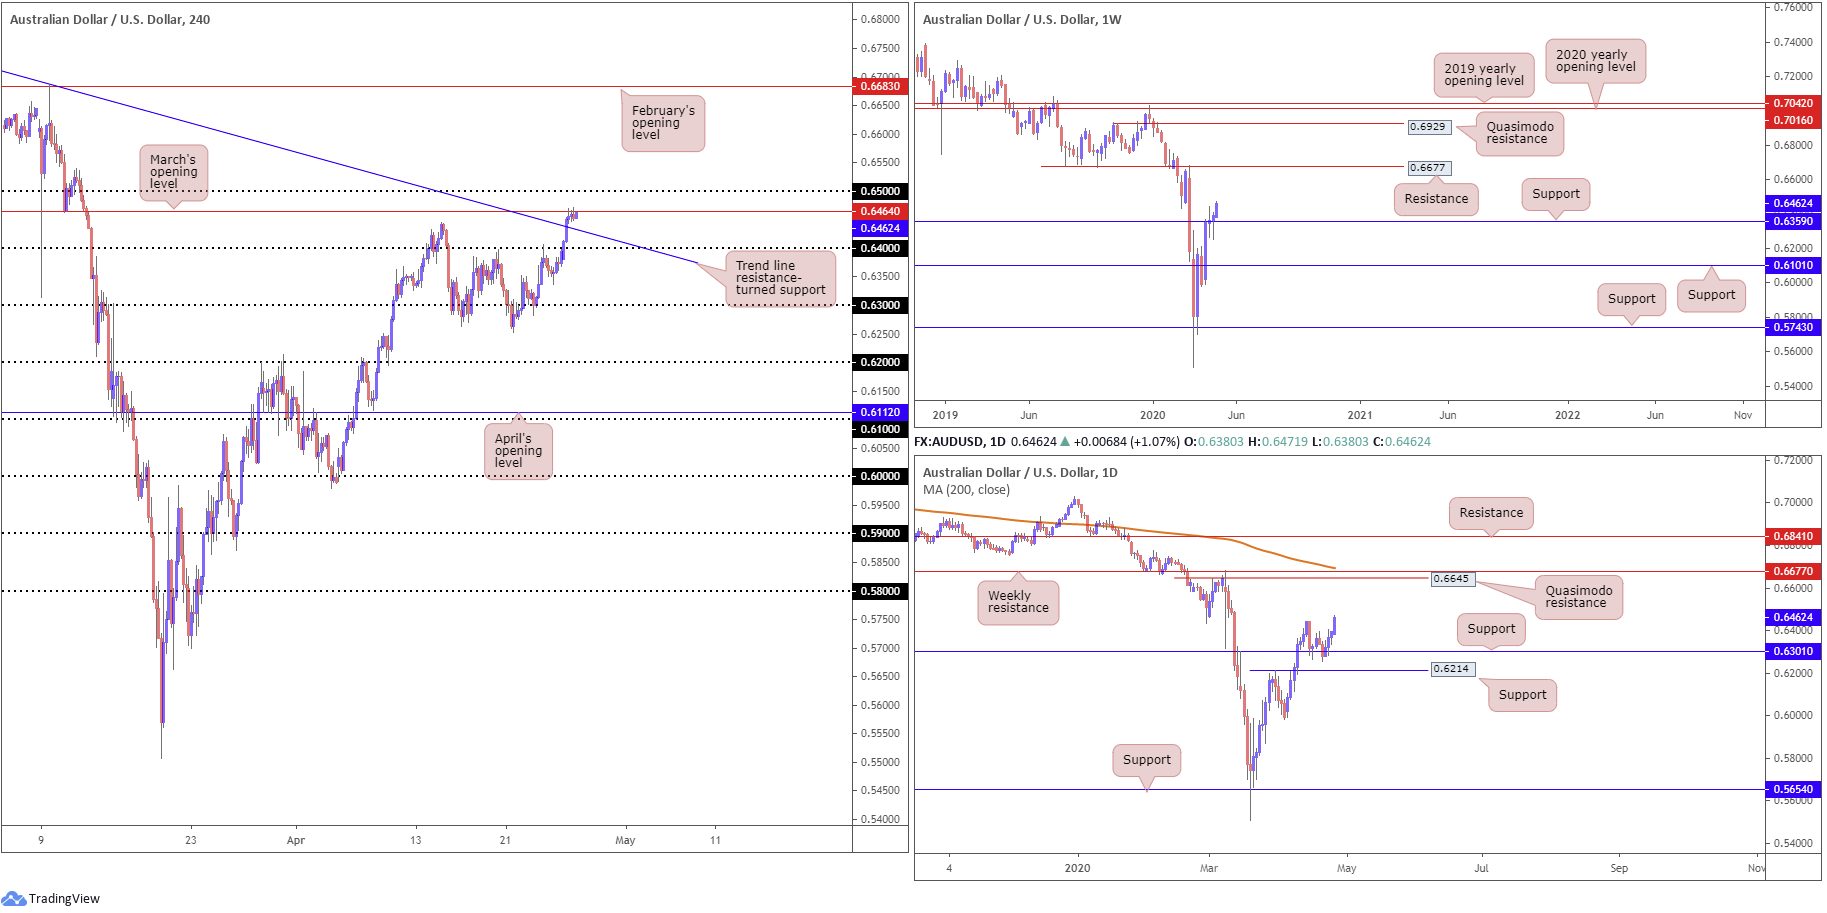
A bid for riskier assets bolstered the Australian dollar Monday, adding more than 60 pips, or 1.00%, against the buck. The move overthrew 0.64 and H4 trend line resistance, extended from the high 0.7025, with price consequently shaking hands with March’s opening level at 0.6464, sited just beneath the 0.65 handle.
There’s clearly interest off March’s opening level at the moment, though this may simply be traders liquidating positions into the close. As such, the recently broken trend line may step in as support today.
Higher on the curve, weekly support is seen at 0.6359, with room to approach resistance based at 0.6677. In conjunction with the weekly timeframe, daily action remains on firm footing north of support at 0.6301, also showing room to navigate higher ground to at least Quasimodo resistance parked at 0.6645, followed by the weekly resistance level mentioned above at 0.6677.
Areas of consideration:
Having identified higher-timeframe support in play, with plenty of room to climb higher, selling from March’s opening level at 0.6464, or even 0.65, may be unsettling for some traders. With that being the case, the better way forward may be to wait for a H4 close above 0.65 to form. This would clear any remaining sellers and potentially shift the spotlight to 0.66 as the next upside target. Some traders could opt to enter on the breakout candle’s close above 0.65; others may wait and see if a retest at 0.65 occurs before pulling the trigger.
USD/JPY:
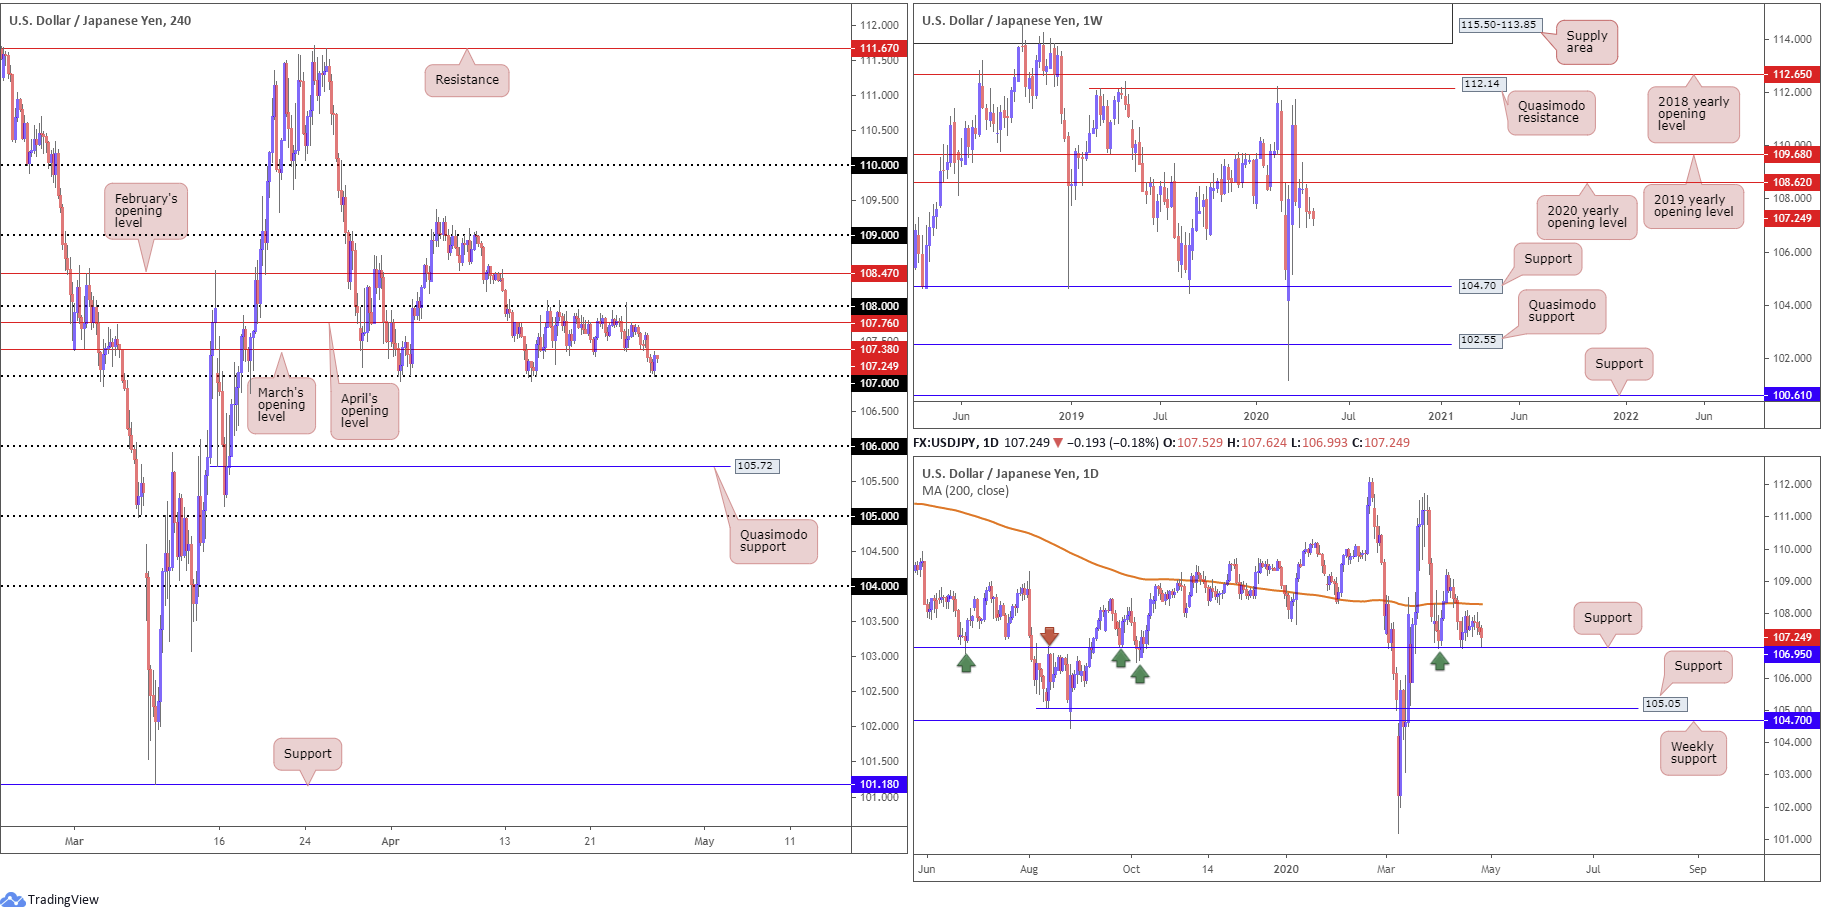
Since mid-April, the H4 candles have been caught within a consolidation between 108/7; in between the walls of the said range, however, we have April and March’s opening levels at 107.76 and 107.38, respectively.
What’s interesting here is 107 aligns closely with daily support at 106.95, therefore the recent rebound from 107 should not really come as a surprise. In terms of the daily timeframe, moves off daily support could lead to the 200-day SMA (orange – 108.29) making an appearance.
With reference to the weekly timeframe, the chart continues to emphasise a bearish tone. Price action recently produced a clear-cut shooting star candlestick configuration off the 2020 yearly opening level at 108.62, with a strong follow-through move to the downside to lows of 106.92 seen thereafter.
Areas of consideration:
The rebound from 107, as you can probably see, formed an outside candle formation, which may appeal to buyers, particularly as we’re coming off reasonably well-grounded support. Those long this market will likely be targeting 1.08.
In the absence of buyers, however, a H4 close beneath 107 will likely see sellers strengthen their grip in the hopes of reaching 106, and quite possibly Quasimodo support at 105.72.
USD/CAD:
Despite the fallout in WTI, Monday observed a somewhat resilient Loony, perhaps trading off risk rather than oil movement.
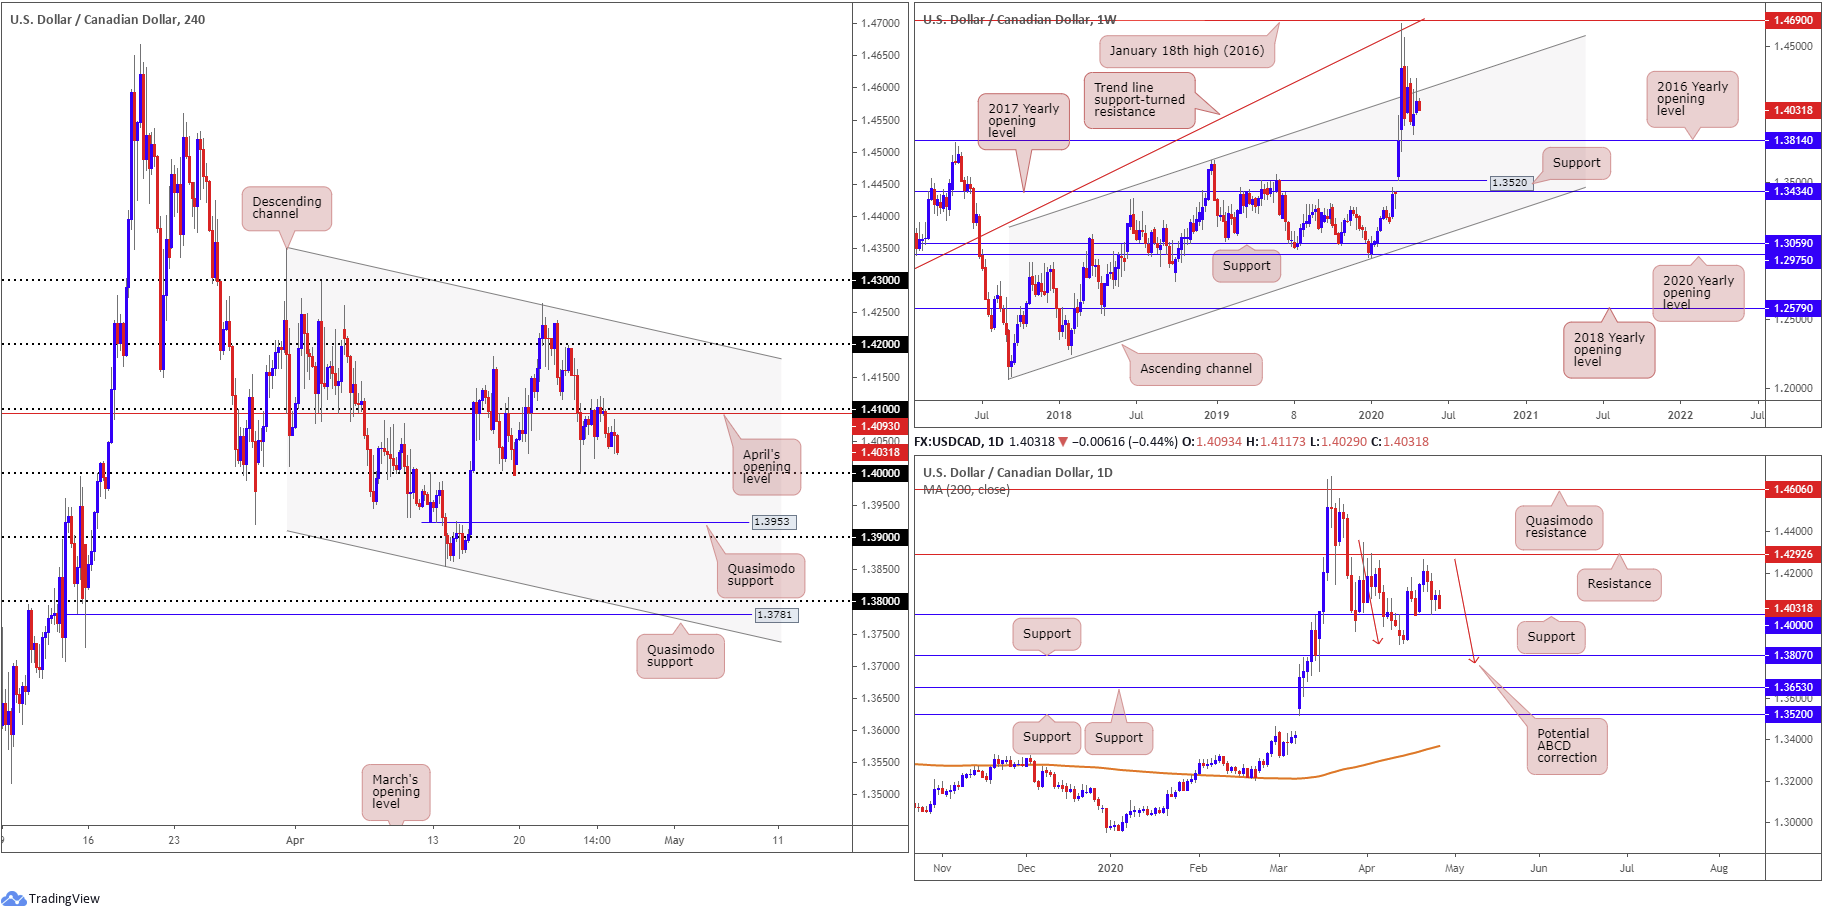
The 1.41 handle and April’s opening level at 1.4093 on the H4 timeframe withstood an early upside attempt yesterday, consequently drawing the H4 candles sub 1.4050 to within touching distance of the key figure 1.40. What’s notable from a technical perspective is the 1.40 handle has contained downside on a number of occasions in recent weeks, and also represents daily support.
Across the page on the weekly timeframe, price recently crossed swords with channel resistance, extended from the high 1.3661. The retest, shaped by way of a shooting star candlestick pattern, could be sufficient to entice moves back to 1.3814, the 2016 yearly opening level.
Areas of consideration:
For those who read Monday’s technical briefing you may recall the following piece (italics):
Weekly price fading channel resistance by means of a bearish candlestick signal may weaken upside attempts above 1.41 this week. The flip side to this, of course, is we are coming off daily support from 1.4000 which may give weekly sellers a run for their money and attempt to conquer 1.41.
Clearly weekly sellers remain in the driving seat at the moment.
1.40 may see buyers attempt to make a show, given the number also signifies daily support. However, with weekly price pointing to lower levels, a break beneath 1.40 is equally likely.
Breaking 1.40 to the downside may be interpreted as a bearish signal, with scope to approach H4 Quasimodo support at 1.3953 as an initial target. Conservative traders, of course, may opt to wait for a retest at 1.40 before committing.
USD/CHF:
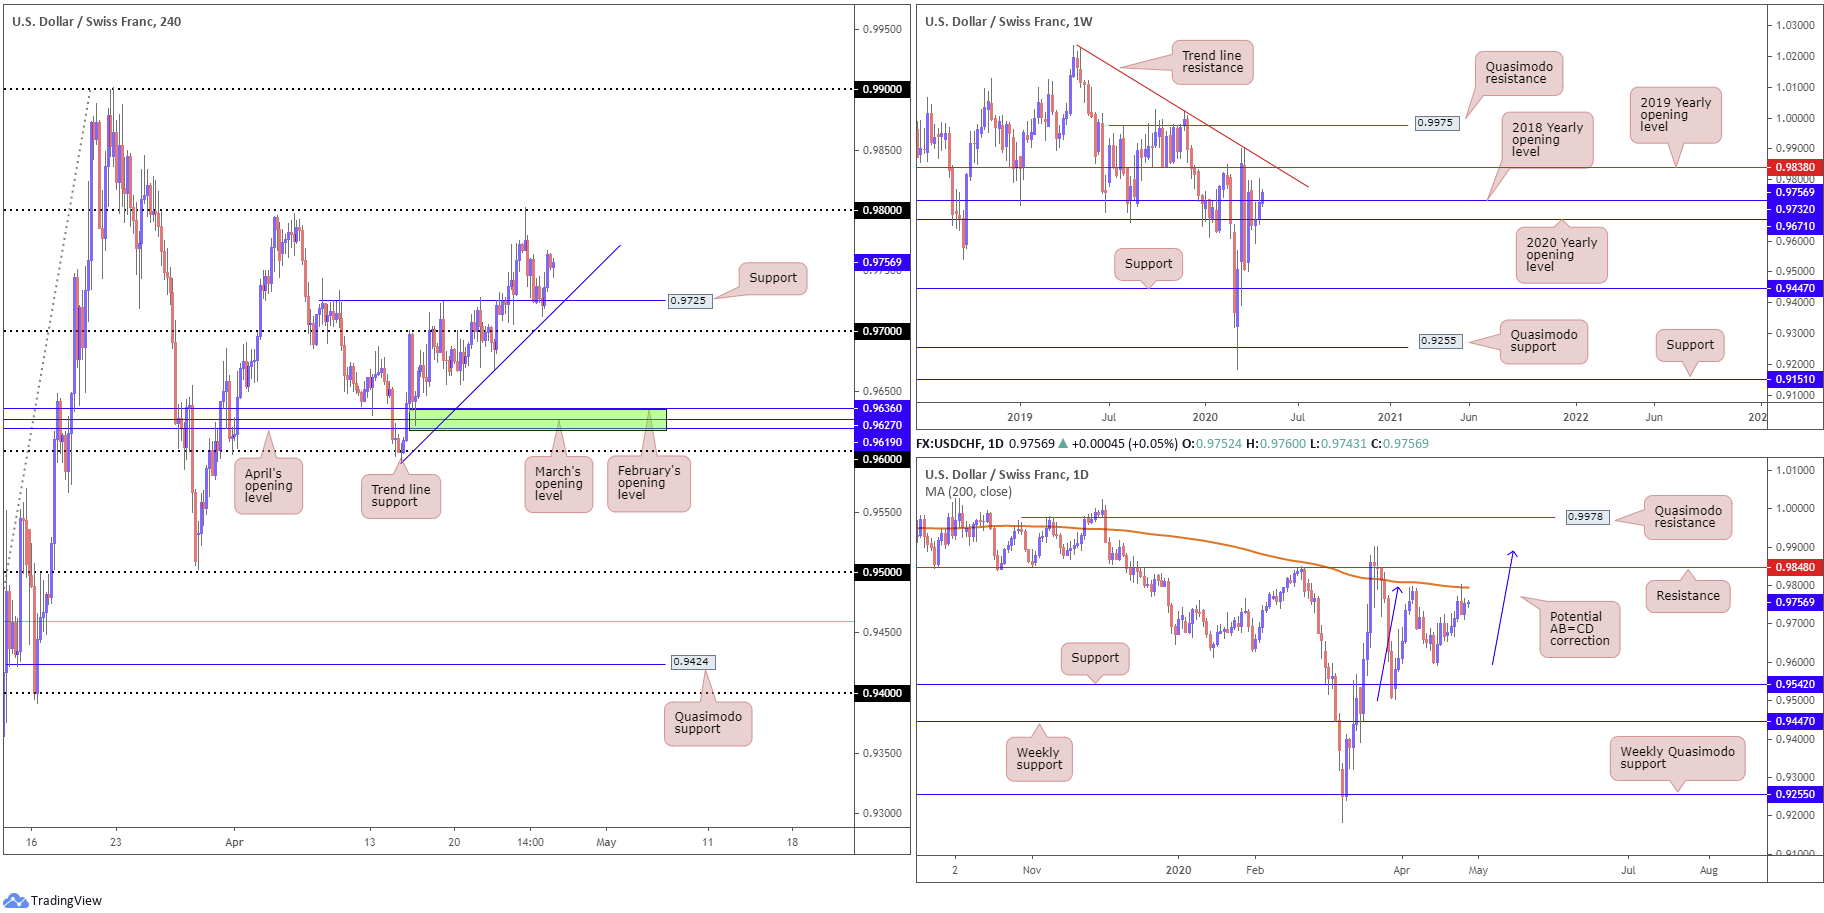
Demand for the safe-haven Swiss Franc diminished Monday amid upbeat risk sentiment. H4 support at 0.9725, closely intersecting with a local trend line support, taken from the low 0.9592, contained downside Monday, lifting USD/CHF to highs of 0.9766 and reclaiming Friday’s losses.
Resistance, in terms of the H4 timeframe, can be seen at the 0.98 handle, with a break of the psychological level potentially making a play for 0.99.
Meanwhile, on the weekly timeframe, current action is attempting to make headway above the 2018 yearly opening level at 0.9732. The move higher has unmasked the 2019 yearly opening level at 0.9838 and trend line resistance, taken from the high 1.0226.
A closer reading of price action on the daily timeframe, however, shows price recently launched itself into the 200-day SMA (orange – 0.9794). Despite the recent rejection, traders are urged to pencil in resistance at 0.9848 and a potential AB=CD correction (blue arrows) at 0.9886 in case of moves higher this week. Lower on the curve, aside from the 0.9592 April 15 low, we have support priced in at 0.9542, situated just ahead of weekly support at 0.9447.
Areas of consideration:
Weekly price attempting to overthrow the 2018 yearly opening level at 0.9732 adds weight to the possibility of further buying off H4 support at 0.9725. Traders may enter at current price, based on this finding. However, some will prefer to wait and see if a retest at 0.9725 plays out in attempt to get in at a better price, improving risk/reward. 0.98 stands as a possible upside target on the H4 timeframe, which converges closely with the 200-day SMA at 0.9794.
Dow Jones Industrial Average:
Global equities kicked off the week in fine form as many countries, including the United States, prepare to lift restrictions imposed on businesses amid coronavirus pandemic. The Dow Jones Industrial Average added 358.51 points, or 1.51%; the S&P 500 gained 41.74 points, or 1.47%, and the tech-heavy Nasdaq 100 concluded higher by 51.05 points, or 0.58%.
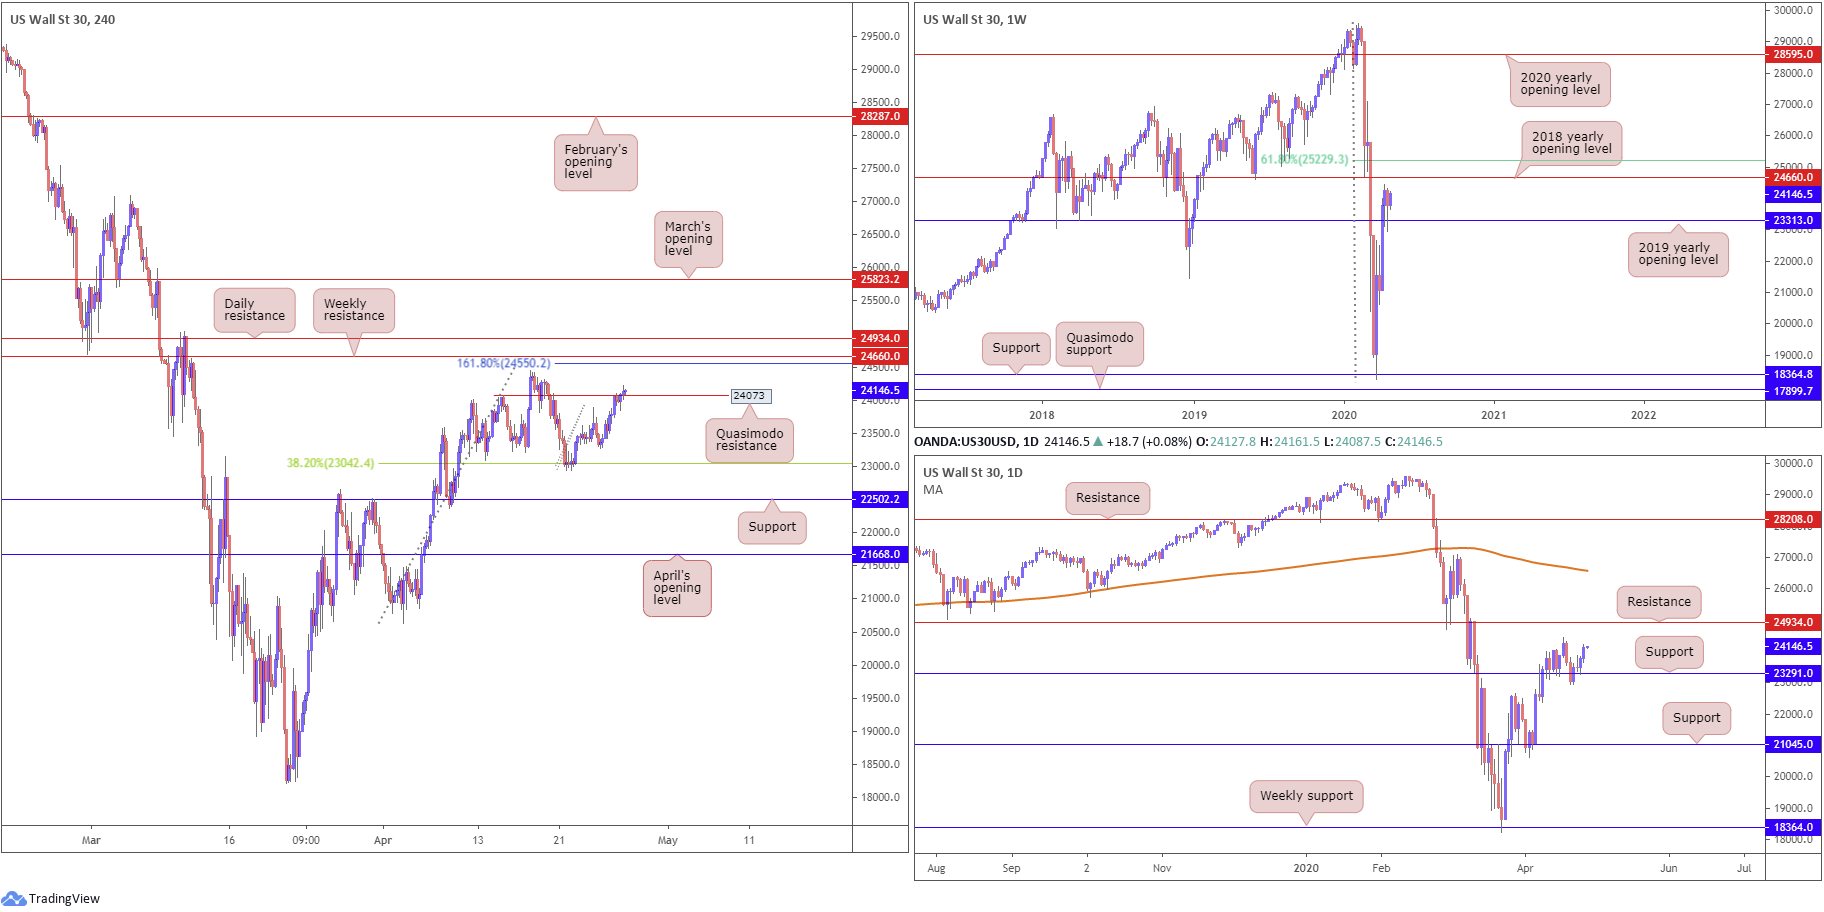
Technically, the weekly timeframe is found rebounding from the 2019 yearly opening level at 23313. Resistance, in the form of the 2018 yearly opening level at 24660, stands out this week, with a break unmasking a 61.8% Fibonacci retracement ratio at 25229. South of 23313, however, reveals limited support until reaching 18364.
Price action on the daily timeframe had support at 23291 nudge its way back into the limelight last week, with yesterday’s movement extending Friday’s recovery. Resistance may emerge off the 24442 April 17 high, with a break uncovering resistance priced in at 24934, while tunnelling through the current support could invite an approach to support at 21045.
H4 Quasimodo resistance at 24073 came under fire in recent trade. A decisive break above this angle exposes a 161.8% Fib ext. level at 24550. Directly above, nonetheless, we also have the 2018 yearly opening level mentioned above on the weekly timeframe at 24660 and daily resistance at 24934.
Areas of consideration:
Traders who read Monday’s technical briefing may recall the following piece (italics):
In the event we pop higher, as the higher timeframes suggest, selling H4 Quasimodo resistance at 24073 could be fragile, with the possibility of a move north materialising. This highlights potential buying opportunities north of 24073, targeting the noted higher-timeframe resistances.
So far, sellers have emphasised a fragile tone around 24073. Given the surrounding landscape (higher-timeframe picture), buyers may look to take things north of 24073 today, at least until reaching the higher-timeframe resistances highlighted above in bold. We have yet to see a retest take shape at 24073, therefore many traders will likely be watching for this to occur today before pulling the trigger.
XAU/USD (GOLD):
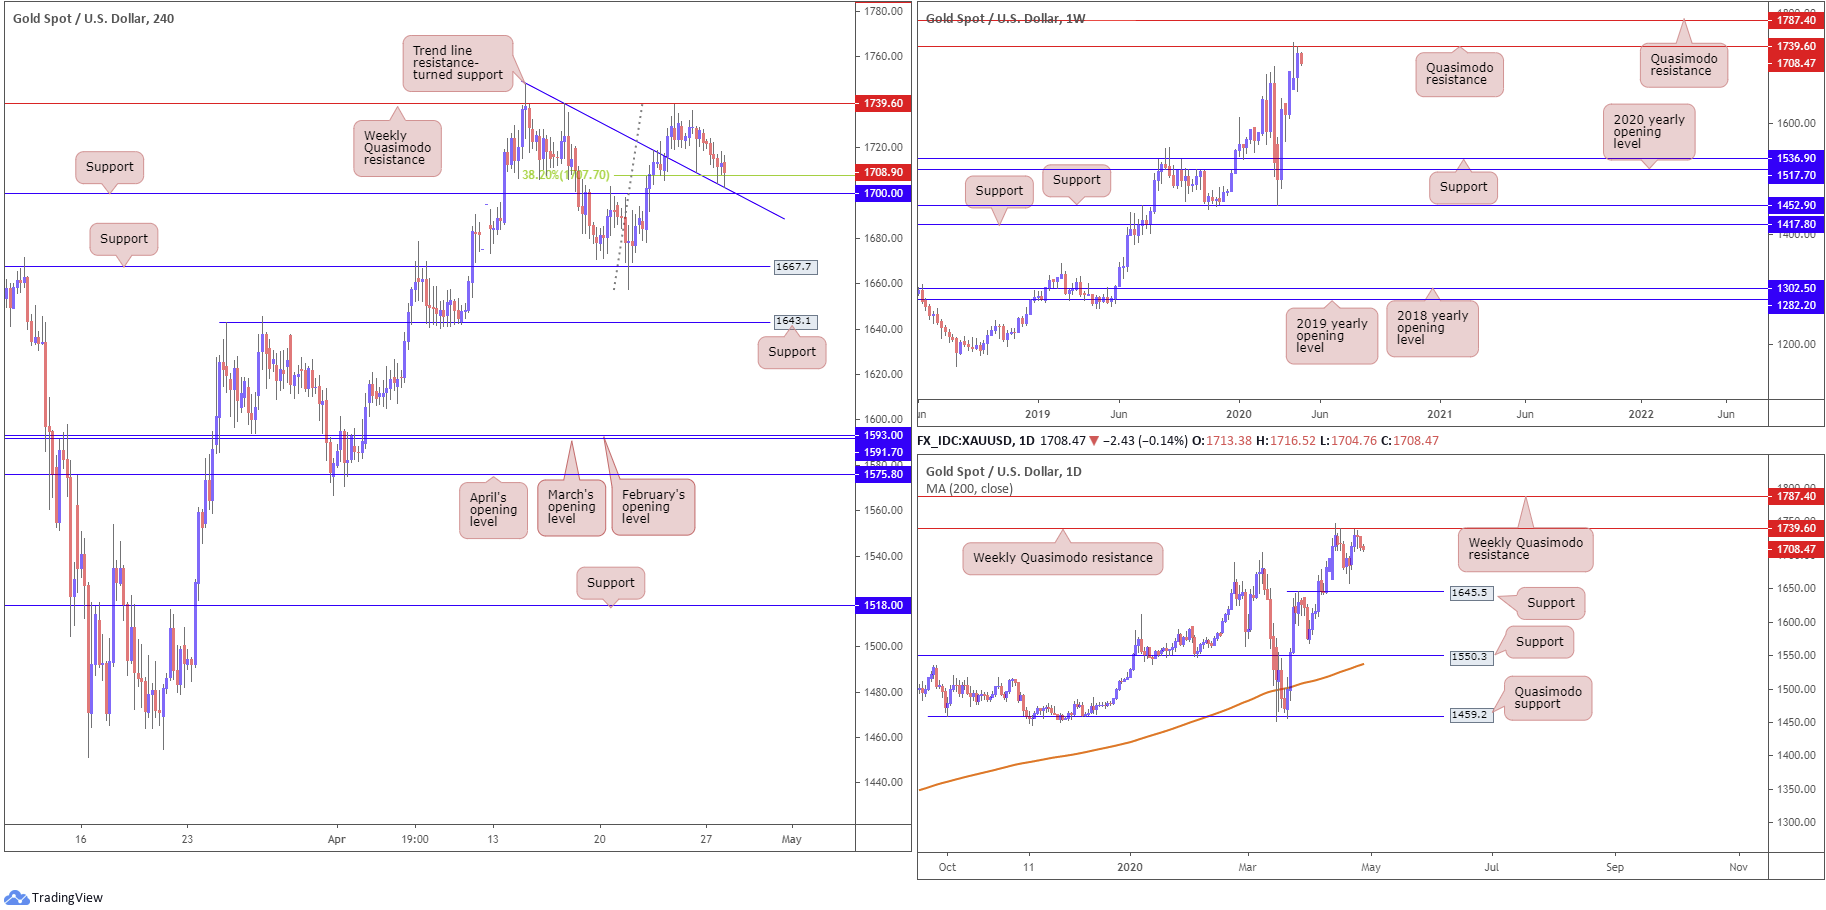
XAU/USD bulls clearly lacked the firepower to push higher Monday, largely due to upbeat market sentiment and weekly Quasimodo resistance at 1739.6.
The pullback has landed the H4 candles at a 38.2% Fibonacci retracement ratio at 1707.7 and a trend line resistance-turned support, extended from the high 1747.7, which happens to be closely positioned nearby support at 1700.0.
From the daily timeframe, we can see that the reaction off the weekly Quasimodo resistance mentioned above at 1739.6 has daily support at 1645.5 to target. Should price conquer the said weekly Quasimodo, however, focus will likely rest on another layer of weekly Quasimodo resistance coming in at 1787.4.
Areas of consideration:
Traders face a tough decision here.
On the one hand, the trend in this market has faced north since December 2015, which puts buyers in the driving seat. On the other hand, though, weekly Quasimodo resistance at 1739.6 is a formidable higher-timeframe base, one that cannot be overlooked.
As such, should you decide to enter long based on the current H4 support structure, you are trading alongside the current trend, though simultaneously buying into weekly resistance. Some traders may simply wait and see if H4 price can print a bullish candlestick signal from 1700.0 before taking action. Although this will not guarantee a winning trade, it will help show bullish intent.
The accuracy, completeness and timeliness of the information contained on this site cannot be guaranteed. IC Markets does not warranty, guarantee or make any representations, or assume any liability regarding financial results based on the use of the information in the site.
News, views, opinions, recommendations and other information obtained from sources outside of www.icmarkets.com.au, used in this site are believed to be reliable, but we cannot guarantee their accuracy or completeness. All such information is subject to change at any time without notice. IC Markets assumes no responsibility for the content of any linked site.
The fact that such links may exist does not indicate approval or endorsement of any material contained on any linked site. IC Markets is not liable for any harm caused by the transmission, through accessing the services or information on this site, of a computer virus, or other computer code or programming device that might be used to access, delete, damage, disable, disrupt or otherwise impede in any manner, the operation of the site or of any user’s software, hardware, data or property.


