
EUR/USD:
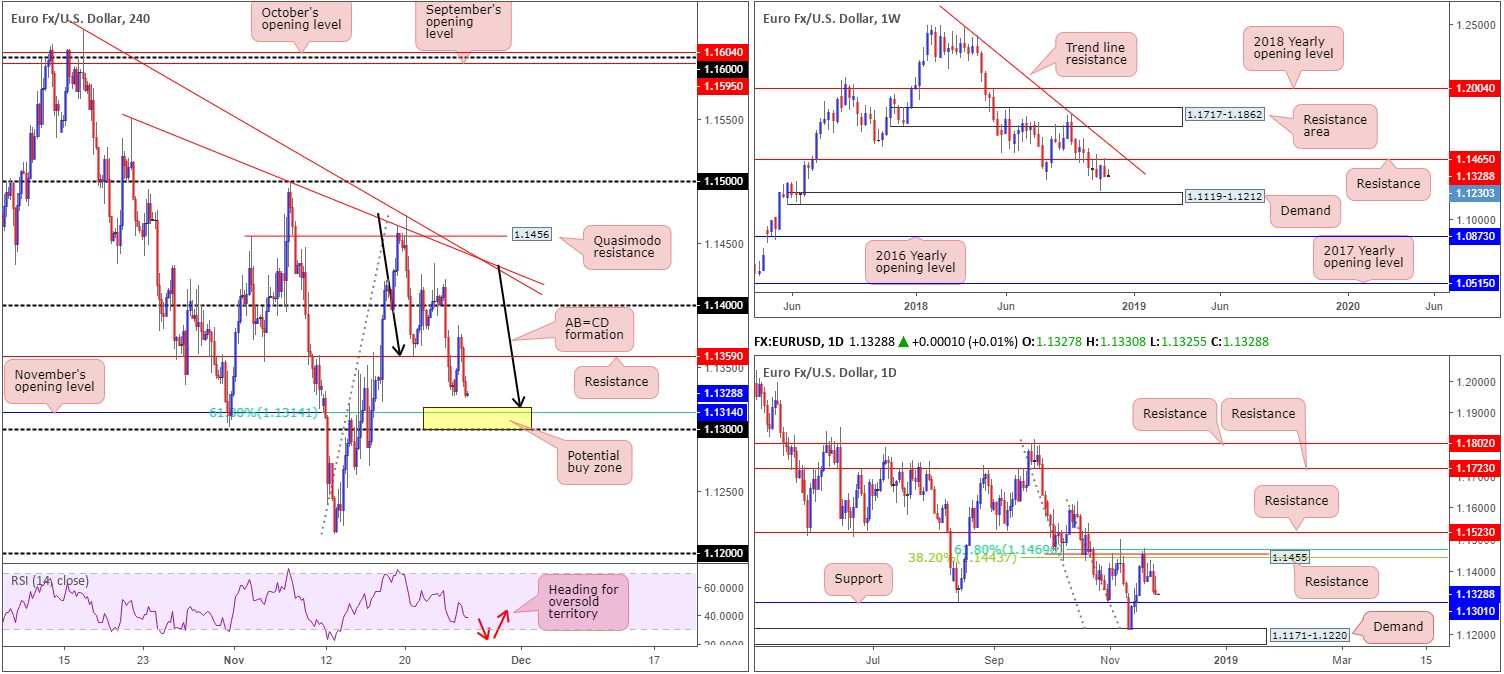
Monday’s Asian session, along with a portion of Europe’s morning segment, observed a resurgence of EUR/USD bidding enter the fold. Despite an upbeat start to the week, the market topped in early Europe following a lower-than-expected German IFO business climate reading, consequently pulling the H4 candles back under its resistance level at 1.1359. ECB President Draghi also took to the stage amid Europe’s afternoon session, though had little impact, as he maintained guidance despite acknowledging weak data.
Given the pair effectively closed unchanged Monday, H4 action remains poised to challenge November’s opening level at 1.1314. This level – coupled with a 61.8% Fibonacci support, an AB=CD (black arrows) completion point just north at 1.1318, the 1.13 psychological barrier found below, the RSI indicating its heading for oversold territory and daily support mentioned at 1.1301 – still offers a high-probability reversal zone, according to our technical studies. The only grumble is weekly price is seen fading resistance at 1.1465 and shows room to press as far south as demand printed at 1.1119-1.1212.
Areas of consideration:
The yellow H4 zone marked between 1.13/1.1318 is, as highlighted above, an area of interest for potential longs today.
Aggressive traders might look to enter around the 1.1314ish neighbourhood with stop-loss orders tucked a couple of pips beyond 1.13. Conservative traders, on the other hand, may opt to wait and see how price action behaves before pulling the trigger. A bullish candlestick formation on either the H4/H1 would not only help confirm buyer intent (and help avoid the possibility of being whipsawed out of a trade on a fakeout through 1.13), it’d also provide entry/stop parameters.
As for take-profit targets out of 1.13/1.1318, H4 resistance at 1.1359 appears a logical starting point, followed by the 1.14 level.
Today’s data points: FOMC Member Clarida Speaks; US CB Consumer Confidence; FOMC Member Bostic Speaks.
GBP/USD:
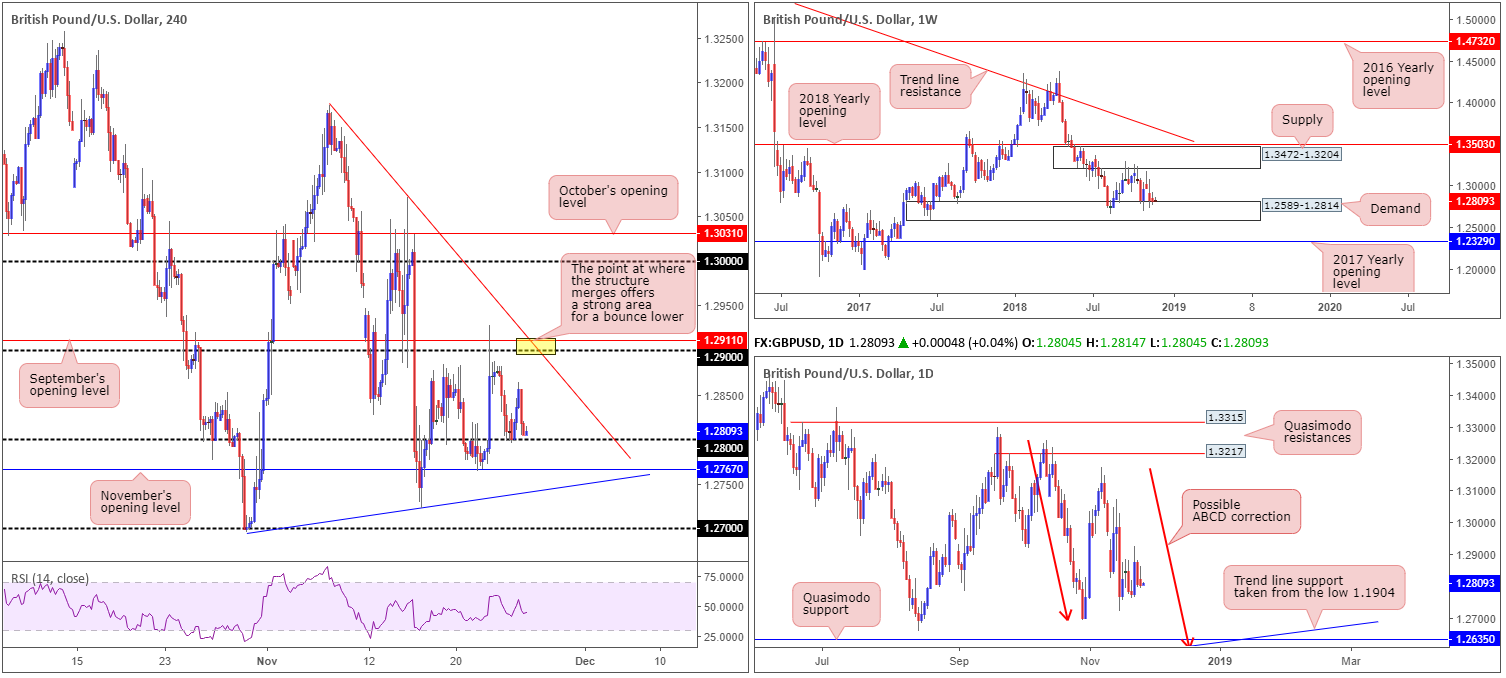
The British pound rose higher vs. its US counterpart amid Asia/Europe hours Monday, supported by the formal approval of the Brexit withdrawal agreement and the political declaration on the future EU-UK relations during the EU summit Sunday.
Despite the positive start to the day, the pair witnessed a sharp change in mood in early US hours and fell sharply lower, bottoming just north of 1.28 on the H4 timeframe into the close. A rejection off 1.28 could lead to a move being seen back up to 1.29, which brings with it a trend line resistance (etched from the high 1.3174) and September’s opening level at 1.2911. A violation of 1.28, however, has November’s opening level at 1.2767 to target, trailed closely by trend line support (taken from the low 1.2695).
The longer-term picture shows the GBP/USD remains restricted between demand at 1.2589-1.2814 and a supply drawn from 1.3472-1.3204 – price is currently testing the lower edge of this range. Price action on the daily timeframe, however, suggests the pair might want to explore lower ground within the walls of the said weekly demand area. The candles, as you can see, spent last week hovering north of the 1.2695 Oct 30 low. While a response from this neighbourhood is possible, the Quasimodo support seen at 1.2635 is a far more appealing level. Aside from 1.2635 fusing with trend line support (taken from the low 1.1904), the approach, should we push for lower levels, will form by way of an ABCD bullish pattern (red arrows) terminating just south at 1.2614.
Areas of consideration:
Medium term (H4), the research team still favours a possible bounce from the underside of 1.29, particularly at the point where the round number merges with the noted trend line resistance (yellow).
Longer term, nonetheless, focus is drawn towards the daily Quasimodo support at 1.2635 for potential longs. The fact this level is positioned within the current weekly demand, and fuses with an ABCD correction point as well as a trend line support, marks a reasonably strong buy zone for future use.
Today’s data points: FOMC Member Clarida Speaks; US CB Consumer Confidence; FOMC Member Bostic Speaks.
AUD/USD:
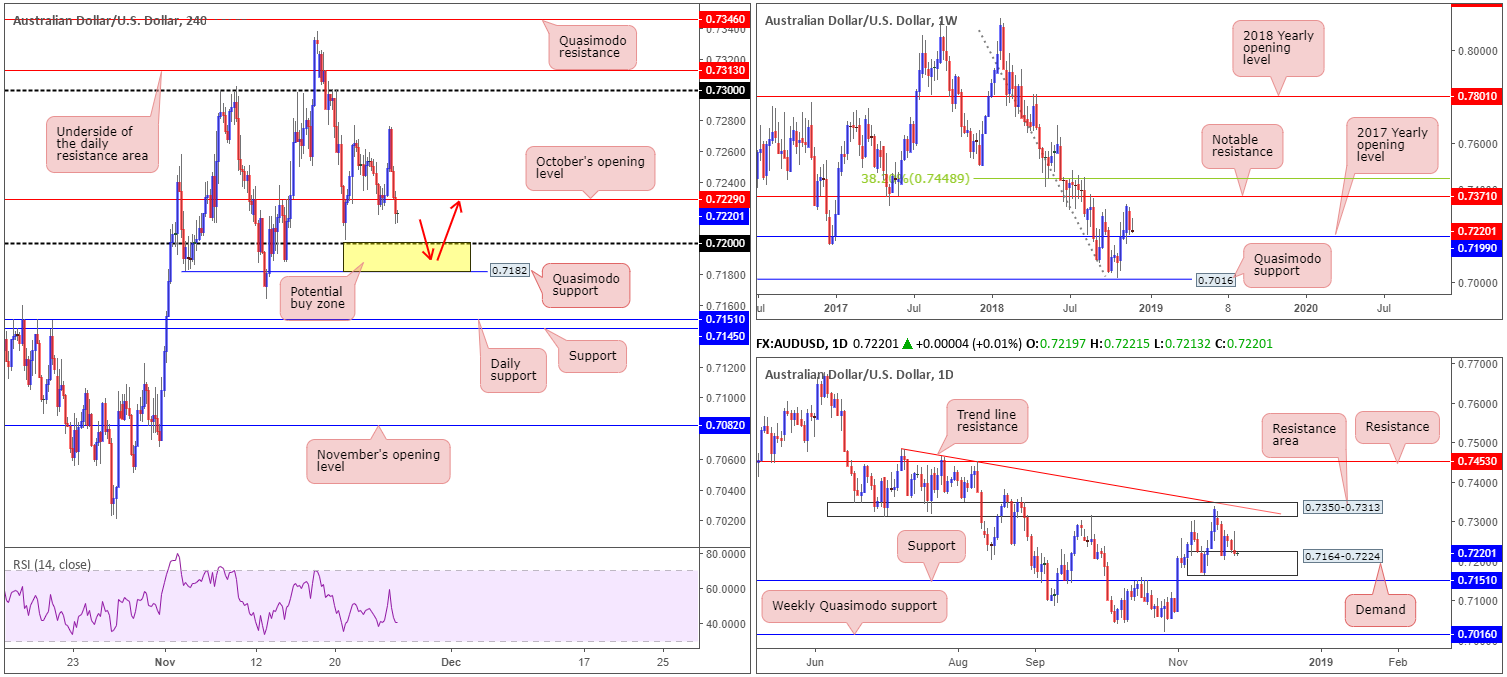
The AUD/USD opened the week on a strong footing as risk appetite fueled upside. In spite of this, the move was short-lived. USD bulls went on the offensive in Monday’s US session, pulling the majority of risk-based pairs lower. The H4 candles reclaimed October’s opening level at 0.7229 at the closing stages, consequently exposing the 0.72 handle.
As highlighted in Monday’s report, the area shaded in yellow between 0.72 and a H4 Quasimodo support level at 0.7182 is of interest for prospective longs. Besides forming within the confines of daily demand at 0.7164-0.7224, 0.72 also represents the 2017 yearly opening level on the weekly timeframe.
Areas of consideration:
A long from 0.7182/0.72 will likely have traders enter around 0.72, with stop-loss orders sited a couple of pips beyond the current daily demand. Entering as low as possible within 0.7182/0.72, however, is recommended, as this will increase risk/reward parameters towards the first area of concern: October’s opening level at 0.7230. Ideally, you’ll want to achieve at least a 1:1 risk/reward ratio at this level.
Today’s data points: FOMC Member Clarida Speaks; US CB Consumer Confidence; FOMC Member Bostic Speaks.
USD/JPY:
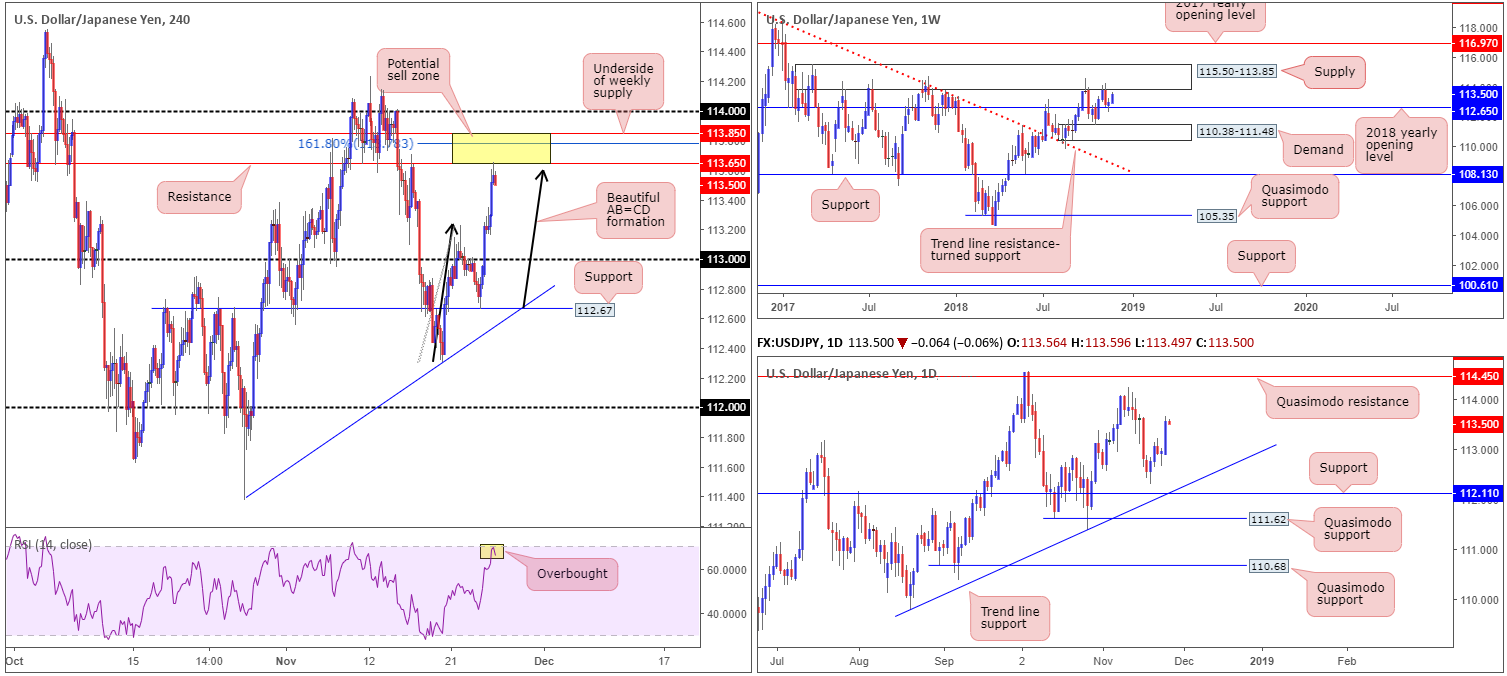
Reinforced by an increase in US Treasury yields and an overall upbeat US stock market, the USD/JPY explored higher ground Monday, up 0.59%. Aside from a slight stumble around last Wednesday’s highs 113.20, the H4 candles concluded the day testing resistance plotted at 113.65.
113.65, according to our research team, is a significant barrier. Not only does it merge closely with a H4 AB=CD symmetrical completion point at 113.61, directly above the level rests a 161.8% H4 Fibonacci ext. point at 113.78 and the underside of weekly supply at 113.85. In addition to this, the H4 RSI indicator is currently trading from oversold territory. Combined, (the yellow zone) 113.85/113.65 forms a rather formidable sell zone.
Areas of consideration:
Although the aforementioned sell zone is appealing, traders are urged to enter as high as possible within the area and also on the back of a H4 bearish candlestick formation. The reasons behind this are simple. Firstly, bringing in the underside of the weekly supply zone (the top edge of the H4 sell zone) will add weight to a reversal being seen from here. Secondly, there’s a strong chance 113.85/113.65 may suffer a fakeout towards the round number 114. Therefore, if one were to position stops a couple of pips above 113.85, a fakeout would take you out of the market unnecessarily.
As for downside targets, 113.20 is likely to hinder selling, as is the 113 handle. The ultimate take-profit zone, however, can be positioned around the 2018 yearly opening level at 112.65 on the weekly timeframe/H4 support at 112.67.
Today’s data points: FOMC Member Clarida Speaks; US CB Consumer Confidence; FOMC Member Bostic Speaks.
USD/CAD:
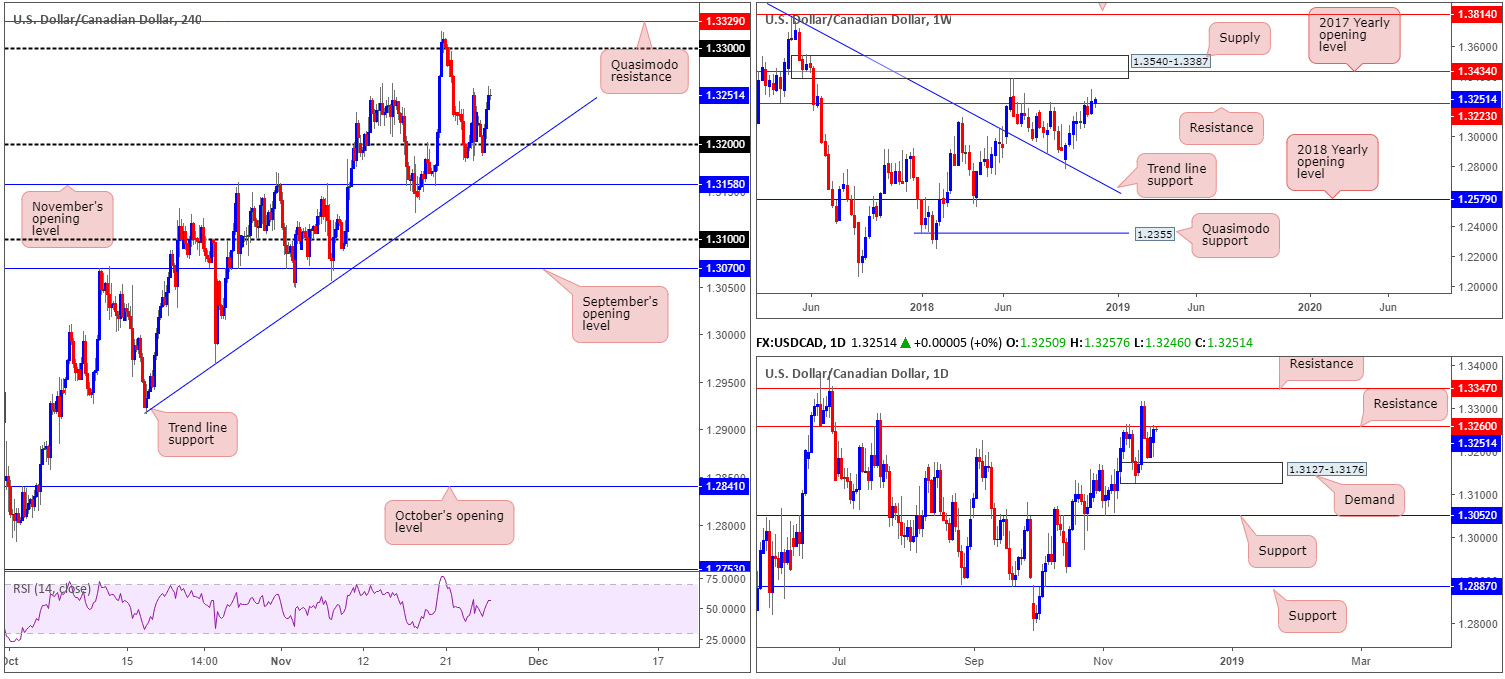
Kicking off from the weekly timeframe this morning, we can clearly see price action establishing ground above resistance at 1.3223 at the moment. Continued buying from here could lead to a test of nearby supply at 1.3540-1.3387 (houses the 2017 yearly opening level within at 1.3434). Adding daily structure to the mix, however, resistance is seen at 1.3260. This, as you can imagine, may hinder weekly buying. In the event we do happen to overthrow this level, though, this will likely bring in nearby resistance at 1.3347.
A little lower on the curve, the 1.32 region on the H4 timeframe, once again, provided support to the market Monday and reached highs of 1.3261. Further buying on this scale appears a reasonable assumption towards its 1.33 level, shadowed closely by a Quasimodo resistance at 1.3329.
Areas of consideration:
While both the H4 and weekly timeframes suggest further buying could be in store, daily resistance at 1.3260 is a challenge.
Should a H4 close print above 1.3260, intraday longs targeting 1.33+ could be an option. Ideally, a retest of 1.3260 as support on the lower timeframes in the shape of a bullish candlestick signal is eyed. Although intraday targets rest at 1.33/1.3329, daily structure has resistance plotted at 1.3347 as an additional target, followed then by the underside of weekly supply at 1.3387.
Today’s data points: FOMC Member Clarida Speaks; US CB Consumer Confidence; FOMC Member Bostic Speaks.
USD/CHF:
For those who read Monday’s briefing you may recall the piece highlighted a potential sell zone ranging between the 1.0000 (parity) level and daily resistance at 0.9986 (green – houses a 161.8% Fibonacci ext. point at 0.9995 within and also merges with the RSI indicator running a possible divergence play).
As you can see from the H4 chart, the zone has so far held ground. With stop-loss orders positioned above H4 supply marked with a red arrow at 1.0007-0.9988, this remains a high-probability selling opportunity.
Areas of consideration:
Keeping it short and sweet this morning, should the unit continue to press for lower ground from current price, traders are urged to consider reducing risk to breakeven/liquidating partial profits at H4 support drawn from 0.9949.
Today’s data points: FOMC Member Clarida Speaks; US CB Consumer Confidence; FOMC Member Bostic Speaks.

Dow Jones Industrial Average:
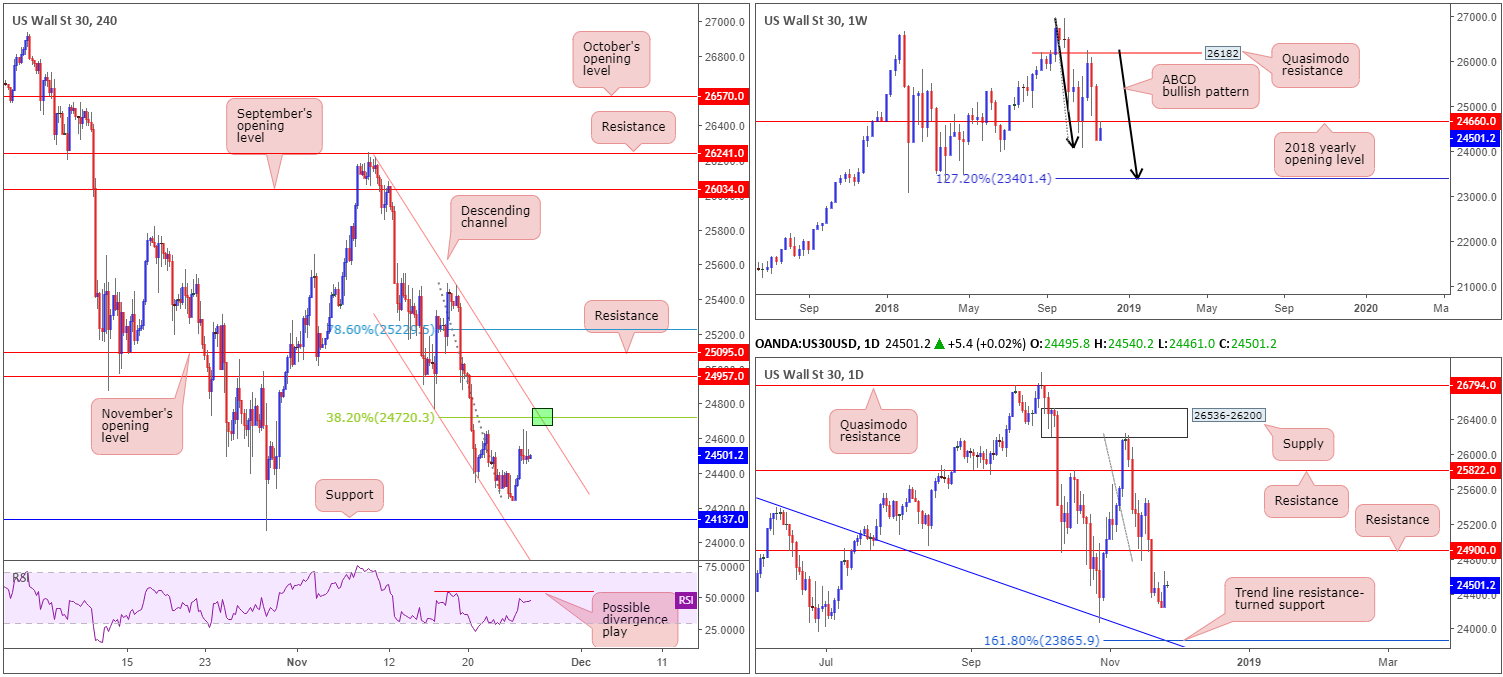
US equities surged Monday, with the Dow Jones Industrial Average receiving a lift from a record Black Friday spending weekend and a rebound in crude oil prices.
Beginning with a look at the weekly timeframe, trade shows price action came within striking distance of retesting the underside of the recently broken 2018 yearly opening level at 24660. According to this timeframe, further selling could give rise to an ABCD (black arrows) 127.2% bullish pattern completing at 23401.
Just north of the noted weekly resistance rests a H4 descending channel resistance (etched from the high 26217), which happens to merge with a 38.2% H4 Fibonacci resistance value at 24720 and a possible divergence play out of the H4 RSI indicator. This confluence, as per our research team, is likely enough to prompt selling should the descending channel resistance be tested, targeting H4 support priced in at 24137.
Areas of consideration:
Given the possibility of a fakeout through the said H4 descending channel resistance, however, traders are urged to consider entering on the back of additional candlestick confirmation. Not only will this provide entry/stop parameters, it’ll also help show seller intent.
Today’s data points: FOMC Member Clarida Speaks; US CB Consumer Confidence; FOMC Member Bostic Speaks.
XAU/USD (Gold):
In light of Monday’s sessions not really producing much to get excited about, the following report will echo thoughts put forward in yesterday’s briefing starting with the weekly timeframe:
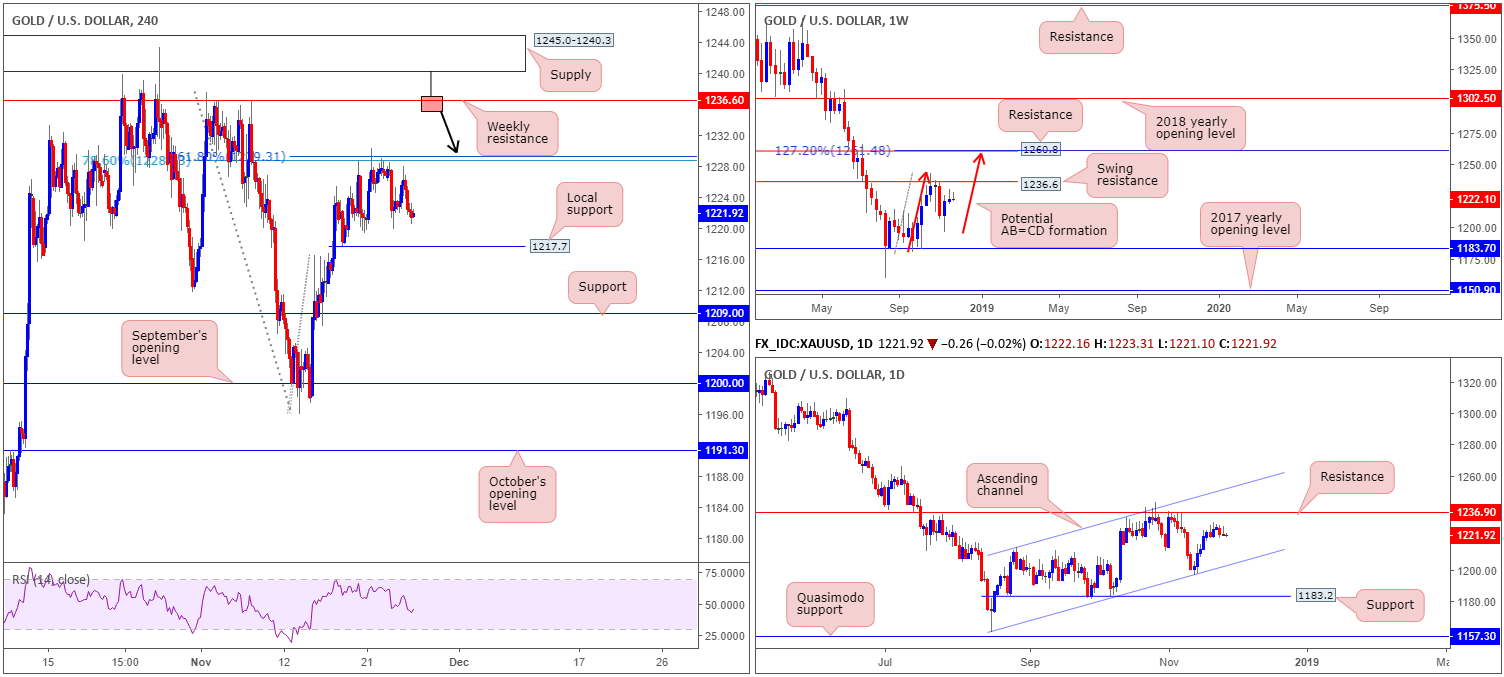
Although the price of gold ranged in excess of $12 last week, the unit settled relatively unchanged. Swing resistance priced in at 1236.6 remains a point of interest on this scale, having seen the barrier hold price action lower in October. Another key point worth noting is the potential for an AB=CD (red arrows) 127.2% bearish formation to complete just north of another layer of resistance (1260.8) at 1261.4.
Daily timeframe:
Looking at this market in more detail, we can see the yellow metal is currently compressing within an ascending channel formation (1160.3/1214.3), with the candles possibly working their way towards a test of resistance at 1236.9 (essentially representing the weekly swing resistance mentioned above at 1236.6).
H4 timeframe:
A brief look at recent dealings on the H4 timeframe shows price spiraled south Friday from the underside of a 78.6% Fib resistance at 1228.7/161.8% Fib ext. point at 1229.3. Should 1217.7 (the last remaining point of local support visible on this timeframe) be taken out, we see little in the way of support until price shakes hands with 1209.0.
Areas of consideration:
Whether additional selling will take place today/this week remains difficult to judge. We say this simply because both weekly and daily timeframes exhibit room to track higher ground. 1217.7 is key, in our view.
- A H4 close beneath 1217.7 that’s followed up with a retest in the shape of a bearish candlestick configuration (entry/stop parameters can be defined according to this configuration) would, likely be enough to prompt a selloff towards H4 support mentioned above at 1209.0.
- Weekly swing resistance mentioned above at 1236.6 is of interest this week. With H4 supply at 1245.0-1240.3 positioned just north of this weekly line, traders should prepare for the possibility of a fakeout play. Therefore, in the event a H4 bearish pin-bar formation take shape that pierces through the weekly resistance and tests the H4 supply (see H4 chart for a visual), this would be considered a high-probability shorting opportunity (stop-loss orders can be positioned either beyond the noted H4 supply or a few pips above the pin-bar’s wick).
The use of the site is agreement that the site is for informational and educational purposes only and does not constitute advice in any form in the furtherance of any trade or trading decisions.
The accuracy, completeness and timeliness of the information contained on this site cannot be guaranteed. IC Markets does not warranty, guarantee or make any representations, or assume any liability with regard to financial results based on the use of the information in the site.
News, views, opinions, recommendations and other information obtained from sources outside of www.icmarkets.com.au, used in this site are believed to be reliable, but we cannot guarantee their accuracy or completeness. All such information is subject to change at any time without notice. IC Markets assumes no responsibility for the content of any linked site. The fact that such links may exist does not indicate approval or endorsement of any material contained on any linked site.
IC Markets is not liable for any harm caused by the transmission, through accessing the services or information on this site, of a computer virus, or other computer code or programming device that might be used to access, delete, damage, disable, disrupt or otherwise impede in any manner, the operation of the site or of any user’s software, hardware, data or property.


