
Key risk events today:
ECB Financial Stability Review; US CB Consumer Confidence; US New Home Sales; BoC Governor Poloz Speaks; RBNZ Financial Stability Report.
Previous analysis as well as outside sources is denoted by way of italics.
EUR/USD:
Europe’s shared currency was somewhat muted south of 1.09 against the buck Monday, as US banks closed in observance of Memorial Day and UK banks in view of Spring Bank Holiday.
Buyers regained some consciousness heading into Europe, nonetheless, as sentiment among German companies recovered slightly after a catastrophic few months. According to the IFO Institute, the Business Climate Index rose from 74.2 points in April to 79.5 points in May. Even though companies once again assessed their current situation as slightly worse, their expectations for the coming months improved considerably. Nevertheless, many companies are still pessimistic about their business. The gradual easing of the lockdown offers a glimmer of hope.
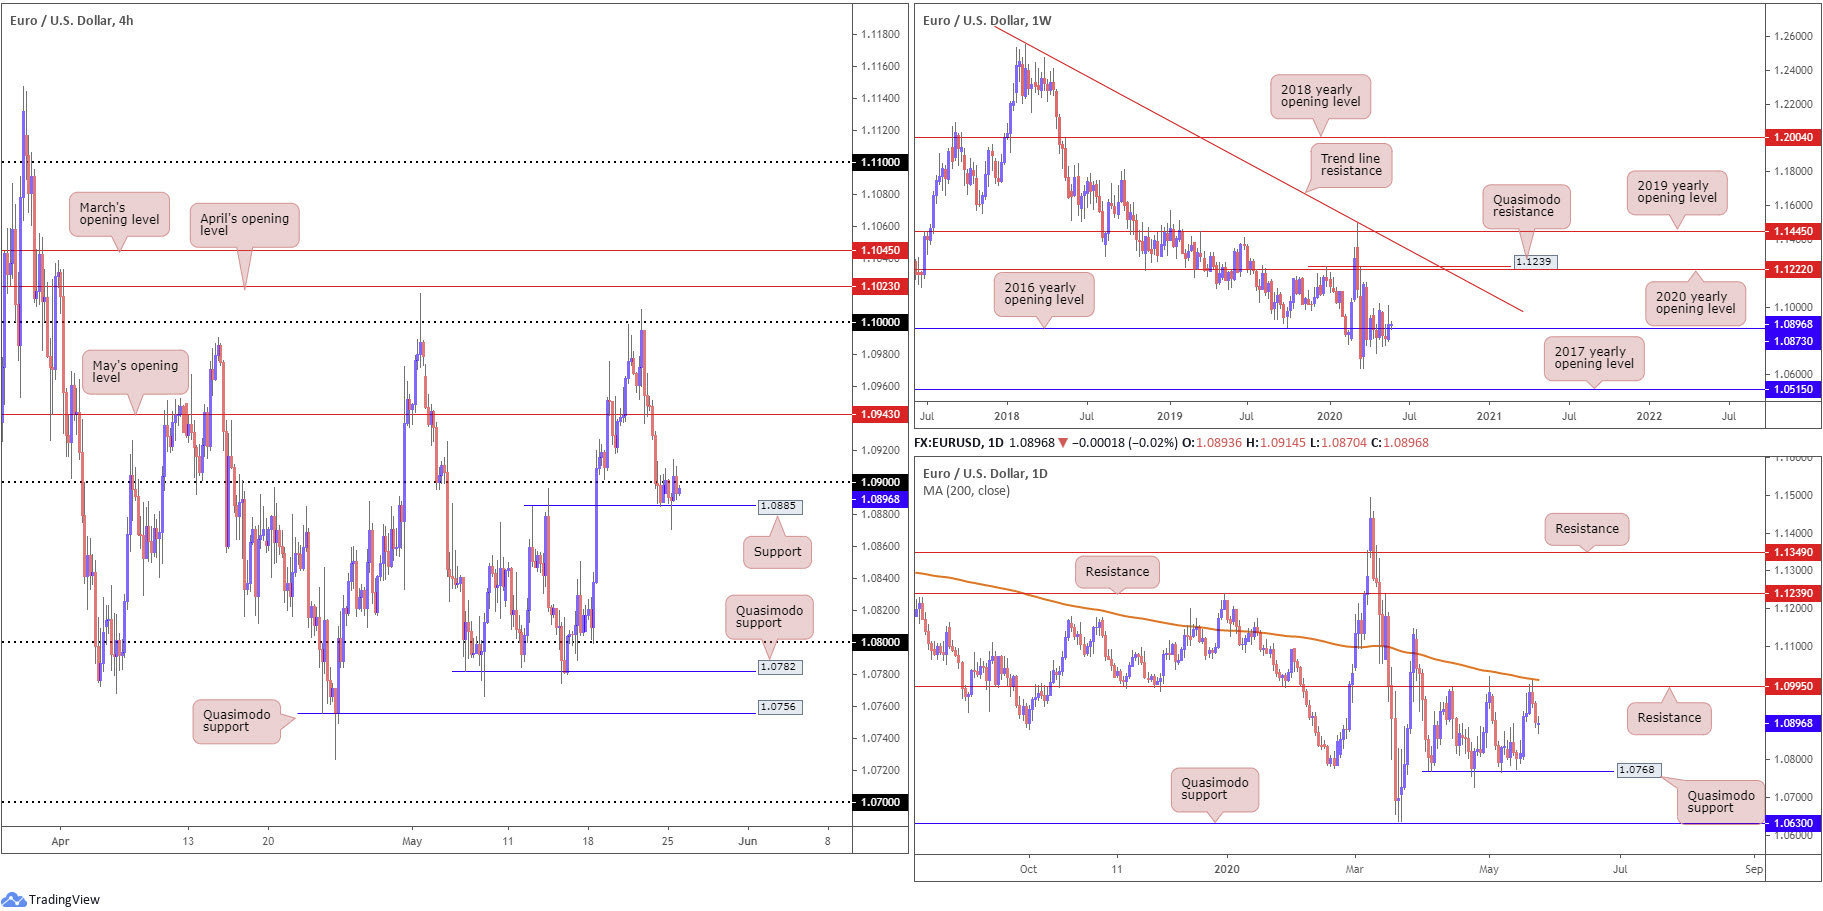
On the technical front, weekly price continues to fluctuate back and forth around the 2016 yearly opening level at 1.0873. Major resistance is not expected to show itself until the 2020 yearly opening level at 1.1222, closely followed by Quasimodo resistance at 1.1239. A bump lower from here, on the other hand, could face multi-year lows at 1.0635. With respect to the long-term trend, the pair has remained under weight since topping in early 2018.
Daily resistance at 1.0995, placed nearby the 200-day SMA (orange – 1.1011), checked upside at the tail end of the week, sending the pair to lows at 1.0885 Friday, with a mild extension to lows at 1.0870 Monday. Traders may also want to note between daily Quasimodo support at 1.0768 and the aforementioned resistances this area has, since early April, carved out a consolidation.
Price action on the H4 timeframe has buyers and sellers battling for position between the underside of 1.09 and support coming in at 1.0885 (a prior Quasimodo resistance level). Above 1.09, March’s opening level at 1.0943 calls for attention. Beyond 1.0885, though, space towards the 1.08 handle is visible, positioned north of Quasimodo support at 1.0782, followed by another film of Quasimodo support at 1.0756.
Areas of consideration:
H4 price surpassing 1.09 and testing H4 support at 1.0885 is interesting. A decisive H4 close back above 1.09 may serve as a forerunner to gains, targeting May’s opening level at 1.0943 as an initial port of call and possibly the key figure 1.10.
The problem for buyers, however, is daily price fading resistance at 1.0995, with room seen to extend losses. Therefore, a H4 close under 1.0885 should not be a surprise and may be regarded as a bearish signal to approach 1.08. While some breakout sellers could attempt to enter short the breakout candle’s close, conservative traders will seek at least a retest under 1.0885/1.09 before committing.
In the event we reach 1.08 this week, keep an eye out for a fakeout through the round number to H4 Quasimodo support at 1.0782. A H4 close back above 1.08 will likely give buyers a shake.
GBP/USD:
Mildly snapping a three-day bearish phase, the British pound led a minor pullback against the greenback Monday, though lacked follow-through movement.
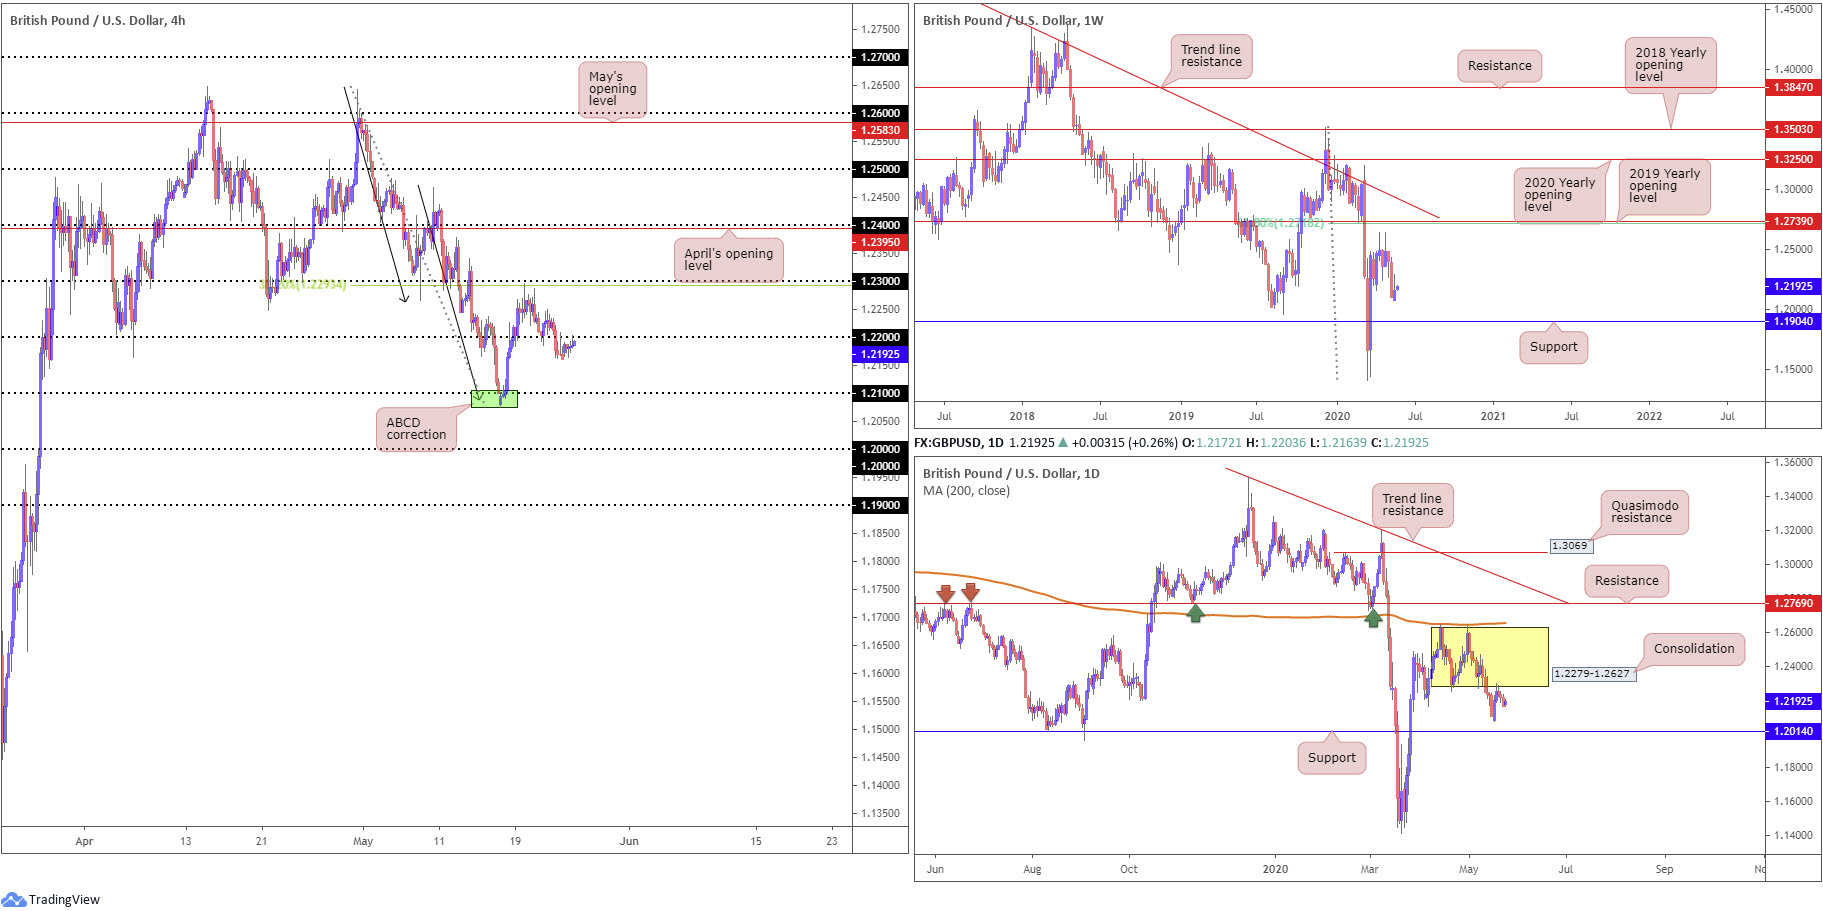
Friday, as seen from the H4 timeframe, tumbled through orders at 1.22 and shined the spotlight on 1.21 as feasible support this week. Candlestick traders, therefore, may demonstrate interest in the recent retest at 1.22, formed in the shape of a shooting star pattern.
Support on the weekly timeframe positions itself at 1.1904, which could, thanks to an unsuccessful attempt at recovery last week, be welcomed into the frame in the near future. Resistance falls in at 1.2739, the 2019 yearly opening level, and a 61.8% Fibonacci retracement ratio at 1.2718, sited close by a trend line resistance, extended from the high 1.5930.
The daily window observed sellers make a stand off range lows at around 1.2279 last week. This is a retest situation that could, assuming an engulf south of 1.2075 (May 18 low), drift towards support coming in at 1.2014, a level boasting history dating as far back as late 2016.
Areas of consideration:
There are a number of technical elements supporting further selling this week. Primarily, we have weekly price denoting a floorless market until reaching support at 1.1904. On top of this, daily price turned off 1.2279, with room to approach at least 1.2075. Lastly, H4 price exhibits signs of weakness under 1.22, with 1.21 in view as a potential downside target. Those short the recent H4 shooting star pattern may favour levels beyond 1.2208 as a location for protective stop-loss orders.
AUD/USD:
Upbeat risk sentiment lifted the Australian dollar modestly higher vs. the US dollar Monday, paring a two-day bearish phase, though lacked much oomph due to market closures in the US and UK.
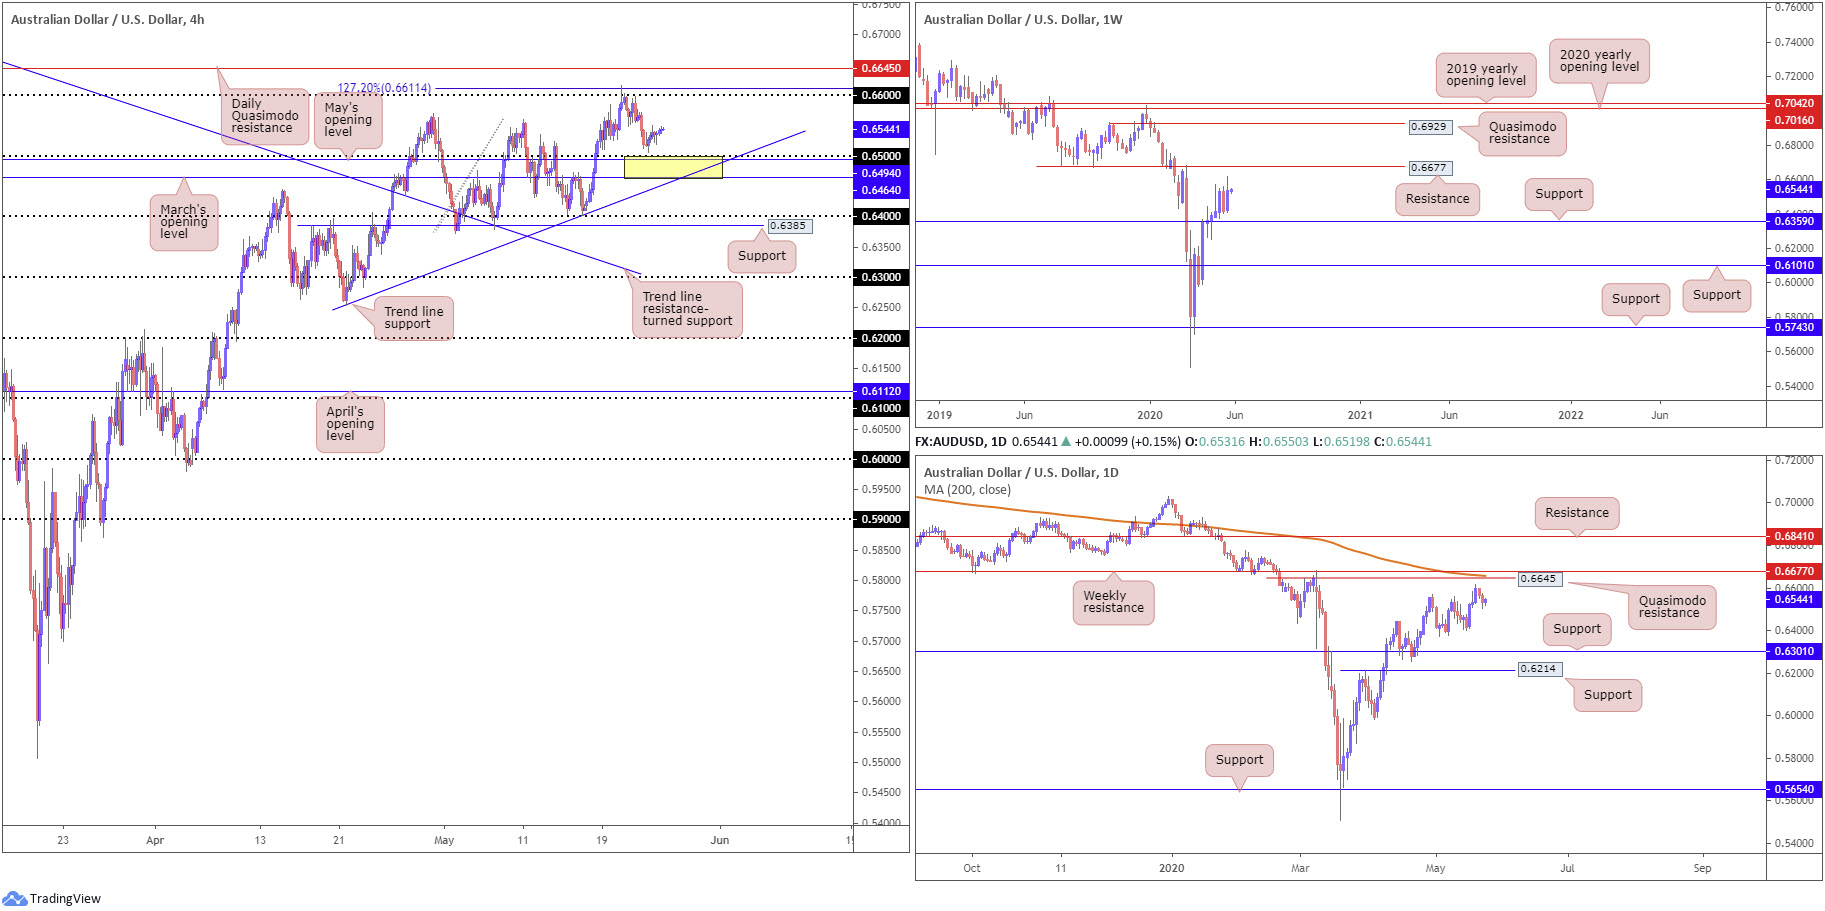
From the weekly timeframe, price remains buoyant ahead of support coming in at 0.6359, throwing resistance at 0.6677 in the pot as a potential upside base this week. Overall, longer-term traders will also note we have been trending lower since the start of 2018, therefore recognising that the move from multi-year lows at 0.5506 could simply be a bulky pullback before attempting a run to fresh lows. Could 0.6677 be that level to hold back buyers?
Technical structure on the daily timeframe had the April 30 high at 0.6569 taken last week, consequently highlighting a Quasimodo formation from 0.6645, parked just ahead of the weekly resistance level mentioned above at 0.6677 and a 200-day SMA (orange – 0.6658). The 0.6402 May 15 low represents the next downside target on the daily scale, with a break underlining the 0.6372 May 4 low and support at 0.6301.
A mild recovery was seen north of 0.65 Friday, based on the US dollar index marginally pulling off highs at 99.87. The pair, as briefly highlighted above, attempted to secure higher ground Monday, though lacked enthusiasm. Additional support rests at May’s opening level from 0.6494, closely followed by March’s opening level at 0.6464 and a trend line support, extended from the low 0.6253. Beyond here, 0.64 is seen as a possible ‘floor’, along with support coming in at 0.6385.
Areas of consideration:
The intraday window could have buyers make a stand out of 0.6464/0.65 on the H4 timeframe this week (yellow). However, it’s worth noting the base contains zero higher-timeframe confluence, therefore may discourage some traders.
Any sustained move beneath 0.6464/0.65 may spark breakout strategies to 0.64.
Should 0.66 come under fire, daily Quasimodo resistance at 0.6645, the 200-day SMA at 0.6658 and weekly resistance at 0.6677 offers a potent combination of resistance to play with.
USD/JPY:
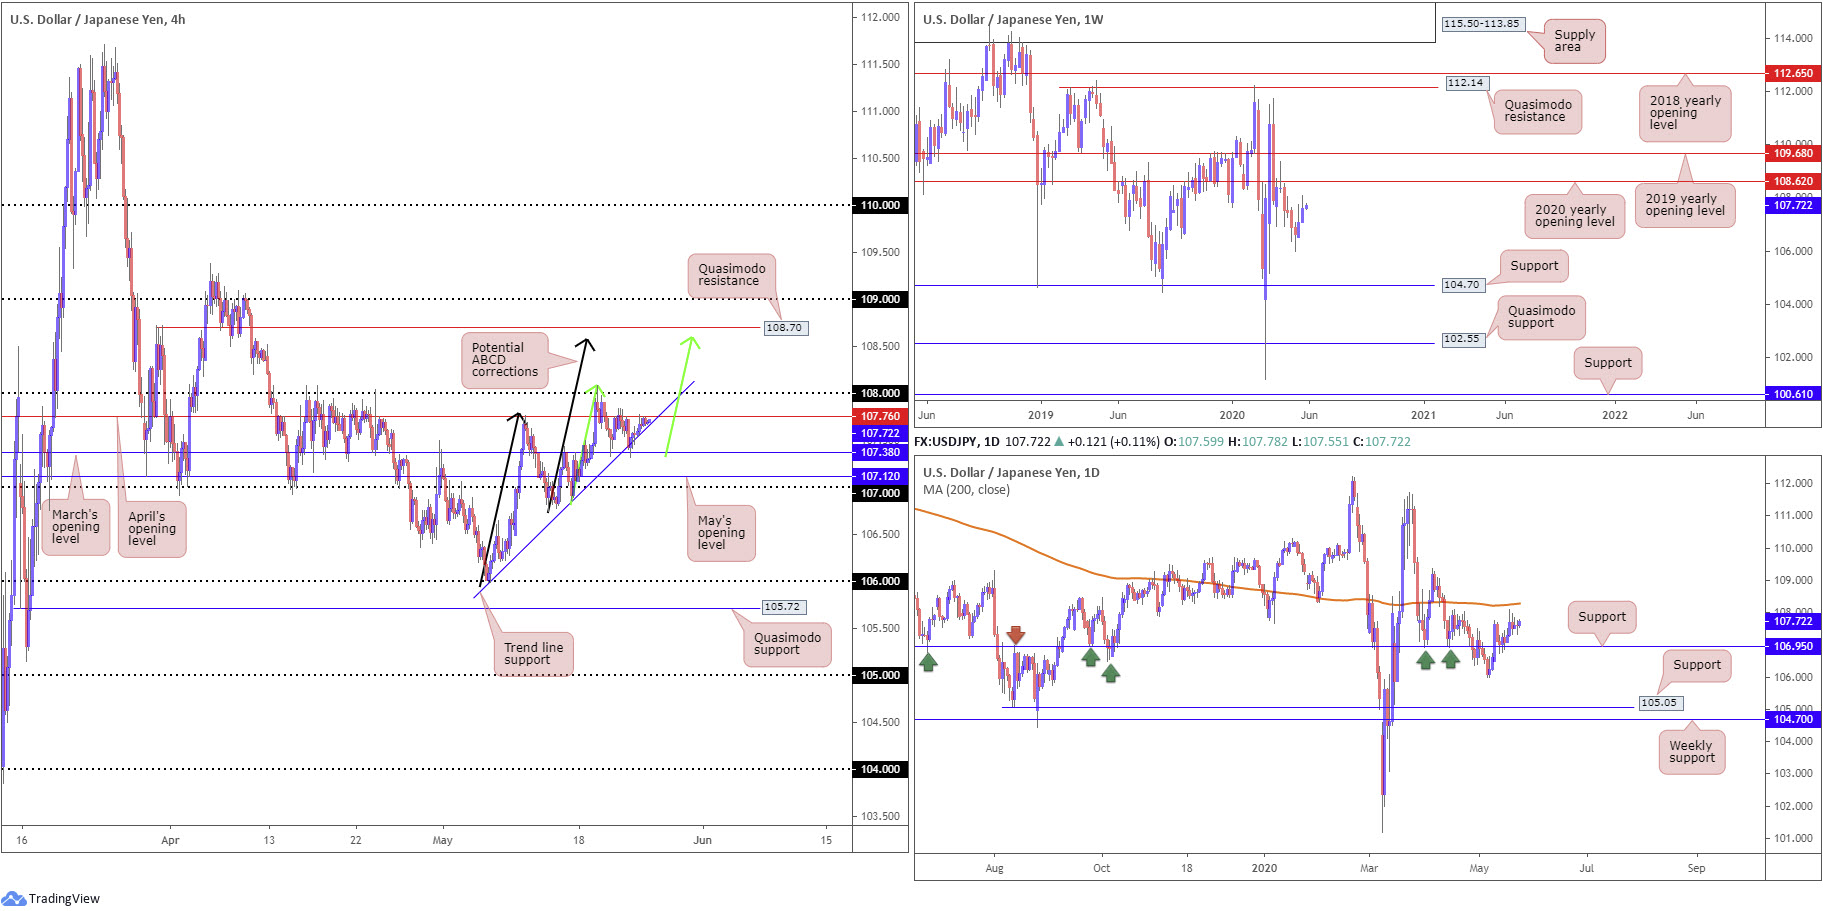
The US dollar finished Monday with minor gains against the Japanese yen, following Friday’s fakeout through trend line support, taken from the low 105.98, into March’s opening level at 107.38. The rally from here saw April’s opening level at 107.76 make an entrance yesterday, with a break exposing 108. Also of interest, above 1.08 we have two ABCD bearish patterns (black/green arrows) merging around 108.60ish, sited just south of Quasimodo resistance at 108.70.
Technical action on the weekly timeframe, following two consecutive weeks of gains, concluded nearby the 2020 yearly opening level at 108.62. Continued bidding, moves that overthrow sellers at 108.62, nudges the 2019 yearly opening level at 109.68 into sight. A rotation to the downside from current price, however, has support at 104.70 to target.
Technical action on the daily timeframe recently shook hands with support at 106.95, after dipping from three-week tops at 107.76. Since then, price has been kicking its heels within striking distance of the 200-day SMA (orange – 108.28), with a break exposing the 109.38 April 6 high.
Areas of consideration:
A fakeout through 108 into the 200-day SMA at 108.28 is a potential scenario possibly interesting sellers. Buy-stops contained above 108 may provide enough fuel to sell. Conservative traders, however, may seek a H4 close beneath 108 before committing.
The H4 ABCD corrections at 108.60 also marks an interesting reversal zone this week, an area boasting a close relationship with H4 Quasimodo resistance at 108.70 and weekly resistance at 108.62 (the 2020 yearly opening level).
USD/CAD:
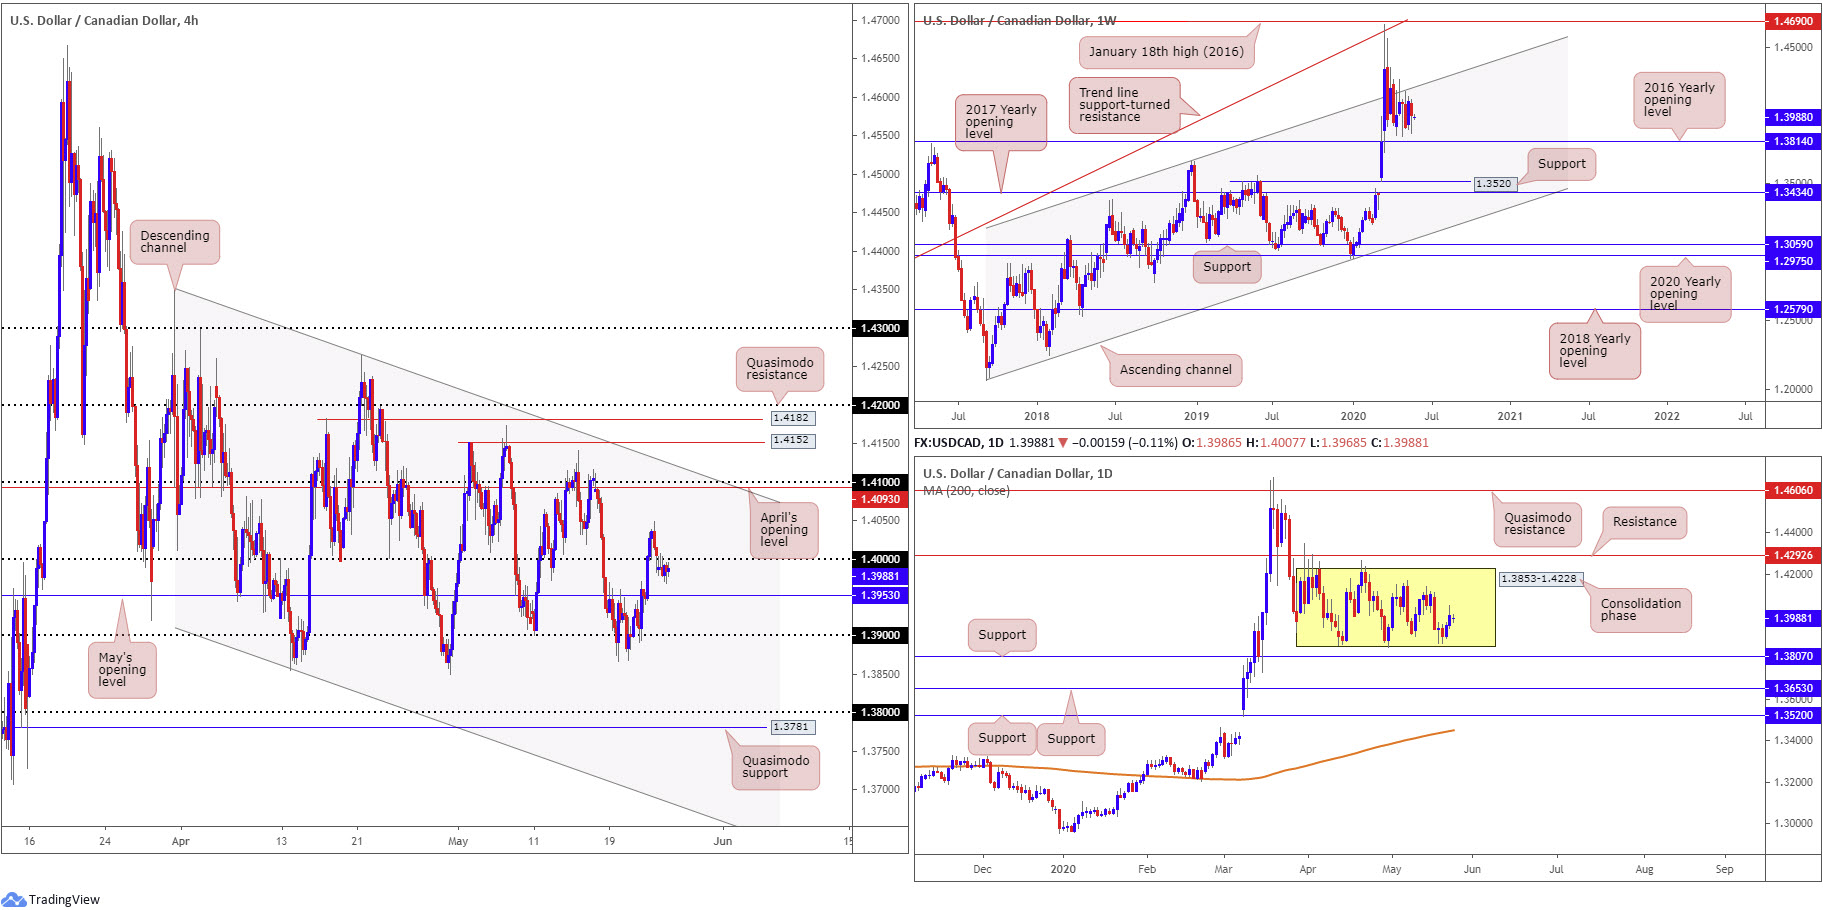
In similar fashion to other markets Monday, USD/CAD entered into a tight channel a few pips under the key figure 1.40, finishing the day in the shape of an indecision candle. Under 1.40 we can see May’s opening level at 1.3953 as possible support, followed by the 1.39 handle.
Structure on the weekly timeframe shows buyers and sellers battling for position between a long-standing channel resistance, taken from the high 1.3661, and the 2016 yearly opening level at 1.3814. The said base stands in a reasonably healthy position as, overall, we’ve been trending higher since September 2017.
Since April, price action on the daily timeframe has been carving out a consolidation between 1.3853-1.4228 – current price trades above range lows. Outside of the range, resistance is drawn from 1.4292 and support can be found at 1.3807. In addition, traders will note the 200-day SMA (orange – 1.3449) has been drifting northbound since March.
Areas of consideration:
Sellers will be keen on the underside of 1.40, particularly after yesterday’s shooting star candlestick pattern. As stated above, downside targets rest at May’s opening level, as well as 1.39.
If 1.39 gives way, reaching daily range lows at 1.3853 and maybe, with a little oomph, the daily support at 1.3807 and 1.38 handle is possible. Conservative sellers below 1.39 may seek additional bearish candlestick confirmation before taking action. Not only does this help confirm seller intent under 1.39, it provides structure to position entry and risk levels.
USD/CHF:
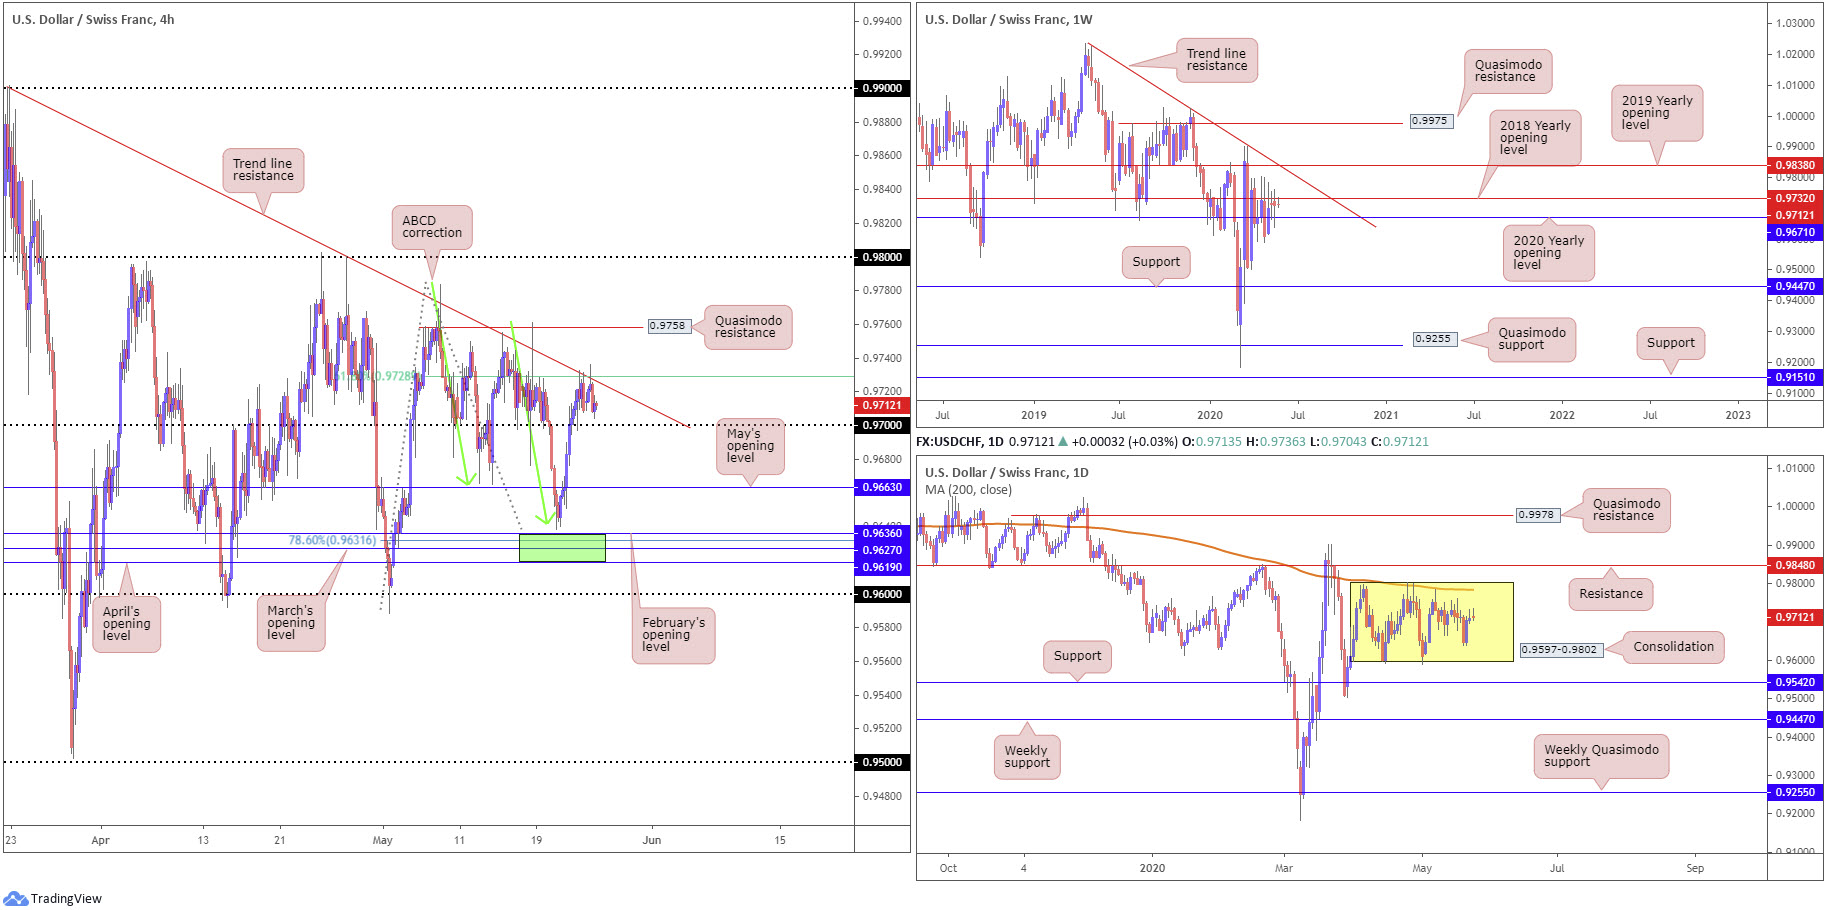
Responding to a H4 ABCD correction (green arrows) at 0.9641 last Thursday, and leaving 0.9619/0.9636 (green) unchallenged, an area made up of April, March and February’s opening levels, the US dollar pencilled in a firm recovery against the Swiss franc. Follow-through buying emerged Friday, bolstered by a broad USD bid.
H4 trend line resistance, extended from the high 0.9900, and a H4 61.8% Fibonacci retracement ratio at 0.9728 (note this is traditionally considered a take-profit target out of ABCD scenarios) entered view in recent trade and, as you can see, held ground, positioning price action within striking distance of 0.97.
April onwards, based on the weekly timeframe, has witnessed the 2018 yearly opening level at 0.9732 establish resistance, recently motioned in the form of consecutive selling wicks off 0.9800ish. The past couple of weeks, nevertheless, concluded forming clear-cut indecision candles, with extremes connecting with 0.9732 and the 2020 yearly opening level from 0.9671. Technical structure above 0.9732 is seen at the 2019 yearly opening level drawn from 0.9838 and trend line resistance, taken from the high 1.0226. Moves south of 0.9671 shines the spotlight on the possibility of a run to support at 0.9447.
Since early April, price action on the daily timeframe has seesawed between 0.9802/0.9597, with current price drifting mid-range. Traders may also want to acknowledge the 200-day SMA (orange – 0.9783) circling the upper border of the aforementioned range. Outside of the base, traders will note resistance rests at 0.9848 and support from 0.9542.
Areas of consideration:
As evident from the H4 chart, we can see an intraday rotation formed from 0.9728/32 Monday. Sellers will be reluctant to pull the trigger at current price, knowing 0.97 could house active buyers. Consequently, a H4 close south of 0.97 may be needed to tempt bearish strategies this week towards May’s opening level at 0.9663.
Should we break through current resistance on the H4, Quasimodo resistance is seen at 0.9758, followed by the 200-day SMA at 0.9783 and then the 0.98 handle, which merges with the top edge of the current daily range.
XAU/USD (GOLD):
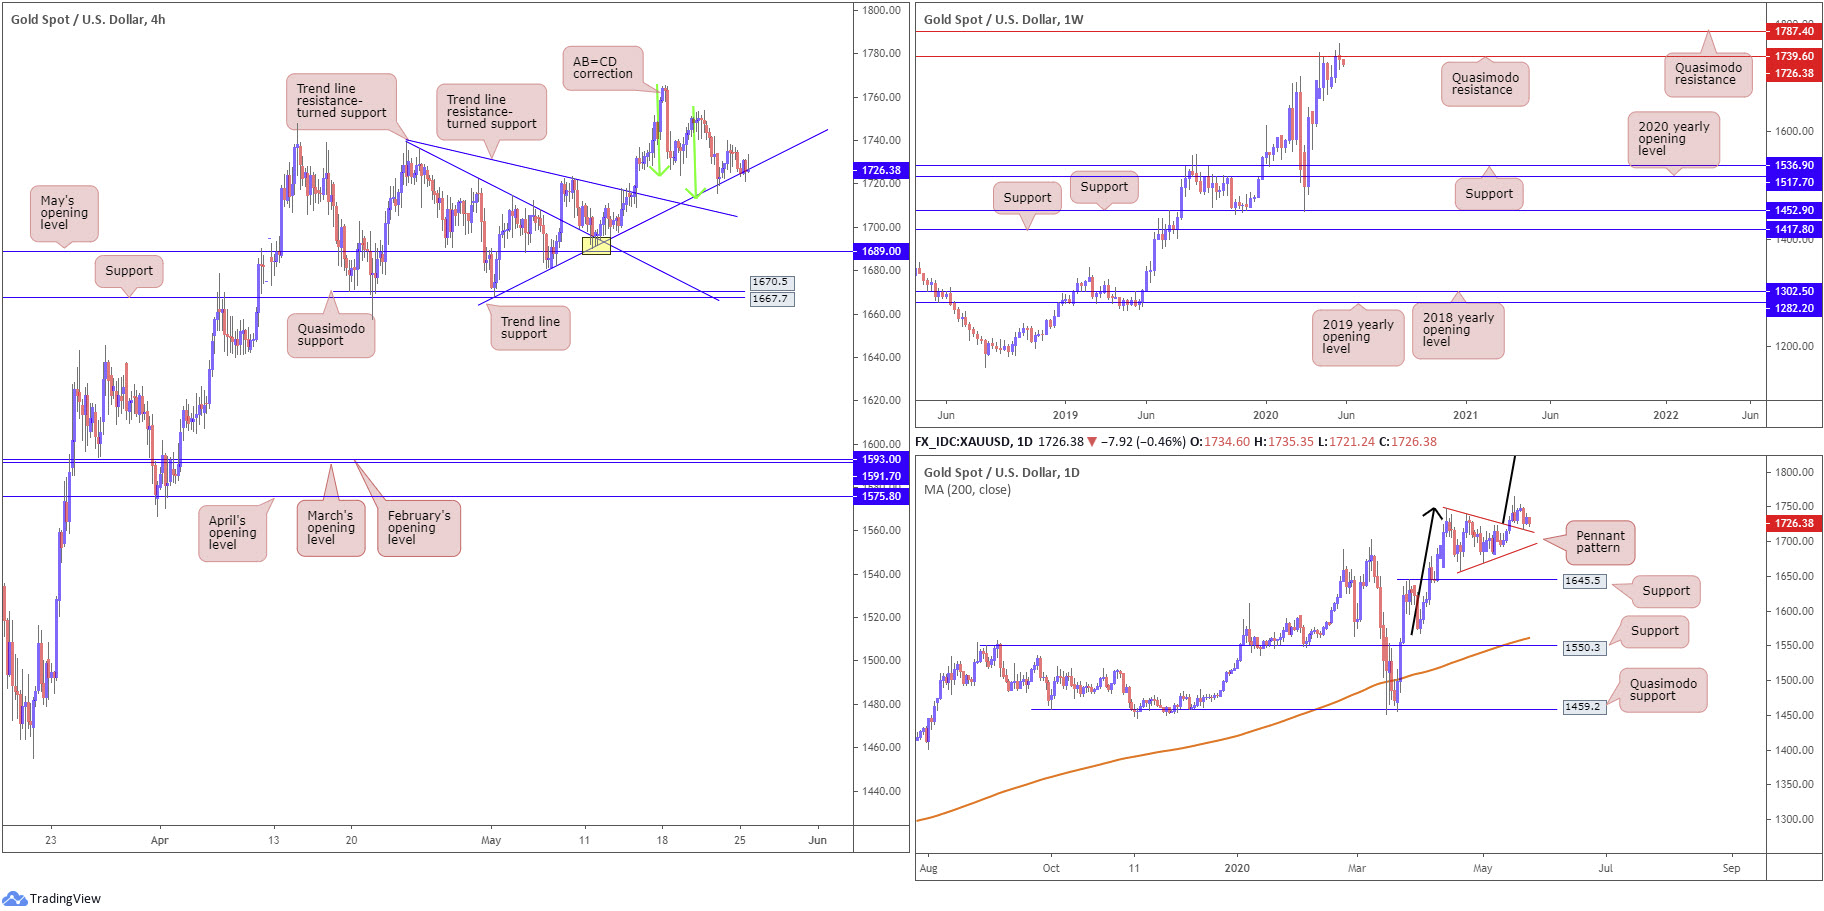
Bullion entered the new week on the backfoot, down 0.5% against the buck by the close.
This hauled H4 price back to trend line support, extended from the low 1668.0, which initially came with an AB=CD bullish correction (green arrows) at 1712.8.
The technical landscape on the weekly timeframe has, from mid-April, seen buyers and sellers battle for position around the underside of Quasimodo resistance at 1739.6. That was until last week after buyers regained awareness and took off to highs at 1765.3, slicing through the aforementioned Quasimodo formation. Clearance of 1739.6 places another layer of Quasimodo resistance on the hit list at 1787.4. It may also interest some traders to note the trend on gold has faced a northerly trajectory since 2016.
The daily timeframe offers chart pattern enthusiasts a bullish pennant configuration to work with, established from a high of 1747.7 and a low coming in from 1658.1. What’s also notable is Thursday retested the broken pennant resistance as support, and held into Friday. Take-profit targets out of pennant patterns are measured by taking the preceding move (black arrows) and adding the value to the breakout point. This offers a sizeable take-profit, coming in at 1909.4.
Areas of consideration:
The combination of H4 trend line support, the H4 AB=CD approach, daily pennant pattern and underlying trend, is likely sufficient to hold back further selling in this market.
It was noted in Friday’s briefing (italics):
Traders long the H4 AB=CD configuration may have protective stop-loss orders set around 1700.8, under a H4 trend line resistance-turned support, taken from the high 1739.1, targeting a H4 close above weekly Quasimodo resistance at 1739.6 in favour of a possible extension to weekly Quasimodo resistance at 1787.4 this week.
The accuracy, completeness and timeliness of the information contained on this site cannot be guaranteed. IC Markets does not warranty, guarantee or make any representations, or assume any liability regarding financial results based on the use of the information in the site.
News, views, opinions, recommendations and other information obtained from sources outside of www.icmarkets.com.au, used in this site are believed to be reliable, but we cannot guarantee their accuracy or completeness. All such information is subject to change at any time without notice. IC Markets assumes no responsibility for the content of any linked site.
The fact that such links may exist does not indicate approval or endorsement of any material contained on any linked site. IC Markets is not liable for any harm caused by the transmission, through accessing the services or information on this site, of a computer virus, or other computer code or programming device that might be used to access, delete, damage, disable, disrupt or otherwise impede in any manner, the operation of the site or of any user’s software, hardware, data or property.


