
EUR/USD:
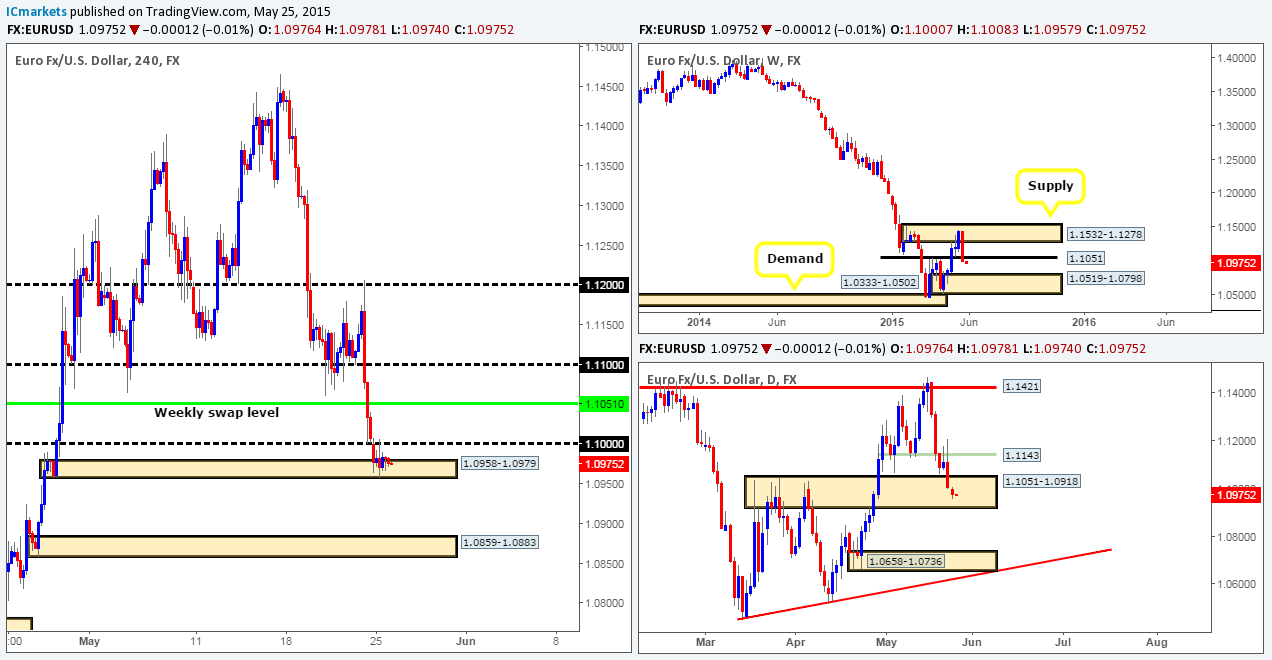
Weekly view: Last week’s trading action shows that the Euro sold off from a weekly supply area coming in at 1.1532-1.1278, resulting in price taking out a weekly swap level seen at 1.1051, and potentially clearing the path south down towards the weekly demand zone positioned at 1.0519-1.0798.
Daily view: From this angle, we can see that price is currently trading deep within a daily swap area positioned at 1.1051-1.0918 with little to no buying interest being seen at the moment. A break below this zone could suggest further downside towards the daily demand area seen at 1.0658-1.0736.
4hr view: As expected, Monday’s sessions were incredibly quiet. Once price shook hands with the 4hr demand area seen at 1.0958-1.0979, we saw a clear intraday range form between1.0983 and 1.0971.
Buying from the current 4hr demand area is considered a risky trade in our book. Yes, one could say that this area has additional backing from the daily swap area seen at 1.1051-1.0918, but when there’s potential near-term resistance sitting just above at 1.1000, and the weekly swap level looming just above this barrier at 1.1051, the odds of a successful trade are not exactly in our favor here we think.
If on the other hand, we see a clear violation of the current 4hr demand area, this could stimulate a decline down towards 4hr demand at 1.0859-1.0883. In spite of this, for us to be given the green light to short following the close lower, we would need to see not only a strong retest of this area as supply, but also supporting lower timeframe confirmation like a trendline break, selling tails or even an engulf of lower timeframe demand…
Levels to watch/live orders:
- Buys: Flat (Predicative stop-loss orders seen at: N/A).
- Sells: Flat (Predicative stop-loss orders seen at: N/A).
GBP/USD:
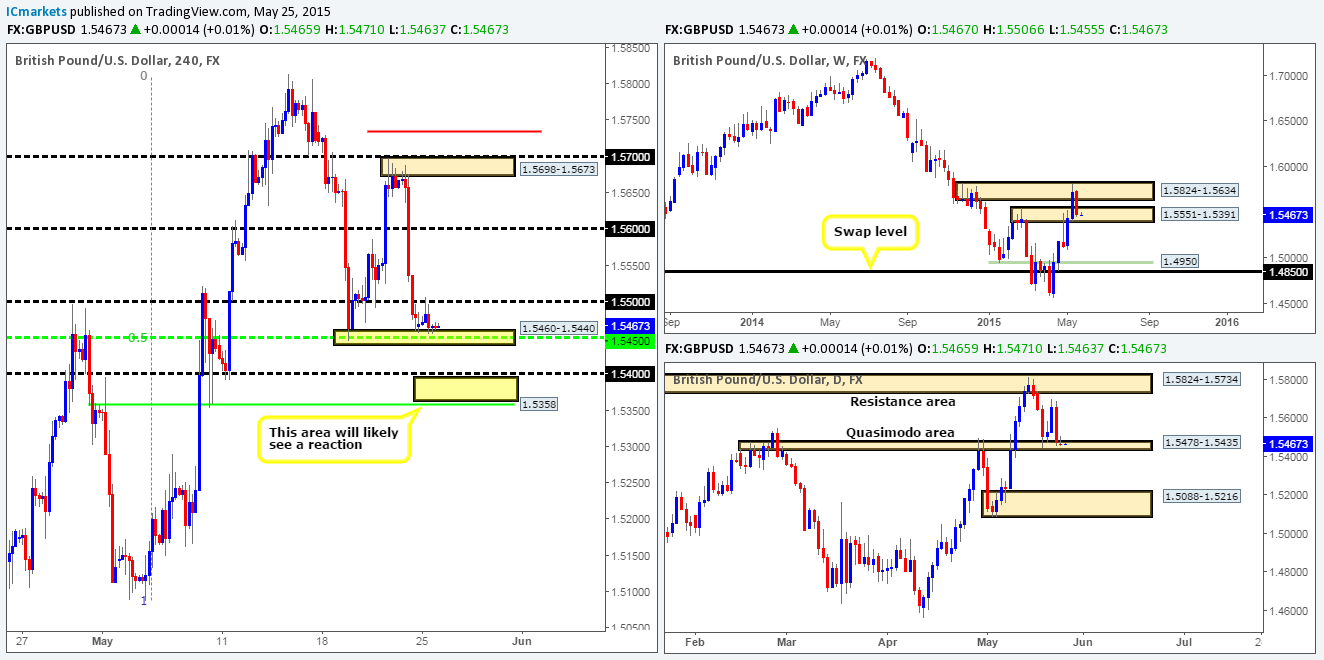
Weekly view: The weekly timeframe shows that last week’s trading saw the GBP sell off from deep within a weekly supply area coming in at 1.5824-1.5634. This, as you can see, not only forced price to close deep within a weekly swap area seen just below it at 1.5551-1.5391, but also formed a bearish inside candle pattern.
Daily view: From the daily timeframe, we can see that price remains trading within the confines of an ignored daily Quasimodo area seen at 1.5478-1.5435. If this zone gives way sometime this week, this could set the stage for a continuation move south down towards daily demand positioned at 1.5088-1.5216.
4hr view: Due to the liquidity shortage in the markets yesterday, the GBP remained trading between the 4hr support area at 1.5460-1.5440 and round number 1.5500. This 4hr zone not only boasts support from the mid-level number 1.5450 and 50% Fibonacci retracement level, but it is also located deep within higher timeframe supportive structures (see above). Sounds like a great buy doesn’t it?
We agree this is a strong buy zone; however buying the GBP from this 4hr area is not really something our team would be comfortable with, especially with potential resistance looming just above at 1.5500. As far as we can see, waiting for price to break above and retest 1.5500 would be not only a far more conservative approach, but it also improves risk/reward considerably if one targets 1.5600.
In the event that price breaks below the current 4hr supportive base, we see very little room to profit – 40 pips to be exact. Unless you can find a short entry with a very small stop, this is not a viable trade in our book, as there is likely going to be active buyers waiting in between 1.5400/1.5358.
Levels to watch/ live orders:
- Buys: Flat (Predicative stop-loss orders seen at: N/A).
- Sells: Flat (Predicative stop-loss orders seen at: N/A).
AUD/USD:
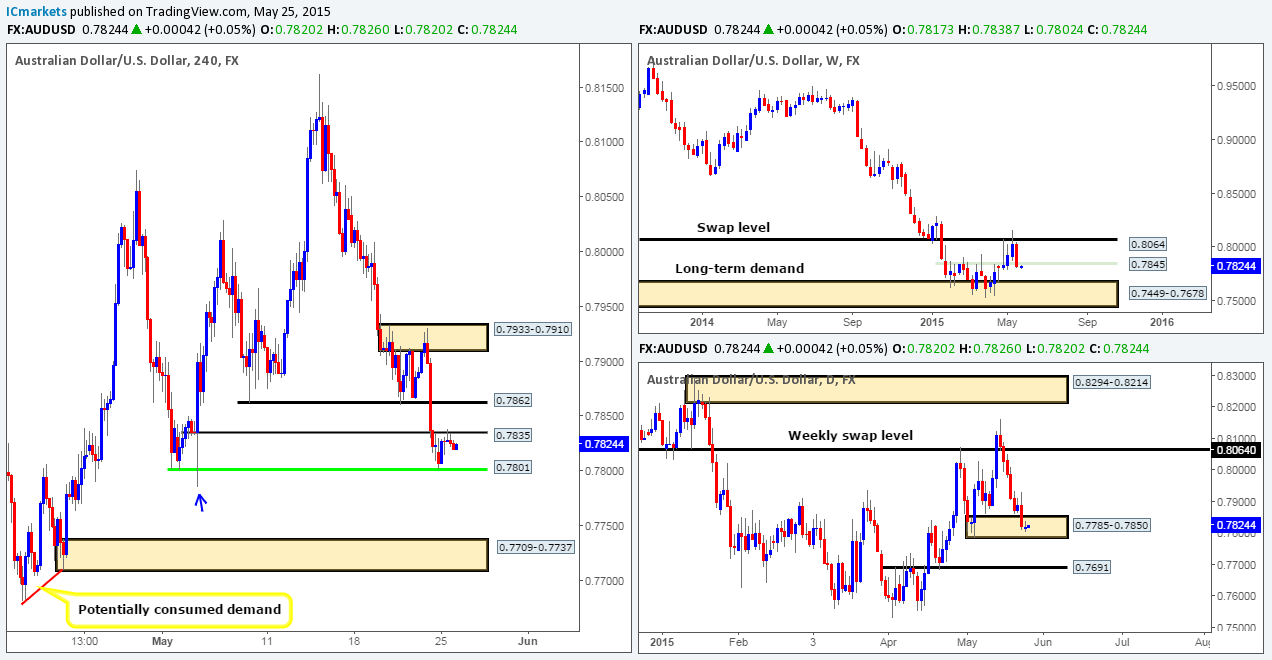
Weekly view: Last week’s action ended with the Aussie pair closing below a weekly swap level seen at 0.7845. As long as the sellers can hold out below this level this week, it is very possible we may see price shake hands with the long-term weekly demand area coming in just below at 0.7449-0.7678.
Daily view: The daily timeframe on the other hand, shows that price is still lurking relatively deep within a daily demand area at 0.7785-0.7850. As such, before any further selling can be seen on the weekly timeframe, the buying pressure within this daily demand zone will need to be taken out first.
4hr view: During yesterday’s sessions, we saw price move all of 35 pips. The 4hr Quasimodo support level at 0.7801 did indeed hold firm, and as a result allowed longs to push price up to test 0.7835.
In favor of going long today, one could say price is trading within daily demand at 0.7785-0.7850, and buying interest is clearly being shown from the aforementioned 4hr Quasimodo level. We would agree with this. However, against you there is resistance forming around 0.7835, and let’s not forget that just above this level – 10 pips in fact, there sits a weekly swap level at 0.7845! Therefore, unless you are targeting very small gains, buying the Aussie pair is not really something we’d stamp high probability at this time.
In the event price closes below 0.7801 today, however, the river south should be ‘ripple free’ down to 4hr demand coming in at 0.7709-0.7737 (surrounds the aforementioned daily swap level). Despite this though, for us to be given the ‘Ok’ to short following a close lower, we would need to see the following take place:
- A break below the low seen marked with a blue arrow at 0.7785 – the lower limit of the daily demand area mentioned above.
- A strong retest of 0.7801 as resistance.
- Supporting lower timeframe confirming price action alongside the retest.
Levels to watch/ live orders:
- Buys: Flat (Predicative stop-loss orders seen at: N/A).
- Sells: Flat (Predicative stop-loss orders seen at: N/A).
USD/JPY:
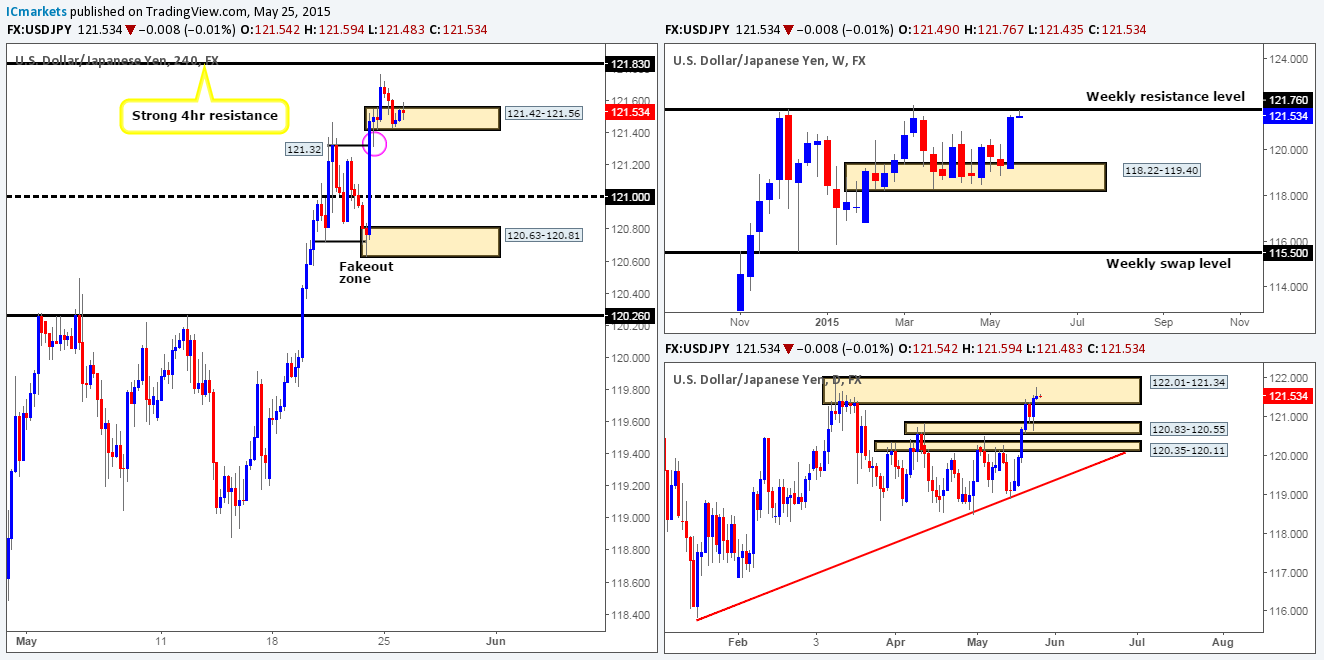
Weekly view: Following last week’s rally seen from weekly demand at 118.22-119.40, price has now crossed swords with a long-term weekly resistance level coming in at 121.76.
Daily view: The daily timeframe shows that price action formed a bearish daily pin-bar candle within the confines of a daily supply area seen at 122.01-121.34 (surrounds the aforementioned long-term weekly resistance level).
4hr view: Yesterday’s sessions saw the 4hr chart form a demand area at 121.42-121.56. This zone may not look much at first glance, but if you scroll back to the left, you’ll see that the push north engulfed several highs, thus making it a key area for us today.
Given that resistance is being seen both on the weekly and daily timeframes (see above) at the moment, it’s quite possible that this market will eventually sell off. Nonetheless, before this takes place, price will need to engulf the aforementioned 4hr demand area. The engulf would be our cue so to speak to begin watching for price to retest this area of demand as supply for a potential short down to at least 121.00. The reason for why we believe price could drop this far is simply because we see price has already spiked (121.31 pink circle) the 4hr swap level at 121.32, thus potentially weakening any buying strength here.
Although our team believes a sell off will ensue shortly, we are also prepared for the possibility that price may rally north to tag the 4hr resistance level above at 121.83 beforehand – an absolutely fantastic area to be looking for lower timeframe confirmed shorts!
Levels to watch/ live orders:
- Buys: Flat (Predicative stop-loss orders seen at: N/A).
- Sells: 121.83 [Tentative – confirmation required here to avoid the possibility of a fakeout] (Predicative stop-loss orders seen at: dependent on where one finds confirmation).
USD/CAD:
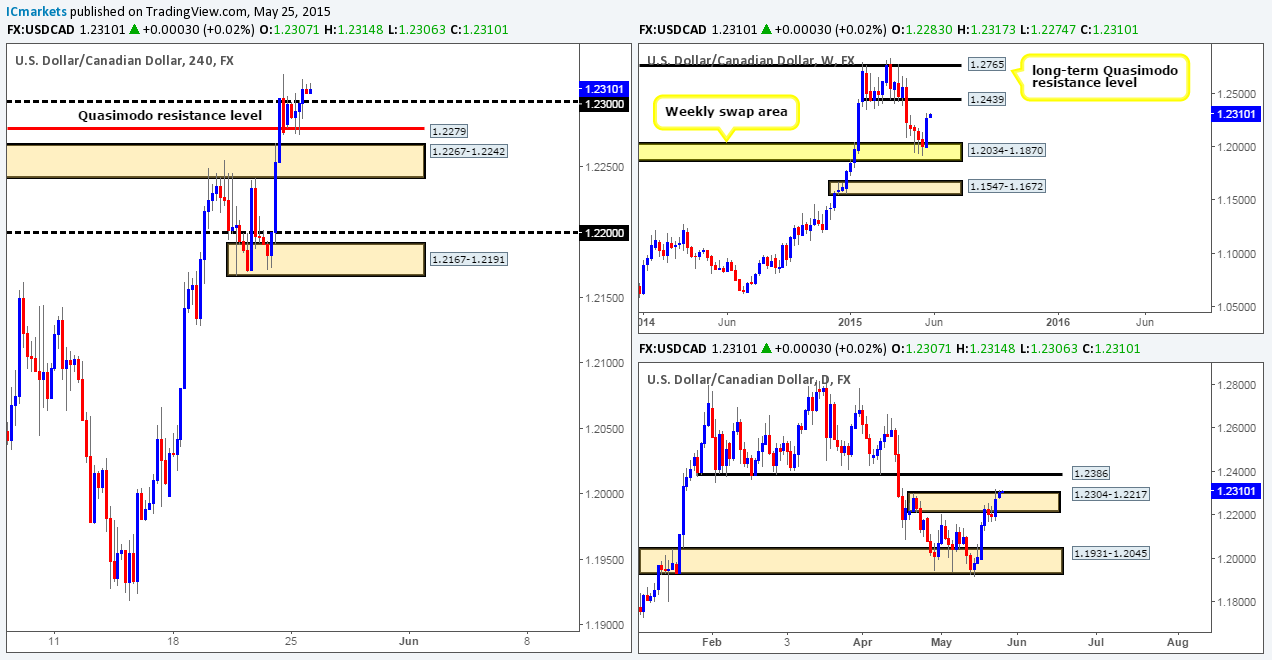
Weekly view: Last week’s movement saw the USD/CAD pair rocket north from a weekly swap area set at 1.2034-1.1870, taking back any losses seen during the previous month. In the event that the buyers can continue with this tempo, we’ll likely see price attack the weekly swap level seen above at 1.2439 sometime this week.
Daily view: From the daily timeframe, we can see that price has recently pierced above a daily supply area seen at 1.2304-1.2217. This move, in our opinion, has potentially opened the gates for a continuation move north towards the very obvious daily swap level coming in at 1.2386.
4hr view: Amid yesterday’s sessions on the 4hr scale, price retested the recently broken 4hr Quasimodo level at 1.2279 and rallied north, consequently forcing price to close above 1.2300. Providing that the buyers can hold out above this number today, we see very little (other than the mid-level number 1.2350) resistance on the 4hr timeframe until price reaches the daily swap level mentioned above at 1.2386.
That being the case, if 1.2300 is retested as support, our team would then begin watching for lower timeframe support to hold firm and stabilize price action. Assuming that we find a lower timeframe entry here with a stop loss no bigger than 15 pips, the risk/reward would be absolutely fantastic if price rallies to greet the aforementioned daily swap level.
Levels to watch/ live orders:
- Buys: 1.2300 [Tentative – confirmation required] (Predicative stop-loss orders seen at: dependent on where one finds confirmation).
- Sells: Flat (Predicative stop-loss orders seen at: N/A).
USD/CHF:
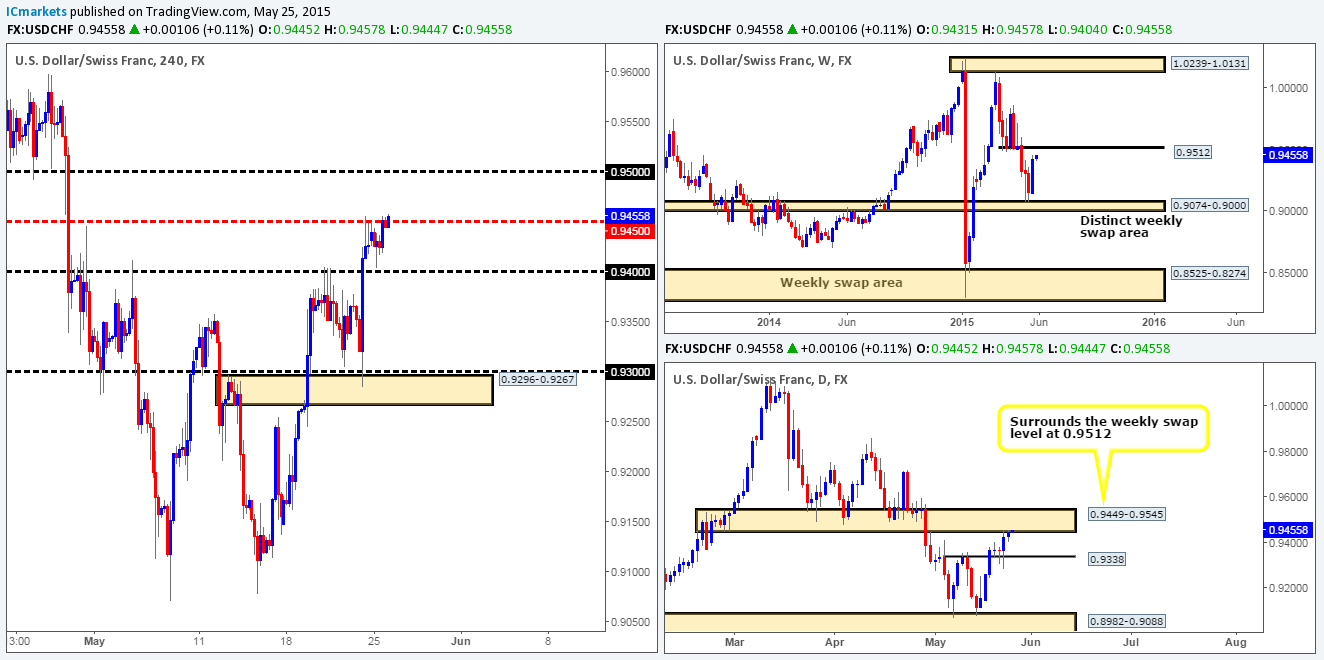
Weekly view: Following the rebound seen from the weekly swap area 0.9074-0.9000, price extended higher last week resulting in the market closing only 85 pips below a weekly swap level seen at 0.9512.
Daily view: The daily timeframe shows that price continues to tease the underside of a daily swap area seen at 0.9449-0.9545, which, if you look back to the weekly timeframe, you’ll notice that this zone surrounds the aforementioned weekly swap level.
4hr view: Throughout yesterday’s sessions, an attempt to retest the round number 0.9400 was seen, falling short by around five or so pips. This move clearly caught the attention of buyers as price rallied from here up to the mid-level hurdle 0.9450.
Should the market close above this mid-level number, there is a strong possibility that we may see a fifty-pip rally towards 0.9500. This may seem a little unbalanced considering price is trading around an area of daily supply at the moment (see above), but as per the weekly timeframe, there is a clear void for price to move north up to the weekly swap level 0.9512. And as most would probably agree here, the higher timeframes usually take precedence over the lower.
With everything taken into consideration, our team has come to a general consensus that if price closes above 0.9450 and respects this number as support today, we intend to look for confirmed (lower timeframe) buys, targeting 0.9500. From this move, we expect at least a risk/reward of 2:0, so if we cannot find an entry long here with a twenty-pip stop loss or less, there will be no trade.
Levels to watch/ live orders:
- Buys: Flat (Predicative stop-loss orders seen at: N/A).
- Sells: Flat (Predicative stop-loss orders seen at: N/A).
US 30:
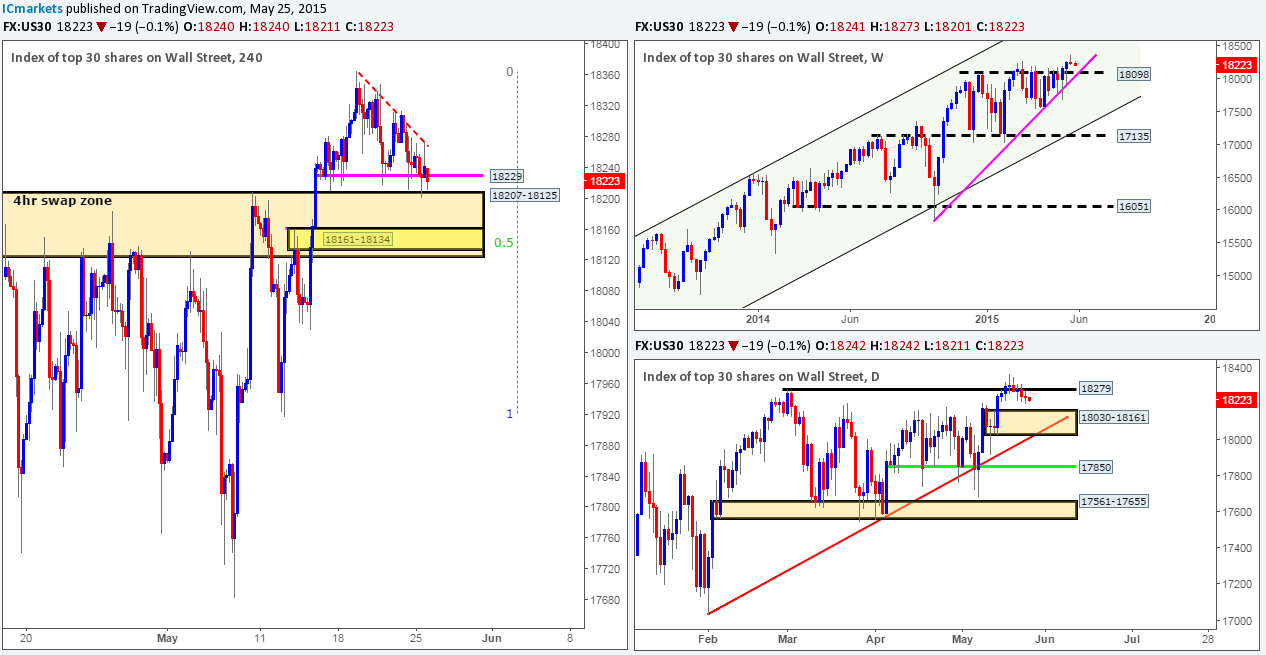
Weekly view: Last week’s action formed a very tidy bearish pin-bar candle going into the close. Does this mean we should begin looking to short this market? Well, considering that the DOW is still overall trending north and there is a potential weekly support area looming just below it at 18098, we would say no. However, let’s take a look at the lower timeframes to see what they have to say first…
Daily view: From this angle, we can see that there is indeed a little room for this market to move south down towards daily demand seen at 18030-18161 (surrounds the aforementioned weekly support area), which, as you can see, also converges just beautifully with a daily trendline extended from the low 17033.
4hr view: The 4hr timeframe shows that price is once again attacking the 4hr support level seen at 18229, which appears very weak at this point in time. As such, once liquidity picks up today, we’re anticipating a strong break below this hurdle, where at which point the path south should be clear for further downside towards the 4hr swap area marked in yellow at 18161-18134. This area, as you can probably see, not only boasts additional support from the 50% Fibonacci retracement number, but is also located deep within a larger 4hr swap area seen at 18207-18125, which is supported by a daily demand zone mentioned above at 18030-18161.
Therefore, given the points made above, we do not see any opportunity to trade at this present time. If price reaches the 4hr swap area at 18161-18134 today, we’ll then begin watching for lower timeframe buying confirmation here. First take-profit target will obviously be dependent on how price approaches this 4hr zone.
Levels to watch/ live orders:
- Buys: 18161-18134 [Tentative – confirmation required] (Predicative stop-loss orders seen at: 18128).
- Sells: Flat (Predicative stop-loss orders seen at: N/A).
XAU/USD (Gold)
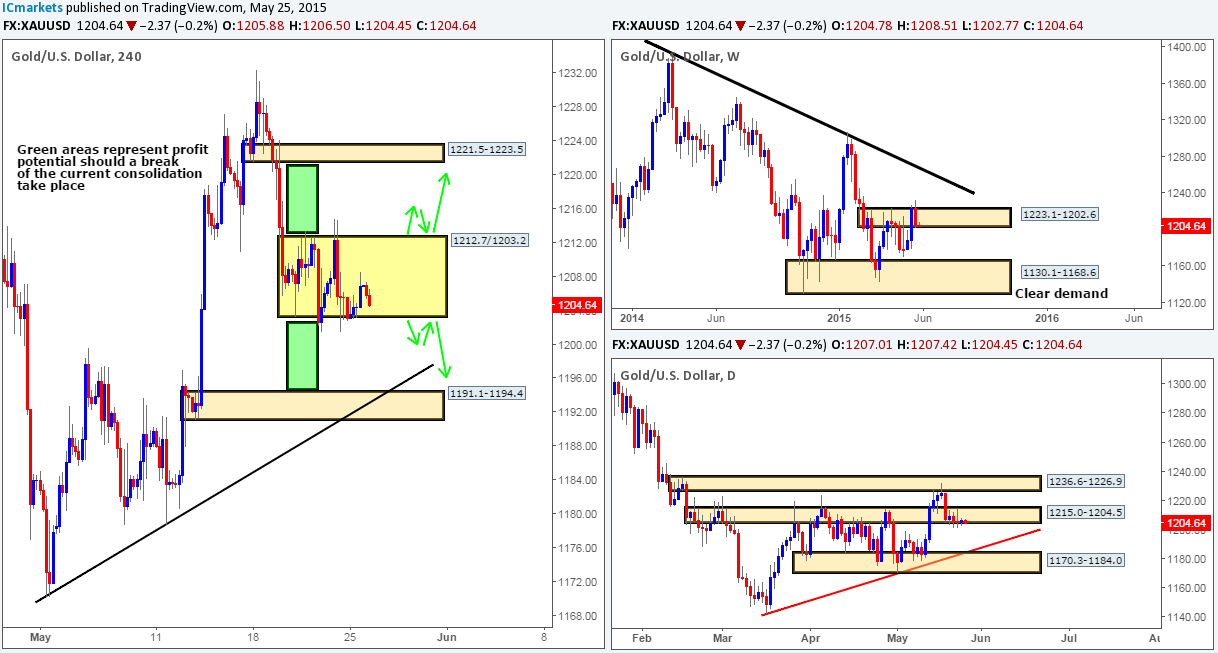
Weekly view: Following the break above the weekly supply at 1223.1-1202.6 last week, the gold market sold off taking back 50% of the prior week’s gains. Assuming that the sellers continue to show strength this week, we may see price challenge the swing low 1170.3, or even the weekly demand area seen just below it at 1130.1-1168.6.
Daily view: Over the past few days, we have been seeing the buyers struggle to maintain a position within the daily swap area seen at 1215.0-1204.5. In the case that this zone is engulfed this week, this could set the stage for a continuation move south down towards a daily buy zone at 1170.3-1184.0, which boasts additional support from a daily trendline extended from the low 1142.5.
4hr view: From this viewpoint, it appears that the 4hr scale has entered into a phase of consolidation between 1212.7 and 1203.2. Trading the limits of this range is certainly a viable strategy in our opinion. However, we would highly recommend waiting for the lower timeframes to confirm buying/selling strength exists at the range limit before risking capital, since fakeouts are a common occurrence within range bound markets such as this.
Ultimately, our team is watching for this consolidation to be violated since there is room for price to move a considerable amount up/down to the next area of interest. The green areas represent the distance we believe price will travel following a convincing break. That being said though, we have absolutely no intention in buying or selling any breakout unless price retests the limit barrier (as per the green arrows), and shows some form of lower timeframe confirming price action.
Levels to watch/ live orders:
- Buys: 1203.2 [Tentative – confirmation required] (Predicative stop-loss orders seen at: dependent on where one confirms the range limit).
- Sells: 1212.7 [Tentative – confirmation required] (Predicative stop-loss orders seen at: dependent on where one confirms the range limit).