
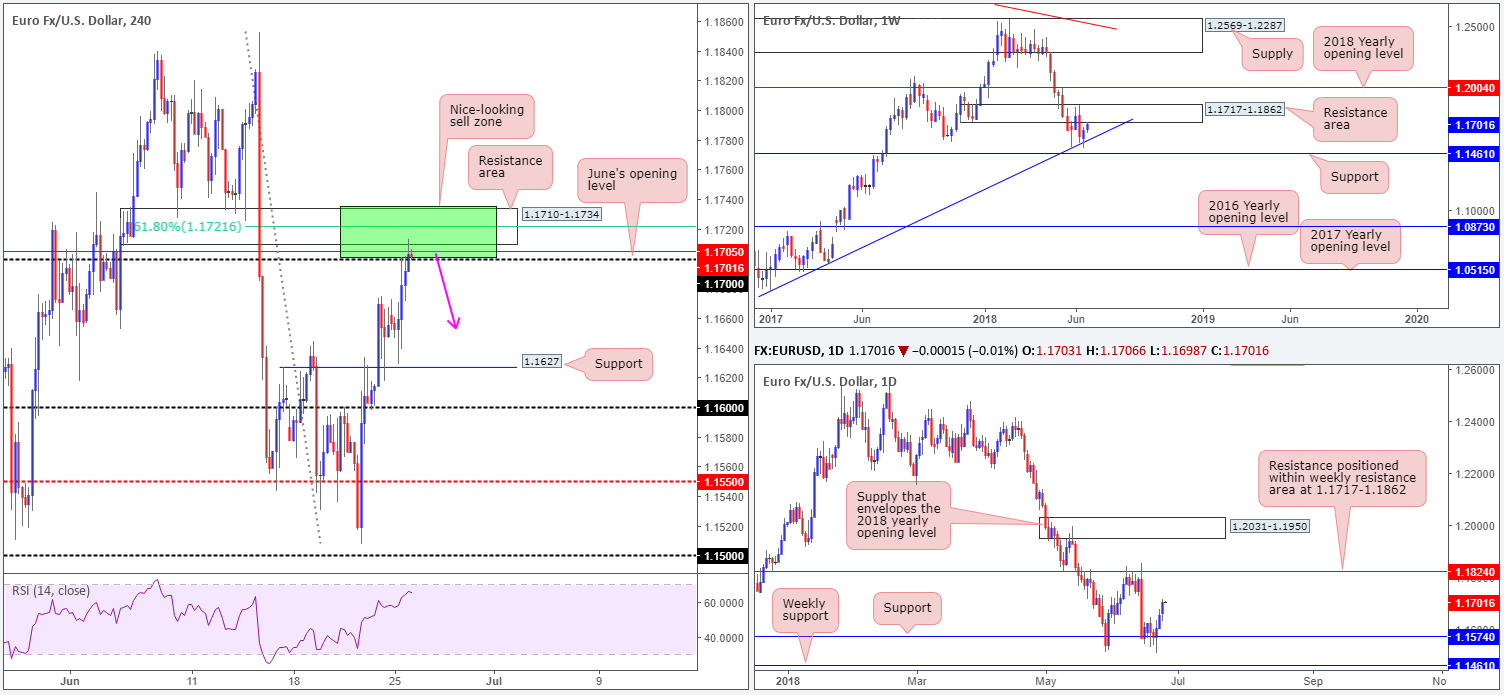
EUR/USD:
The shared currency decorated the H4 timeframe with a series of bullish candles on Monday, following a near-touch of support at 1.1627. Price action climbed back above the 1.17 handle – the first time since the ECB’s policy meeting in mid-June – largely as a result of a descending USD.
A bare economic calendar forced the spotlight on Trump’s trade policies yesterday, weighing on the dollar and bringing about a hefty decline in both European and US stock markets.
Shifting over to the technicals, 1.17 (as highlighted in Monday’s report) remains a level of interest, due to the number’s close association with nearby structure:
- June’s opening level at 1.1705.
- 61.8% H4 Fib resistance value at 1.1721.
- H4 resistance area at 1.1710-1.1734 which houses the lower edge of the weekly resistance area within at 1.1717-1.1862.
Areas of consideration:
Given noted factors, the sell zone between 1.1734/1.17 (green zone on the H4 timeframe) is strong enough for a market sell (without the need for additional candle confirmation) today, with stops plotted above 1.1734 and the initial take-profit area sited around the 1.1627 H4 support level mentioned above.
We are aware that the daily scale shows room to punch as high as daily resistance at 1.1824, but considering there’s a weekly area involved within the H4 sell zone, shorts remain high probability, in our view.
Today’s data points: US CB consumer confidence; FOMC member Bostic speaks.
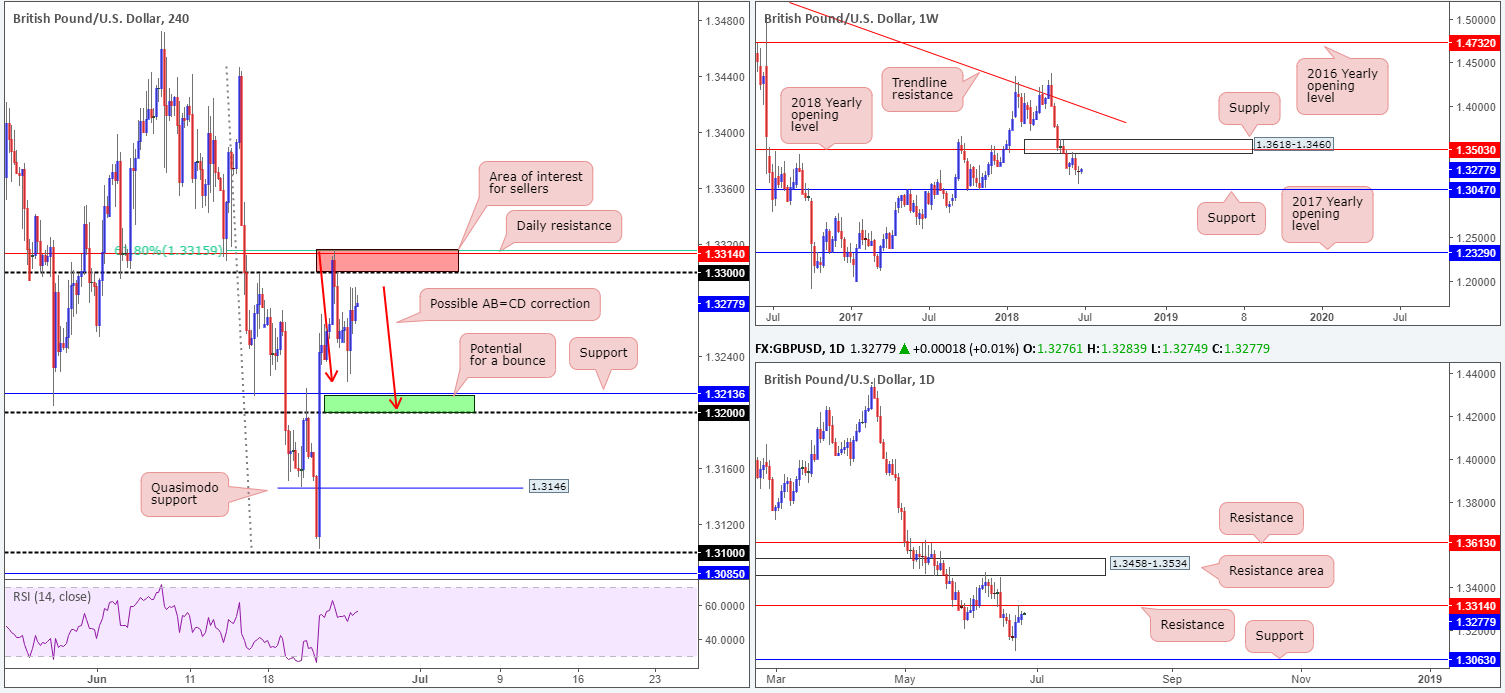
GBP/USD:
Amid early European hours on Monday the British pound came under pressure, clocking a session low of 1.3221. Broad-based USD weakness, however, supported the currency from this point, lifting the market to a session high of 1.3289. Those who were short from the 1.3315/1.33 red zone drawn on the H4 chart should now be flat with a respectable gain, based on the recommendation to cash in partial profit and reduce risk in Monday’s analysis. Well done you!
Areas of consideration:
1.3315/1.33 still remains a point of interest, due to the areas structure:
- 1.33 handle.
- 61.8% H4 Fib resistance value at 1.3315.
- Daily resistance at 1.3314.
Aside from the aforementioned H4 sell zone, traders may want to continue watching the 1.32/1.3213 buy zone marked in green on the H4 timeframe. Thanks to yesterday’s movement, this area also now aligns beautifully with a H4 AB=CD correction (red arrows).
Today’s data points: MPC members Haskel and McCafferty speak; US CB consumer confidence; FOMC member Bostic speaks.
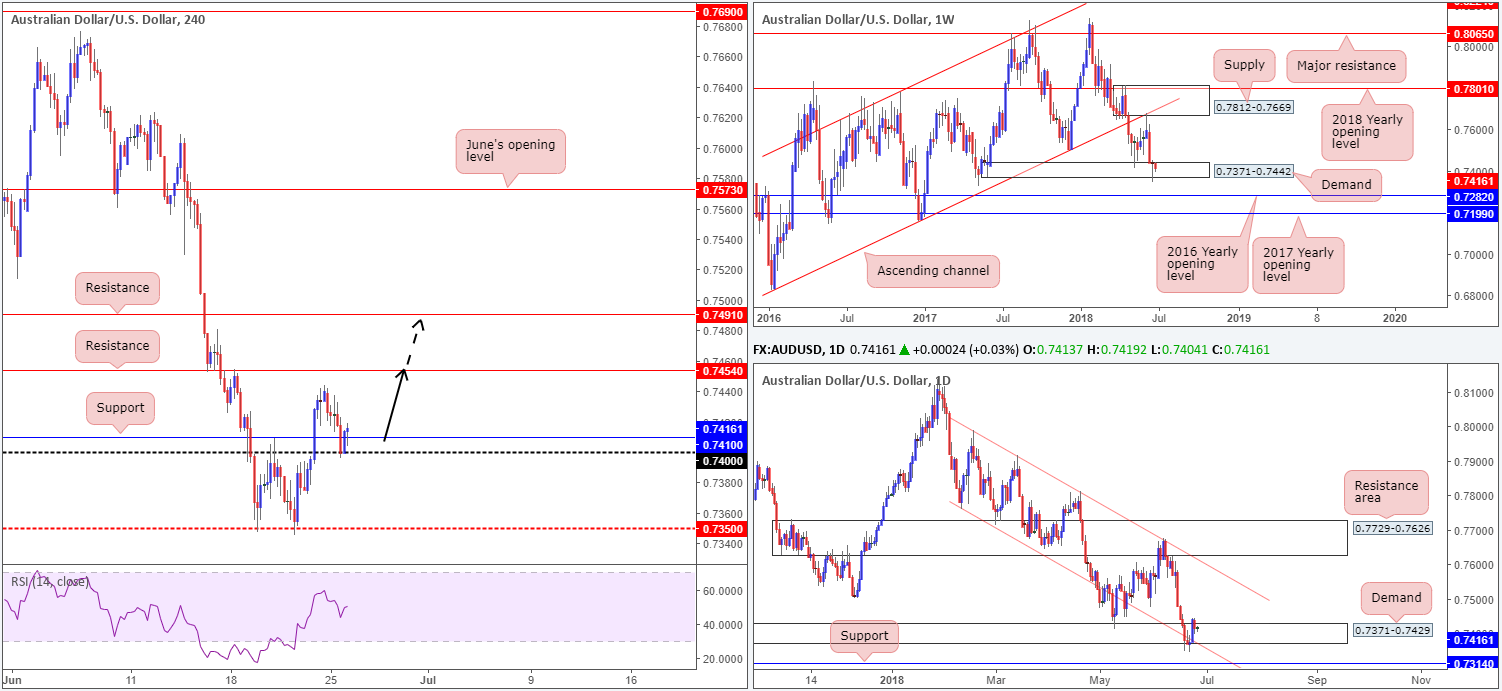
AUD/USD:
Weighed down by lower equity prices, the commodity currency momentarily surpassed H4 support at 0.7410 and tested the nearby 0.74 handle during Monday’s segment. As is evident from the H4 timeframe, price responded from 0.74 in the shape of a full-bodied H4 bull candle and closed back above the noted support. Those who read Monday’s briefing may recall that this was a noted move to watch for. The H4 bullish candle, nevertheless, is a bonus!
Areas of consideration:
Alongside signs of buying strength on the H4 scale, we can also see both weekly and daily price trading from areas of demand. The weekly zone falls in at 0.7371-0.7442 and daily demand at 0.7371-0.7429 (plotted within the lower limit of the aforementioned weekly demand area). Note on the daily scale there’s additional confluence seen at this zone in the form of a daily channel support taken from the low 0.7758.
According to the technicals, a long at current price (H4) is valid. Stop-loss orders are best placed beyond the 0.74 line, with upside targets seen at the H4 resistance level 0.7454, and eventually up to H4 resistance at 0.7491.
Bear in mind, though, that due to where we are coming from on the higher timeframes, price could potentially drive much higher than the noted H4 levels.
Today’s data points: US CB consumer confidence; FOMC member Bostic speaks.
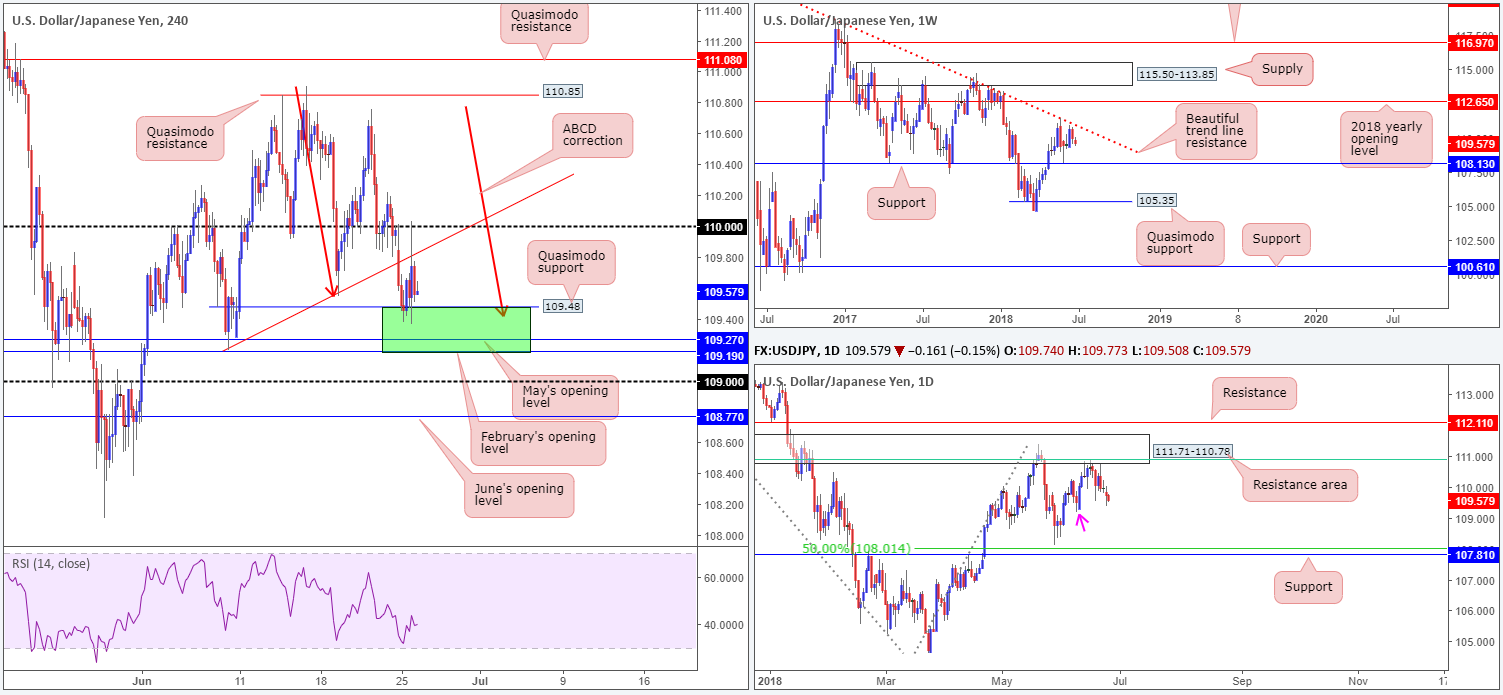
USD/JPY:
For those who read Monday’s report you may remember the team highlighting a potential H4 buy zone marked in green at at 109.19/109.48 – consisting of February and May’s opening levels, a H4 Quasimodo support and a H4 ABCD correction (red arrows). As you can see, the unit sold off in early trade and connected with this area. Although some hesitation was initially seen, buyers eventually entered the market and brought price action to highs of 110.03. The move north, nonetheless, was short-lived. Price failed to sustain gains beyond the 110 handle and a nearby H4 trend line support-turned resistance (taken from the low 109.20).
In terms of weekly price action, there has been little change in structure. The pair remains compressing between a weekly trend line resistance taken from the high 123.67, and a weekly support level pencilled in at 108.13. Outside of these areas, traders likely have their crosshairs fixed on the 2018 yearly opening level at 112.65 and a weekly Quasimodo support priced in at 105.35. Meanwhile, down on the daily timeframe, the 61.8% daily Fib resistance value at 110.91 (green line) is proving a difficult barrier to overcome. This could be due to the level being housed within the limits of a daily resistance area coming in at 111.71-110.78, which has significant history dating back to early August 2017. It may also pay to pencil in the daily resistance level parked just above this area at 112.11, should the buyers regain control. The next downside target on this scale, on the other hand, can be seen at June 8 lows drawn from 109.19 (pink arrow).
Areas of consideration:
As of now, H4 action is somewhat restricted between the noted 110 handle/H4 trend line resistance and H4 buy zone painted in green at 109.19/109.48.
Aside from the above, H4 movement could possibly dive lower today and challenge the lower edge of the current H4 buy zone. Owing to how close the 109 handle is, though, we would strongly recommend waiting and seeing if H4 price can print a full or near-full-bodied bull candle before pulling the trigger, helping avoid a possible whipsaw/fakeout to 109.
Today’s data points: US CB consumer confidence; FOMC member Bostic speaks.
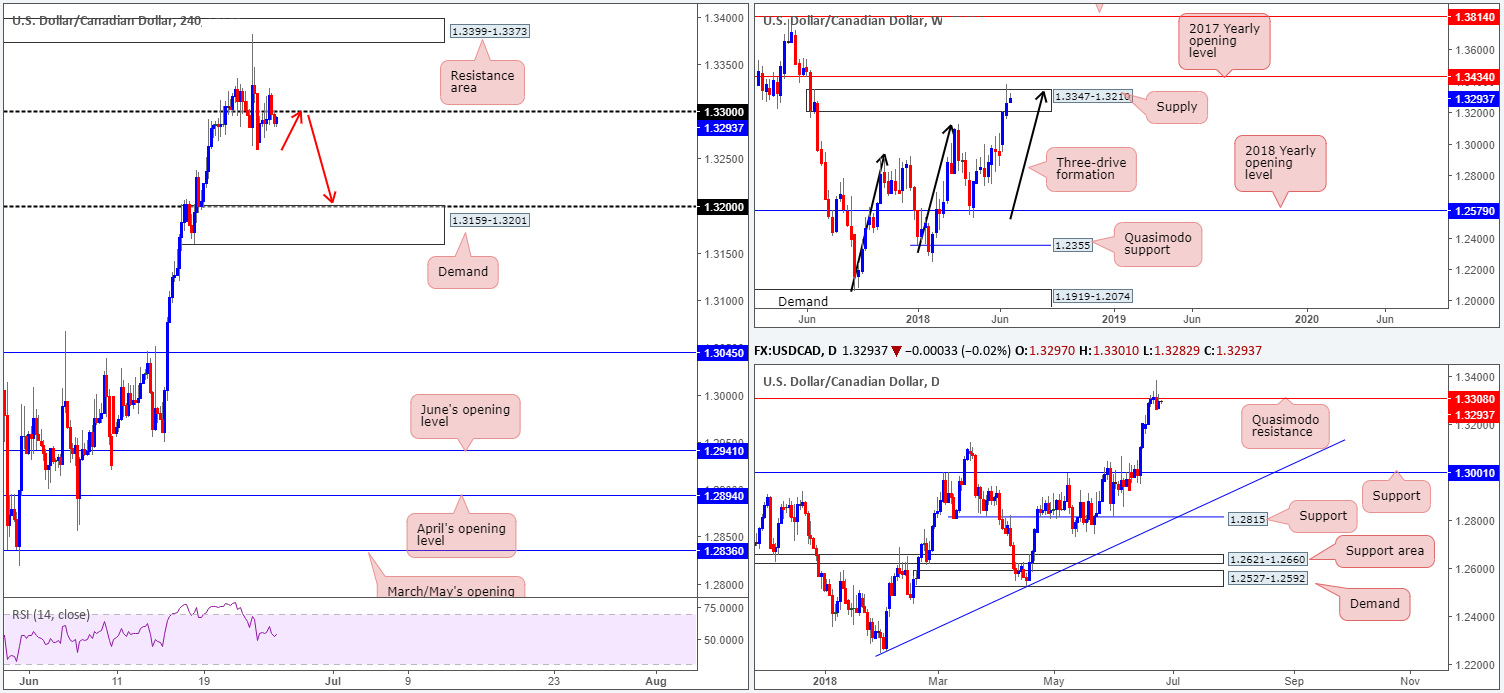
USD/CAD:
As can be seen on the H4 chart this morning, the US dollar rose modestly against its Canadian counterpart on Monday. However, although H4 price reclaimed the 1.33 handle to the upside, the pair failed to advance beyond highs of 1.3324, consequently mildly paring gains and closing marginally back beneath 1.33 into the close.
As a result of recent movement, our outlook remains unchanged. All three timeframes we watch show signs of selling strength. Weekly price recently whipsawed through the top edge of a weekly supply area at 1.3347-1.3210, and, in all probability, completed a three-drive approach (see black arrows). By and of itself, this could guide the pair lower this week. Bolstering weekly structure is also a daily Quasimodo resistance level priced in at 1.3308. Although the level endured a rather savage whipsaw to weekly highs last week, the barrier remains intact. In the case that the market continues to probe lower from here this week, we do not expect much buying interest to be seen until reaching daily support plastered in at 1.3001.
Areas of consideration:
In view of the above, a retest to the underside of 1.33 today that’s followed up with an adequate H4 bearish close would, according to the technicals, be a high-probability short, targeting H4 demand at 1.3159-1.3201 as an initial take-profit zone.
Today’s data points: US CB consumer confidence; FOMC member Bostic speaks.
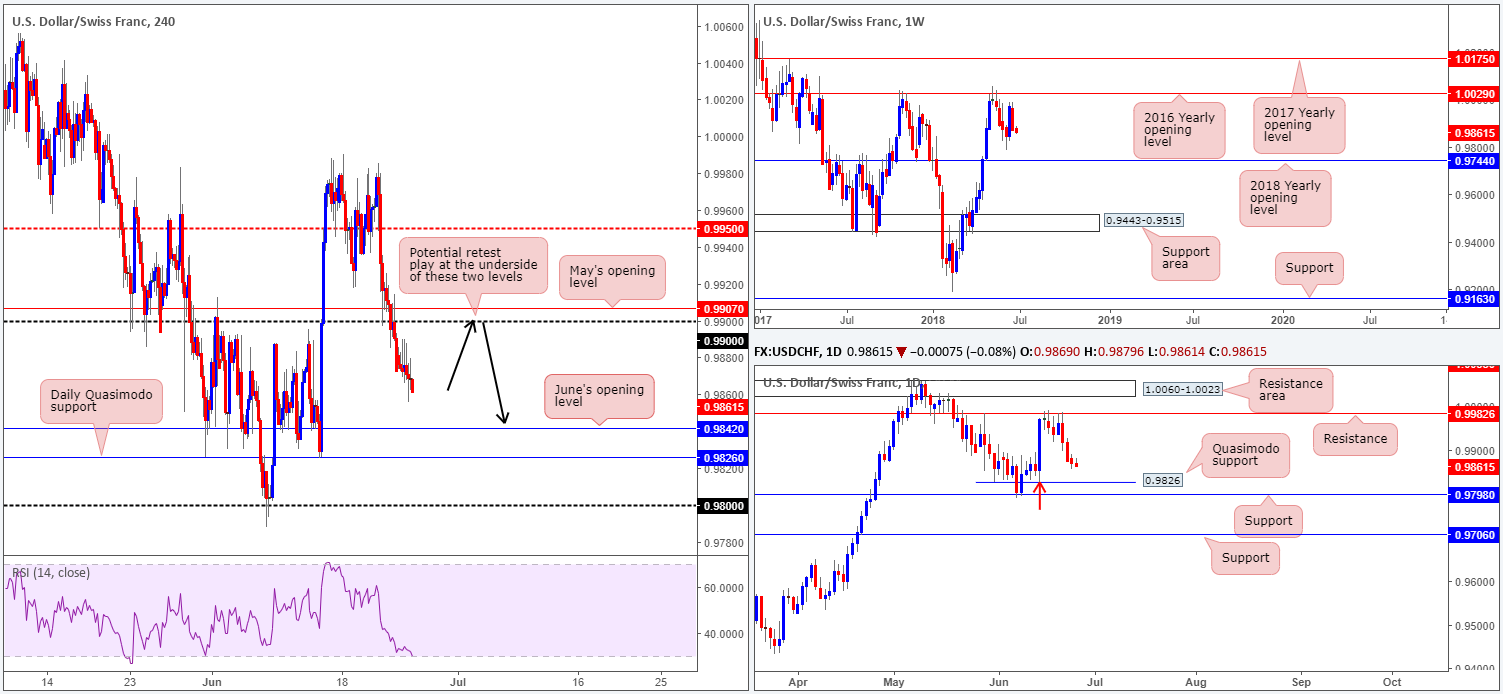
USD/CHF:
As the US dollar index retreats from its fresh 2018 peak of 95.53, the USD/CHF market penciled in its third consecutive daily loss on Monday, touching session lows of 0.9856. With the 0.99 handle now a distant memory as support on the H4 timeframe, the underside of this psychological band remains of interest as resistance. As does its closely associated resistance in the form of May’s opening level at 0.9907.
Turning the focus on the bigger picture, weekly price erased the majority of the prior week’s gains last week and closed in the shape of a near-full-bodied weekly bearish candle. Assuming we have some continuation to the downside from here, the next objective can be seen at 0.9744: the 2018 yearly opening level. Elsewhere, daily movement established strong resistance off the 0.9982 barrier during last week’s sessions, printing strong selling candles on Thursday and Friday. From this point, we see possible buying interest forming off a nearby Quasimodo support at 0.9826, shadowed closely by daily support coming in at 0.9798. To our way of seeing things, we feel the latter area is the more likely zone to receive a response from the buyers, due to the Quasimodo support already being tested on departure (marked with a red arrow).
Areas of consideration:
According to all three timeframes, each is suggesting that the sellers are in control of things at the moment. And as such, the team has noted to keep an eyeball on the underside of the 0.99/0.9907, for a possible retest play. A retest to the underside of 0.9907/0.99, followed up with a H4 full or near-full bodied bearish candle is, in our humble opinion, enough to begin considering a sell in this market, targeting June’s opening level at 0.9842 and the nearby daily Quasimodo support mentioned above at 0.9826. Ultimately, though, the daily support highlighted above at 0.9798, which essentially denotes the 0.98 handle on the H4 scale, can be considered the final take-profit zone.
Today’s data points: US CB consumer confidence; FOMC member Bostic speaks.
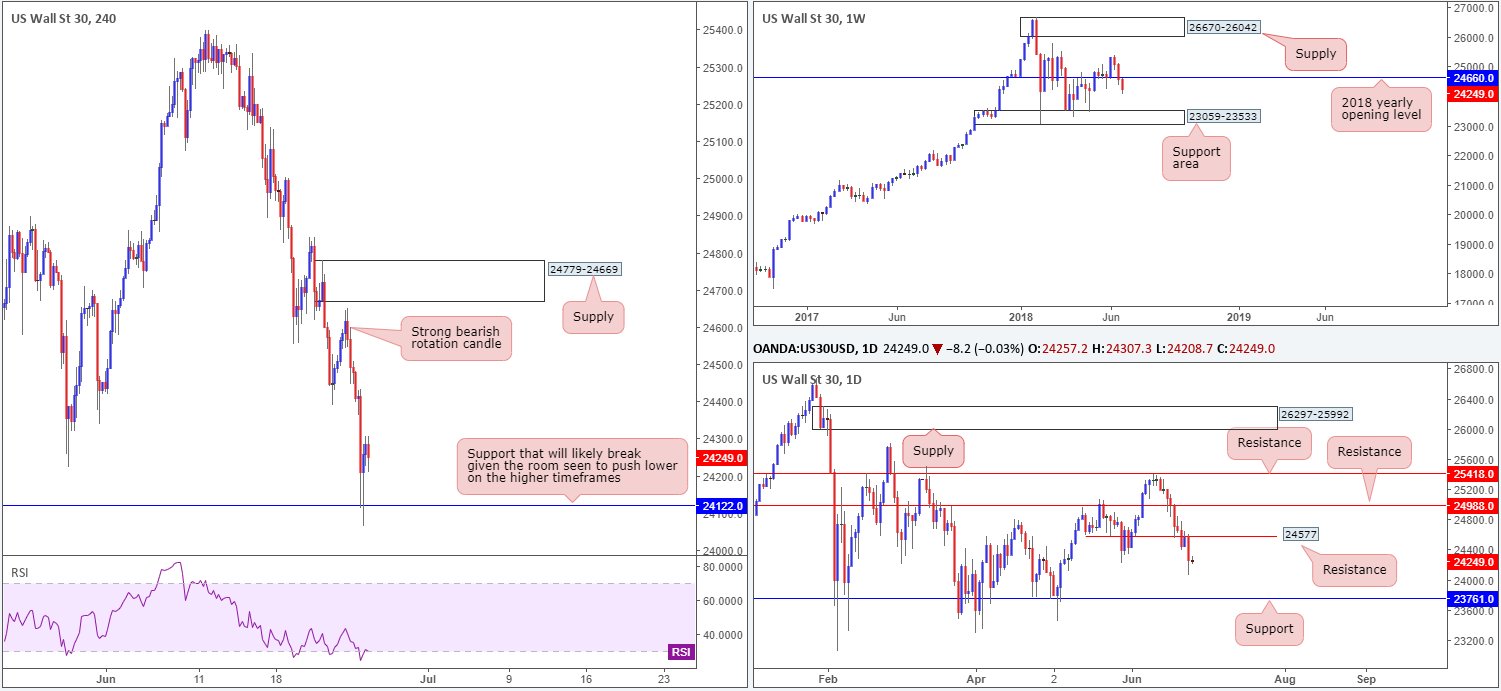
Dow Jones Industrial Average:
US equities came under pressure on Monday amid political developments out of the US regarding trade.
In Monday’s analysis, the team highlighted a possible move to the downside after witnessing a near-full-bodied H4 candle (labelled as a rotation candle on the chart) print off the underside of the daily resistance level at 24577 at Friday’s close. As is shown on the H4 timeframe, the move played out as expected, so well done to any of our readers who managed to jump aboard here, as it was a humongous move!
Consequent to this, weekly action now shows room to press as far south as the support area at 23059-23533, and daily price to as low as support coming in at 23761. H4 flows, however, mildly pared losses amid US hours off H4 support at 24122. A break of this level would likely clear the river south for a move down to aforementioned daily support level.
Areas of consideration:
On account of yesterday’s selling, as well as where the index is positioned on the higher timeframes, further downside is possible. That being the case, watch for a H4 close beneath the current H4 support that’s followed up with a strong retest as resistance for potential shorts, targeting the aforementioned daily support.
Today’s data points: Limited.
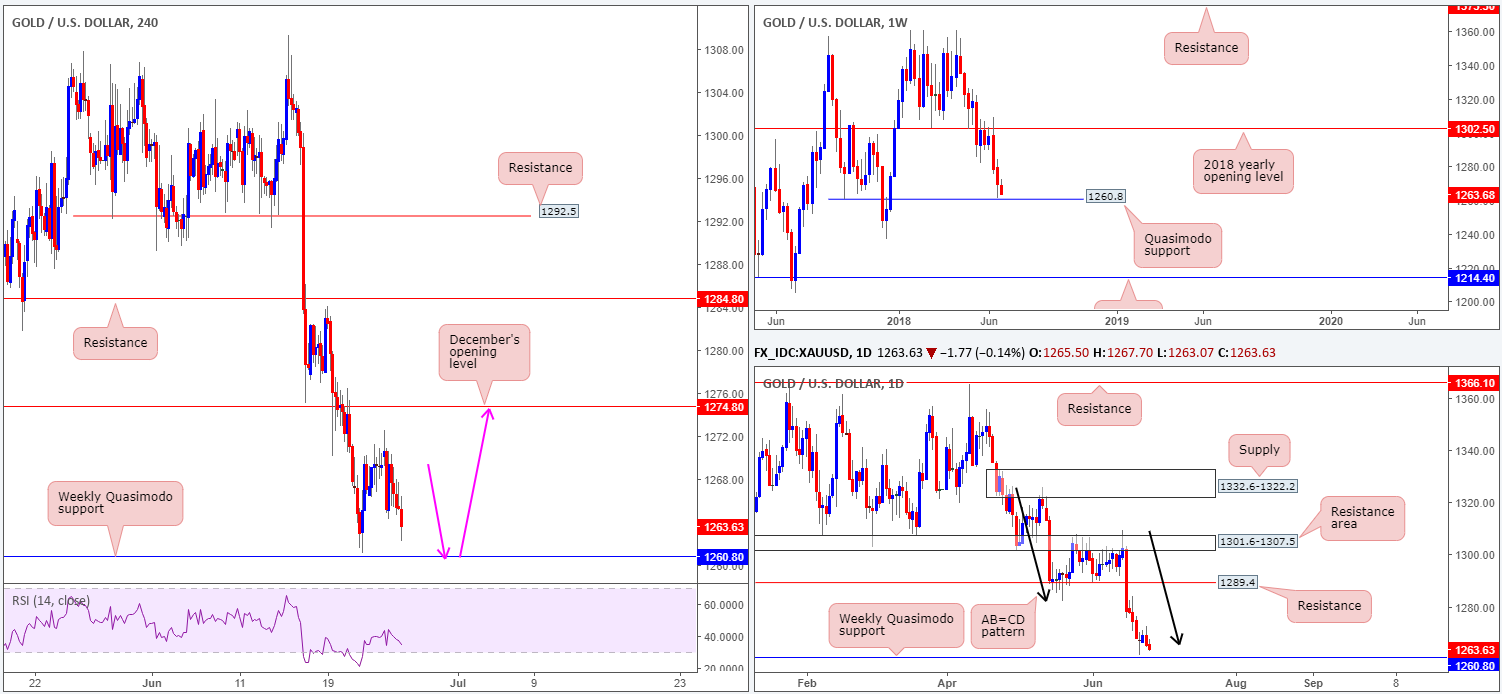
XAU/USD (Gold)
Demand for the safe-haven yellow metal was somewhat weak on Monday, despite both European and US stock markets plunging lower on Trump’s trade policies.
Ignoring the fundamentals for a moment, though, the technical picture appears to be setting up for an advance.
Starting from the top, bullion is seen hovering within striking distance of a notable weekly Quasimodo support at 1260.8. A closer look at price action on the daily timeframe shows the daily candles trading nearby a recently completed AB=CD formation (black arrows) at 1265.6, planted just ahead of the aforementioned weekly Quasimodo barrier.
Over on the H4 timeframe, we still have little to shout about in terms of market structure on this timeframe as focus remains on the weekly Quasimodo support at the moment. What we do see, nevertheless, is December’s opening level at 1274.8 as a viable upside target, which, as you can see, was respected as resistance last week.
Areas of consideration:
Ultimately, what we’re looking for is a test of the noted weekly Quasimodo support (pink arrows) that’s bolstered by H4 price action: a full or near-full-bodied bull candle. This – coupled with the daily AB=CD formation in play – would, in our view, be considered a high-probability trade long, targeting December’s opening level mentioned above at 1274.8 as the initial take-profit zone.
The use of the site is agreement that the site is for informational and educational purposes only and does not constitute advice in any form in the furtherance of any trade or trading decisions.
The accuracy, completeness and timeliness of the information contained on this site cannot be guaranteed. IC Markets does not warranty, guarantee or make any representations, or assume any liability with regard to financial results based on the use of the information in the site.
News, views, opinions, recommendations and other information obtained from sources outside of www.icmarkets.com.au, used in this site are believed to be reliable, but we cannot guarantee their accuracy or completeness. All such information is subject to change at any time without notice. IC Markets assumes no responsibility for the content of any linked site. The fact that such links may exist does not indicate approval or endorsement of any material contained on any linked site.
IC Markets is not liable for any harm caused by the transmission, through accessing the services or information on this site, of a computer virus, or other computer code or programming device that might be used to access, delete, damage, disable, disrupt or otherwise impede in any manner, the operation of the site or of any user’s software, hardware, data or property.


