
A note on lower timeframe confirming price action…
Waiting for lower timeframe confirmation is our main tool to confirm strength within higher timeframe zones, and has really been the key to our trading success. It takes a little time to understand the subtle nuances, however, as each trade is never the same, but once you master the rhythm so to speak, you will be saved from countless unnecessary losing trades. The following is a list of what we look for:
- A break/retest of supply or demand dependent on which way you’re trading.
- A trendline break/retest.
- Buying/selling tails/wicks – essentially we look for a cluster of very obvious spikes off of lower timeframe support and resistance levels within the higher timeframe zone.
- Candlestick patterns. We tend to only stick with pin bars and engulfing bars as these have proven to be the most effective.
We search for lower timeframe confirmation between the M15 the H1 timeframes, since most of our higher-timeframe areas begin with the H4. Stops are usually placed 5-10 pips beyond confirming structures.
EUR/USD:
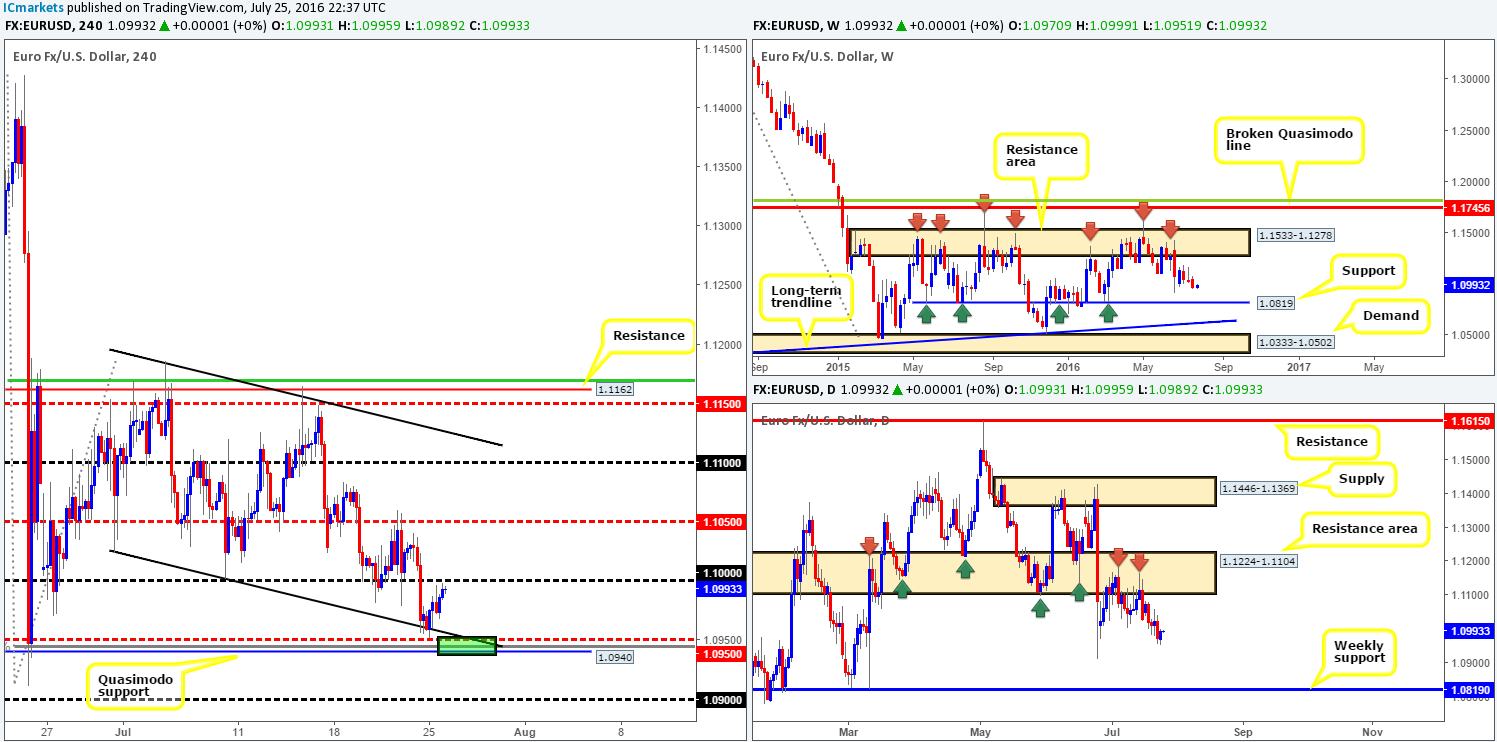
Boosted by stronger than expected German IFO data, the single currency saw a modest recovery yesterday off the H4 channel support extended from the high1.1124. This, as you can see, brought the pair up to within striking distance of the key figure 1.30 by the close. Technically speaking, we’d be surprised to see the H4 close above this number today. The reason being is weekly action shows little support in the market stopping price from reaching a long-term weekly support level coming in at 1.0819. Furthermore, down on the daily chart, apart from the referendum low seen at 1.0911, there’s also little support stopping price from connecting with the aforementioned weekly support level.
By and large, we believe this market is likely to end the week in the red. Despite this, as we mentioned in Monday’s report, a bounce from the H4 Quasimodo line at 1.0940 (backed by a deep H4 88.6% Fib retracement level at 1.0945 and a H4 mid-way support at 1.0950) will likely take place.
Our suggestions: Watch for a lower timeframe buy entry (see the top of this report) around the 1.0940/1.0950 H4 zone (green area) today. As we said before, should this area be tagged the most we see this market bouncing to is the 1.10 handle. Therefore, this would be our final take-profit target, so a relatively tight stop loss is required to ensure risk/reward remains in our favor.
Levels to watch/live orders:
- Buys: 1.0940/1.0950 [Tentative – confirmation required] (Stop loss: dependent on where one confirms this area).
- Sells: Flat (Stop loss: N/A).
GBP/USD:
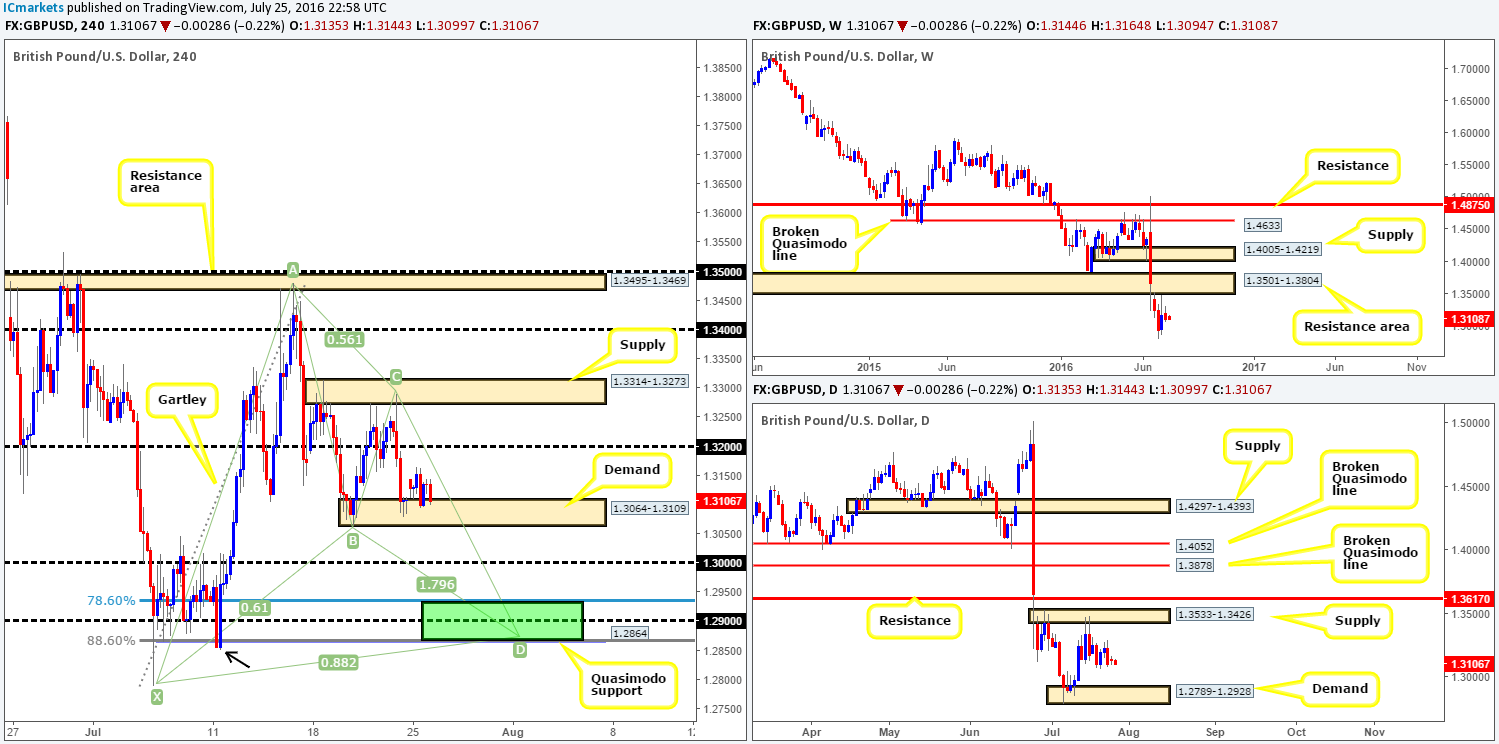
During the course of yesterday’s trading, the pair took on a more sober tone in comparison to Friday’s action. Cable, as can be seen from the H4 chart, remained afloat above a H4 demand base drawn from 1.3064-1.3109, ranging seventy pips on the day. Thanks to this somewhat lackluster performance, much of the following analysis will echo similar thoughts put forward in Monday’s report…
Our prime focus remains on the green zone today at 1.2868/1.2929, which comprises of a H4 harmonic Gartley reversal zone, a 1.29 handle, a H4 Quasimodo support line at 1.2864 and also a supporting daily demand area at 1.2789-1.2928.
Although there is a strong possibility that the GBP could head lower according to the weekly chart (to the downside we see little support to the left of current price until the market reaches the 1.20 region [we had revisit 1986 to find this]), we feel that this H4 harmonic zone will produce a decent-sized bounce given its merging structures!
Our suggestions: Our team remains confident in the H4 harmonic zone mentioned above, so a pending buy order has been placed at 1.2940. Now, in regard to stops we see the following: aggressive traders could place stops below the H4 Quasimodo low marked with a black arrow at 1.2847, or for the more conservative trader, the stop might be best placed below the X point of the H4 harmonic pattern at 1.2789. In that the bounce could be short lived here, we have opted for the more aggressive stop loss in this case.
Levels to watch/live orders:
- Buys: 1.2940 [Pending order] (Stop loss: 1.2847).
- Sells: Flat (Stop loss: N/A).
AUD/USD:
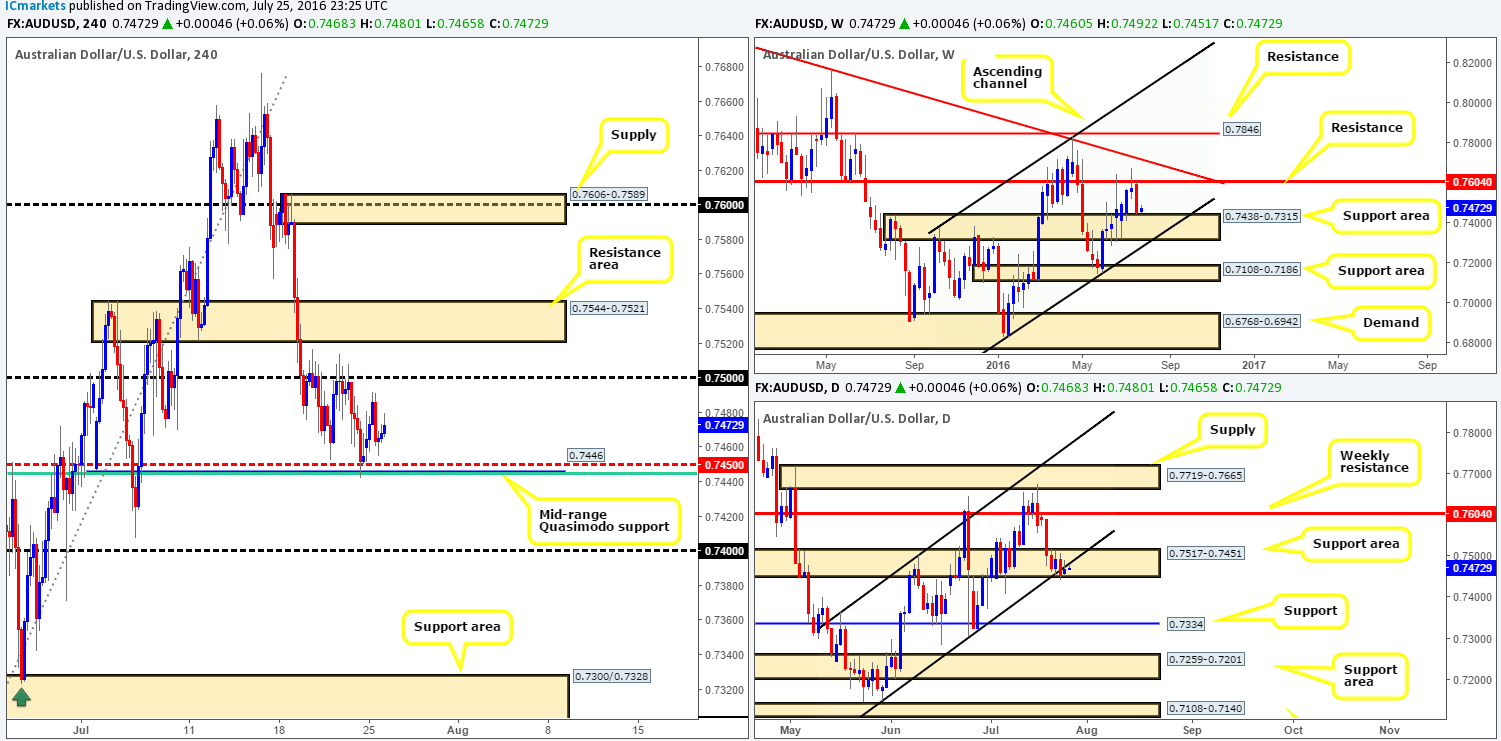
In our previous report, we noted that the recently closed weekly candle came within four pips of connecting with the top-side of a weekly support area registered at 0.7438-0.7315. As things stand on the daily chart, however, the major ended the week closing below a daily channel support line extended from the low 0.7148, but was able to remain within the daily support area coming in at 0.7517-0.7451. The bulls did make an attempt to close back within the daily channel yesterday but was quickly rejected. Therefore, much the same as in yesterday’s report, until price either closes below the aforementioned daily support area or closes back within the above said daily channel, we have little direction coming in from this timeframe.
Turning our attention to the H4 chart, we can see that the Aussie held firm around the mid-range H4 Quasimodo support at 0.7446 (backed by a H4 61.8% Fib support at 0.7444 and a H4 mid-way support level 0.7450). Given the reaction seen from this area, an advance up to at least the 0.75 handle is still likely on the cards today.
Our suggestions: Until we see a decisive daily close, we’re going to remain flat in this market. Granted, one could estimate that weekly action will push prices higher from here, but given that the market respected the underside of the recently broken daily channel yesterday, further selling is now a possibility too, hence us recommending remaining flat.
Levels to watch/live orders:
- Buys: Flat (Stop loss: N/A).
- Sells: Flat (Stop loss: N/A).
USDJPY:
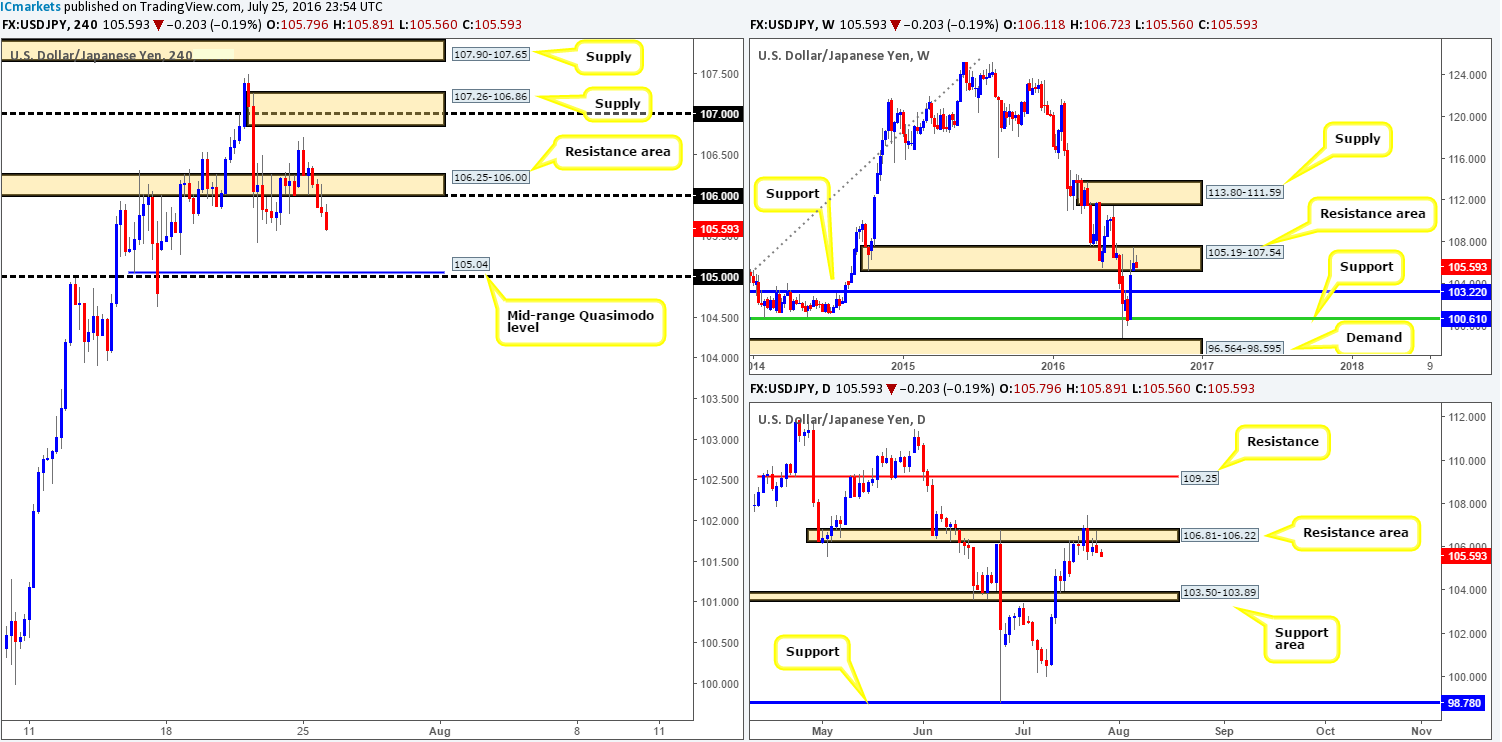
Going into the early hours of yesterday morning, the USD/JPY topped out just ahead of a H4 supply at 107.26-106.86. The sell off from here forced prices to close below the H4 support area at 106.25-106.00, which, as we mentioned in Monday’s report, would likely open the path south down to 105.04 – a mid-range H4 Quasimodo support, followed closely by the 105 handle.
With weekly price occupying a weekly resistance area seen at 105.19-107.54, and daily trade responding beautifully to a daily resistance area at 106.81-106.22, our team was confident enough to enter short at 105.70. This was not a spare of the moment thing. If you check out our previous report, this was a planned trade which required two things: a retest of the broken support area as resistance, followed by a lower timeframe sell signal. Instead of using the lower timeframes here, however, we were fortunate enough to enter on the close of a beautiful H4 bearish selling wick. Our stop is set at 106.17 (just above the high of the H4 entry candle) and we’re going to look to ride this down to the 105 region today. Well done to any of our readers who managed to jump aboard this one too!
Levels to watch/live orders:
- Buys: Flat (Stop loss: N/A).
- Sells: 105.70 [LIVE] (Stop loss: 106.17).
USD/CAD:
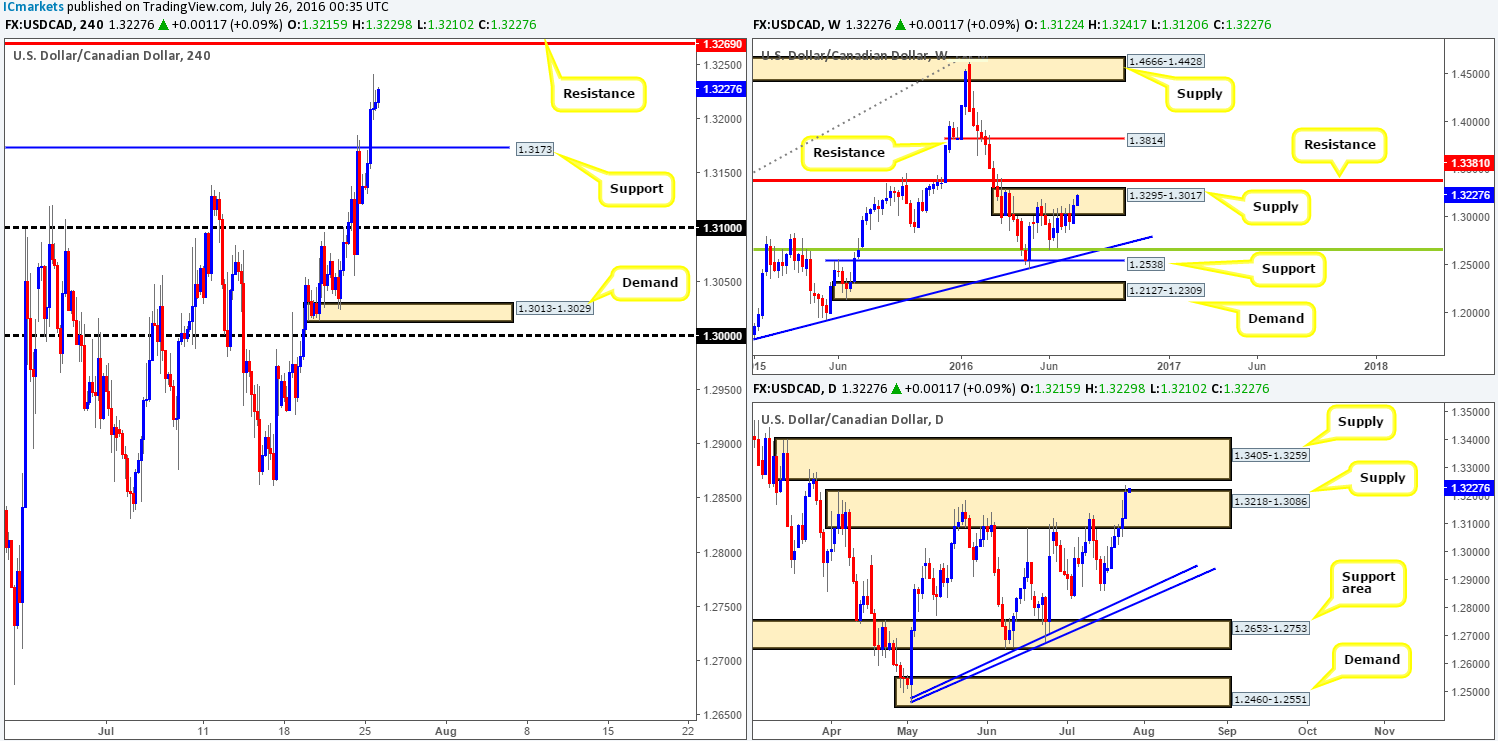
In view of weekly price, the USD/CAD continues to advance on the back of softening oil prices, even though the pair is seen lodged within a weekly supply zone coming in at 1.3295-1.3017. Providing that the bulls remain dominant, the next upside target beyond the current weekly supply can be seen directly above at 1.3381 – a weekly resistance line. Thanks to the recent bout of buying, daily supply at 1.3218-1.3086 has been breached, thereby potentially opening up the path north towards 1.3405-1.3259 – a nearby daily supply area. In addition to this, the H4 Quasimodo resistance line at 1.3173 was taken out (now acting support), which has likely set the stage for a continuation move up to H4 resistance set at 1.3269.
Our suggestions: Look to enter short (preferably with lower timeframe confirmation [see the top of this report]) from the current H4 resistance. Not only is this line positioned within the extremes of the weekly supply zone, but it’s also located just within the daily supply area mentioned above at 1.3405-1.3259. What’s more, over on the H4 oil chart, the commodity is trading around a clear zone of H4 support seen at 42.48-43.07, thus adding weight to a potential reversal from here.
Levels to watch/live orders:
- Buys: Flat (Stop loss: N/A).
- Sells: 1.3269 region [Tentative – confirmation required] (Stop loss: dependent on where one confirms this area).
USD/CHF:
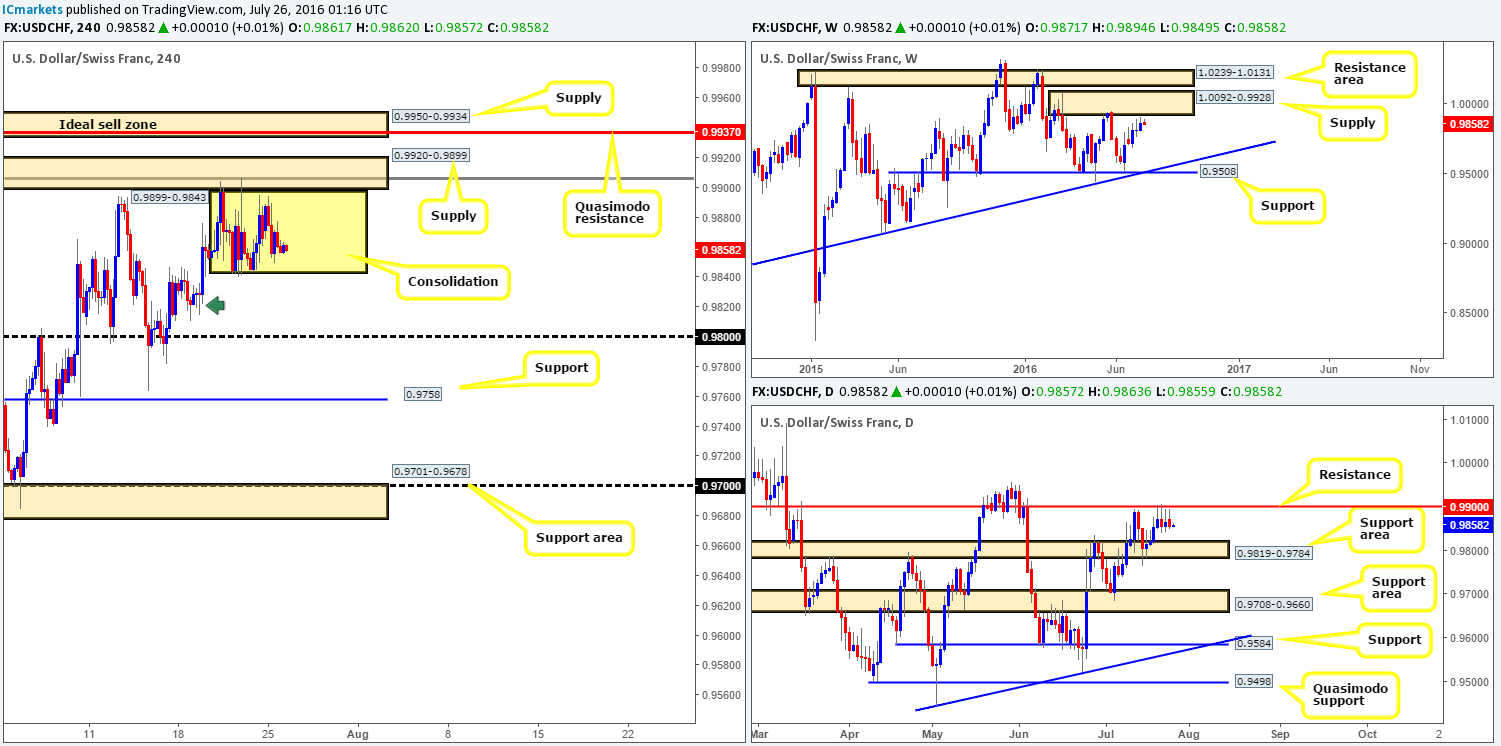
Since Wednesday last week, the Swissy has been seen ranging between 0.9843 and the underside of a H4 supply drawn from 0.9899. Given that the consolidation is only fifty or so pips wide, we’re going to pass on trying to play the edges of this formation. Despite this clear ranging action, the higher timeframes appear to be delivering conflicting signals at the moment. Over on the weekly chart, the unit is seen trading below a weekly supply zone at 1.0092-0.9928, meaning price could still potentially spike north to connect with offers lurking around this area. Downstairs on the daily chart, price printed its fourth consecutive selling wick off the underside of a daily resistance line at 0.9900 yesterday, thus suggesting a downside move is on the way. The next downside target from here can be seen at a daily support area formed by 0.9819-0.9784.
Our suggestions: Personally, the only area that really sparks our interest at the moment is the H4 supply at 0.9950-0.9934, due to it being positioned within the above said weekly supply zone and also boasting a H4 Quasimodo resistance line at 0.9937. Given this area’s confluence, we would, dependent on the time of day, look to short this zone at market with our stop placed just above at 0.9955.
The reason for only being interested in the above zone is simply because a break below the H4 range this week has a nearby H4 demand loitering just below (green arrow) at 0.9811-0.9828 (positioned on top of the aforementioned daily support area), leaving little space to profit.
Also, shorting from the current H4 supply at 0.9920-0.9899, although it’s done a marvelous job in holding the market lower, may very well be weak now due to amount of times its been visited. Therefore the best, and in our opinion, most logical zone to focus on is the extreme H4 supply at 0.9950-0.9934.
Levels to watch/live orders:
- Buys: Flat (Stop loss: N/A).
- Sells: 0.9933 [Possible entry at market here depending on the time of day] (Stop loss: 0.9955).
DOW 30:
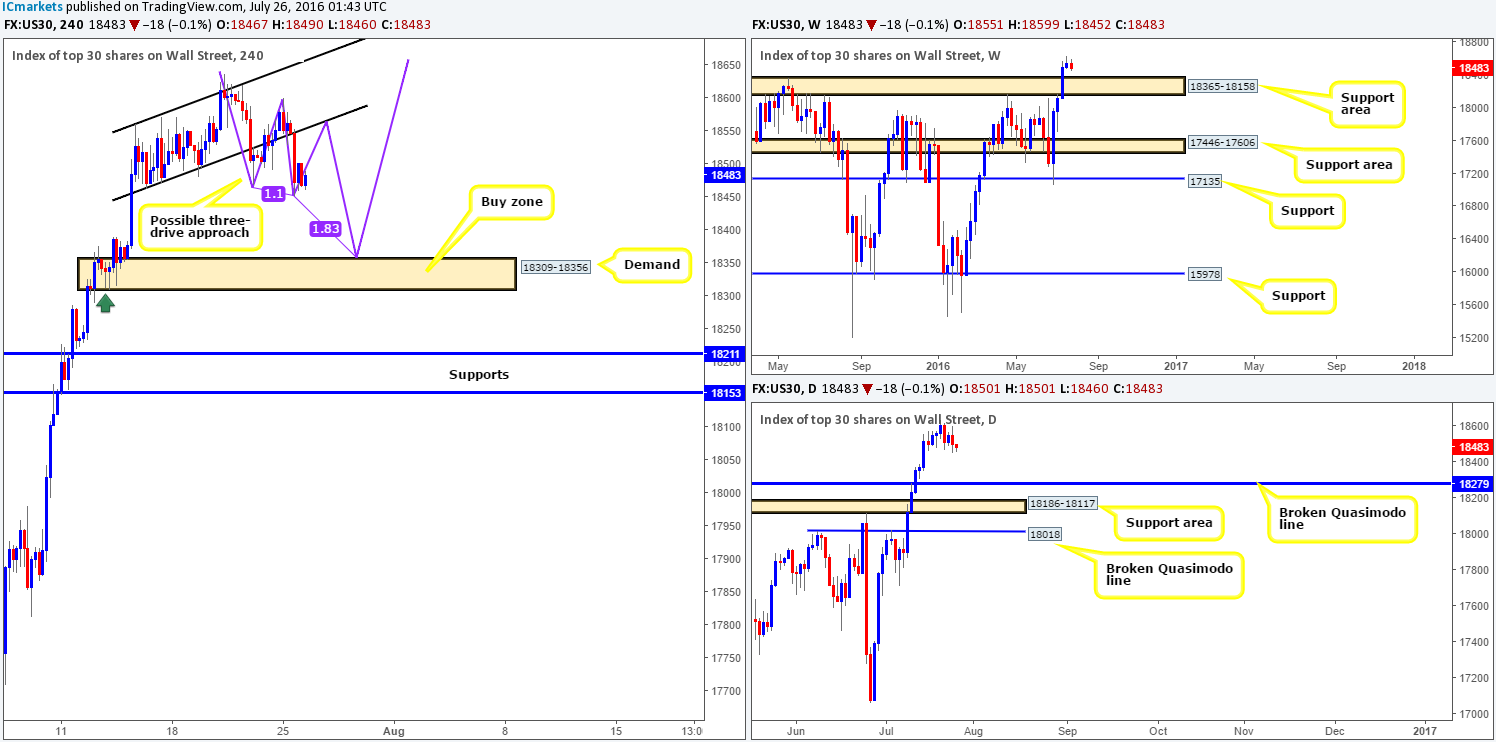
Mid-way through yesterday’s London session US stocks plummeted lower, consequently clocking a fresh low of 18452 on the day. To keep this analysis straightforward and easy to understand, here’s what our team has jotted down going into today’s sessions…
- Possible H4 three-drive approach forming en route to a H4 demand zone coming in at 18309-18356.
- The tails seen marked on the H4 chart with a green arrow represent buying interest around this neighborhood, thus there is a strong possibility that there are unfilled orders still residing here.
- The current H4 demand base is housed within a weekly support area drawn from 18365-18158, and also sits just above a broken daily Quasimodo level at 18279.
Our suggestions: Despite the confluence seen around the H4 demand area, our team would still require a lower timeframe buy entry to form prior to risking capital, due to the possibility that price may fake beyond the aforementioned H4 demand into the broken daily Quasimodo line. What we mean by lower timeframe confirmation is simply either an engulf of supply followed by a subsequent retest, a trendline break/retest or simply a collection of well-defined buying tails around the higher timeframe zone. Stops are usually placed 5-10 pips beyond the confirming structure.
Levels to watch/live orders:
- Buys: 18309-18356 [Tentative – confirmation required] (Stop loss: dependent on where one confirms this area).
- Sells: Flat (Stop loss: N/A).
GOLD:
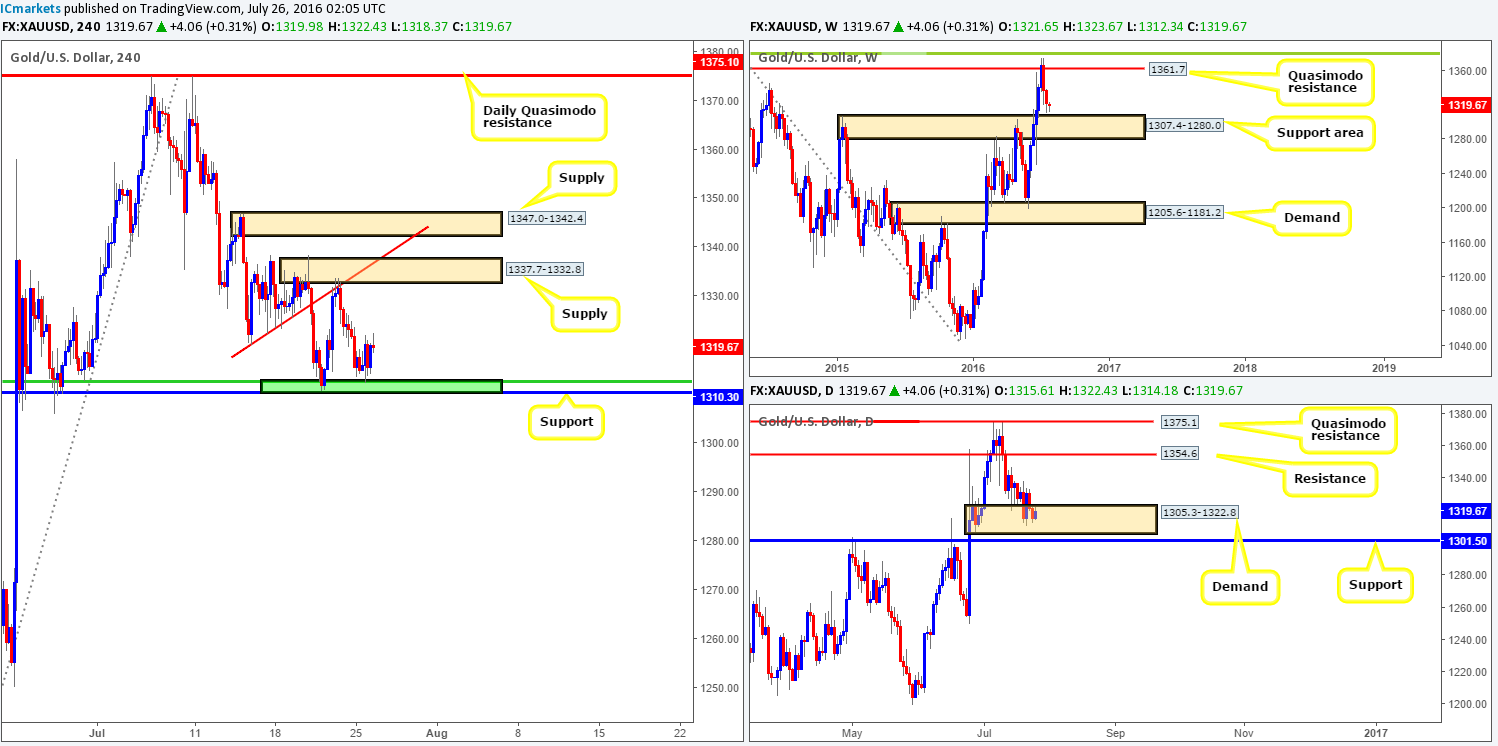
Kicking off with a look at the weekly chart this morning, it’s reasonably easy to see who’s in control at the moment. However, this recent downward momentum may potentially diminish soon, since the yellow metal is now seen loitering just ahead of a weekly support area coming in at 1307.4-1280.0. Lower down the curve on the daily chart, however, the buyers and sellers remain battling for position within the confines of a daily demand area carved from 1305.3-1322.8.
Monday’s sessions on the H4 chart were mellow with price seen ranging between 1320.1/1314.9 on top of a reasonably decent-looking H4 buy zone at 1310.3-1312.4 (comprises of a H4 support and a H4 50.0% Fib support). If one is interested in buying from the current H4 area, we would recommend waiting for lower timeframe confirmation to form before risking capital. Reason being is it is impossible to know how far gold will drill into the above said weekly support area, and let’s remember that this H4 area was already tested last week thus possibly weakening the chances of a second rotation! For lower timeframe entry techniques, please see the top of this report.
Levels to watch/live orders:
- Buys: 1310.3-1312.4 [Tentative – confirmation required] (Stop loss: dependent on where one confirms this area).
- Sells: Flat (Stop loss: N/A).


