
Key risk events today:
BoJ Gov Kuroda Speaks; German IFO Business Climate; RBA Gov Lowe Speaks; US CB Consumer Confidence.
EUR/USD:
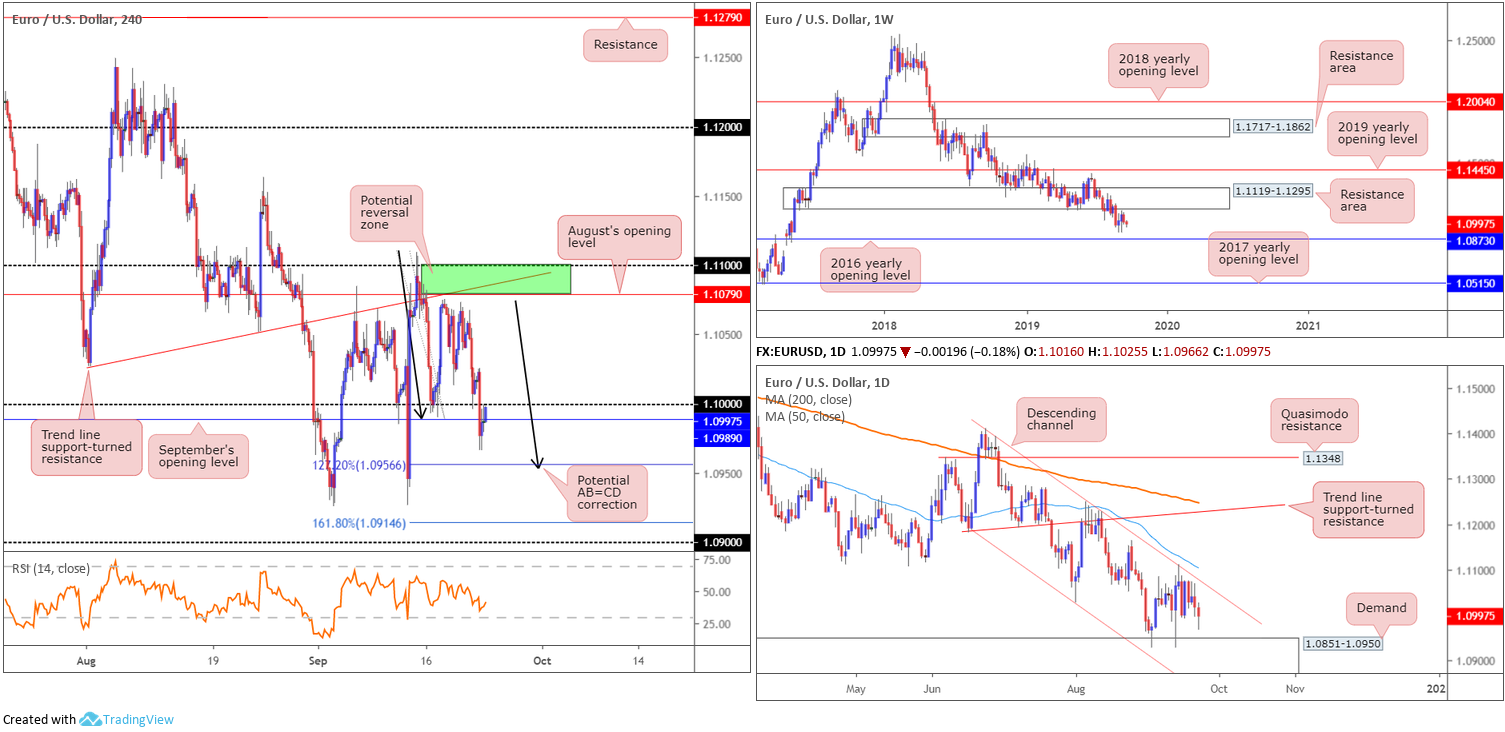
In the early hours of London Monday, Europe’s single currency experienced a sharp change in mood versus the buck, dropping on the back of disappointing Eurozone flash metrics across the board. Elsewhere, ECB President Draghi failed to provide any fresh catalysts, largely a repetition of his post-ECB presser.
Recent downside dethroned 1.10 and clocked lows at 1.0966, though recovered from this point and revisited the underside of 1.10. As of writing on the H4 timeframe this key figure is holding as resistance. South of 1.10, a potential 127.2% AB=CD formation (black arrows) may complete around 1.0956, fixed a couple of points north of daily demand highlighted at 1.0851-1.0950. Note this area houses the 2016 yearly opening level inside its lower bounds at 1.0873: the next downside support target on the weekly timeframe, south of the weekly resistance area at 1.1119-1.1295.
Areas of consideration:
The top edge of daily demand at 1.0950, coupled with the H4 AB=CD completion, is appealing for longs from a technical perspective, according to our chart studies. Whether traders feel confident enough to long this area at 1.0950 without the need for additional confirmation is, of course, trader dependent, though waiting for at least H4 candlestick confirmation may be worth considering (entry and risk can then be calculated according to this structure).
In the event we continue to explore higher ground and reclaim 1.10+ status, the green zone on the H4 timeframe, as highlighted in Monday’s technical briefing, between the 1.11 handle, trend line support-turned resistance (taken from the low 1.1026) and August’s opening level at 1.1079, remains a likely area of interest for possible shorting opportunities. That is, of course, if we can marginally penetrate daily channel resistance (etched from the high 1.1412). For those looking to press this bearish theme, the research team recommends waiting for additional H4 candlestick structure to form before pulling the trigger (entry/risk can be determined according to this pattern). This is largely due to the threat of a stop run materialising through 1.11 to the underside of the weekly resistance area mentioned above at 1.1119-1.1295.
GBP/USD:
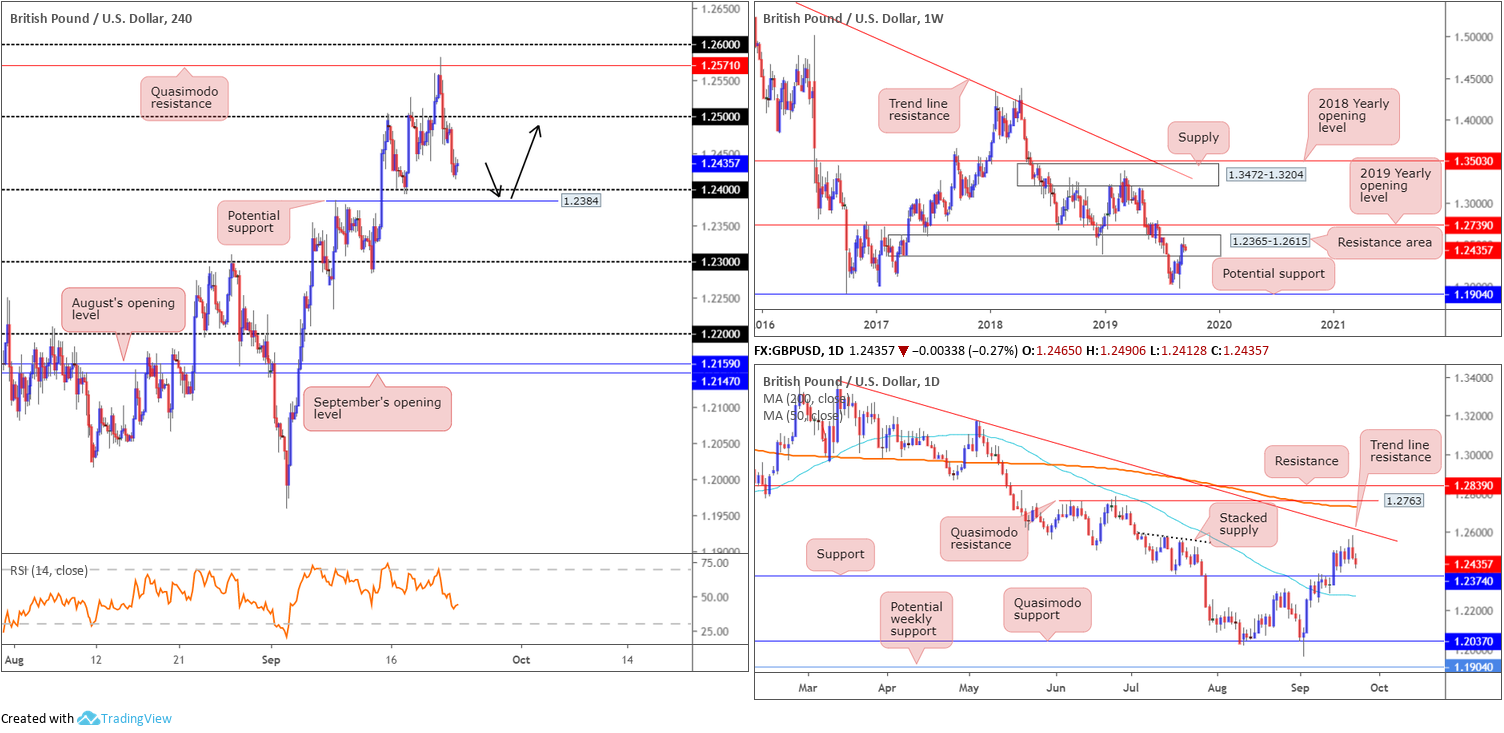
Starved of support, the British pound extended Friday’s losses on Monday against its US counterpart, down more than 30 points on the day, or 0.28%. Losses formed ahead of the UK’s Supreme Court’s ruling on the legality of Prime Minister Johnson’s parliament prorogation, due today at 10.30am British time.
Technically, weekly activity remains within the parapets of a resistance area coming in at 1.2365-1.2615. Support from this angle is not expected to enter the mix until reaching the 1.1904 neighbourhood – held price strongly higher in October 2016. A closer reading of price action on the daily timeframe has the candles turning lower just south of a trend line resistance coming in from the high 1.3380. Continued selling has a well-placed support level at 1.2374 in sight, positioned just ahead of the 50-day SMA (blue – 1.2271).
Price action on the H4 timeframe left the underside of 1.25 unchallenged, and concluded Monday a few points north of 1.24, which provided strong support on July 17 and September 17. Beyond here, another coating of possible support resides close by at 1.2384, followed by then, of course, the daily support level at 1.2374.
Areas of consideration:
Focus has shifted to longs, albeit only likely for a bounce. While weekly price is visibly confined within a resistance area at 1.2365-1.2615, H4 support is nearby between 1.2384/1.24 and daily support comes in around the 1.2374 region. These support levels, coupled with a confirming H4 bullish candlestick signal (entry/risk can be defined on the back of this pattern), may be sufficient to entice buying back to 1.25. However, strict trade management is recommended as price could aggressively turn lower without (technical) warning, given where we’re trading on the weekly timeframe.
AUD/USD:
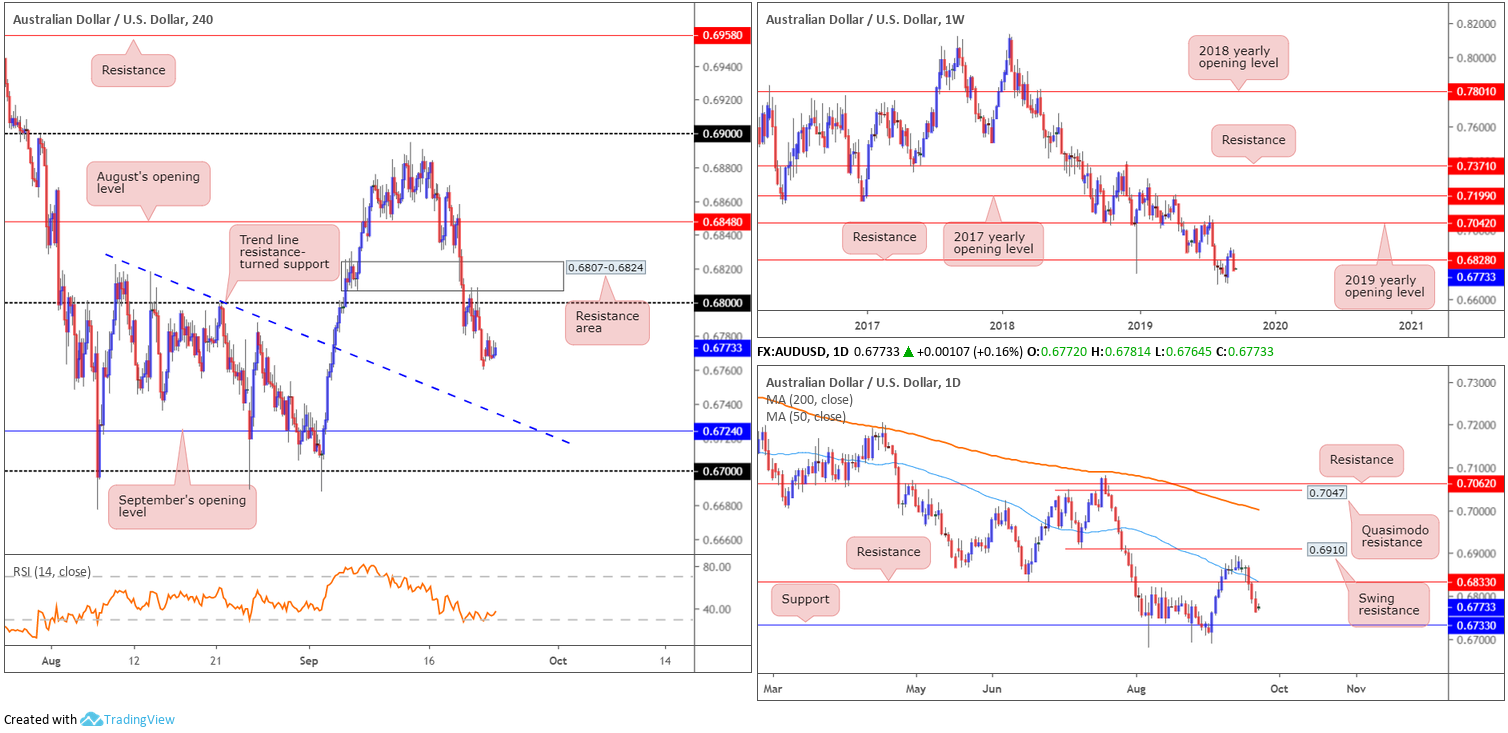
Despite less-than-stellar Australian flash manufacturing PMI data, the AUD/USD heads into Tuesday’s segment mostly unmoved. Considering this lacklustre performance, much of the following report will echo thoughts put forward in Monday’s technical briefing.
From the weekly timeframe:
The Australian dollar glided back into negative territory against the buck last week, consequently suspending hopes of a continuation towards the 2019 yearly opening level at 0.7042. Having witnessed the pair reclaim support at 0.6828 to the downside in reasonably strong fashion last week, leaving price action closing on its lows, further downside potentially has 0.6677 in sight, the YTD low.
Daily analysis:
Despite a fleeting spell north of the 50-day SMA (blue), price action displayed a sharp change in mood last week and resumed control of the said SMA along with support (now acting resistance) at 0.6833. This exposed support carved from 0.6733 as a possible base this week.
H4 analysis:
Traders who read Friday’s technical report (italicised) may recall the following:
Keeping things simple this morning, all three timeframes analysed portend a move lower, with shorts based off the H4 bearish outside pattern formed from the underside of a H4 demand-turned resistance area at 0.6807-0.6824. As for downside targets, either the H4 trend line resistance-turned support (drawn from the high 0.6818) or daily support at 0.6733 offers a logical starting point, whichever hits first.
Areas of consideration:
Outlook unchanged.
So, once again, well done to any of our readers who managed to jump onboard Friday’s decline. As of current price, this might be a good opportunity to consider reducing risk to breakeven, with the prospect of the initial target being achieved (see above in bold) today/early this week.
Aside from the current short in motion, the research team has little else to hang its hat on in terms of high-probability setups at the moment.
USD/JPY:
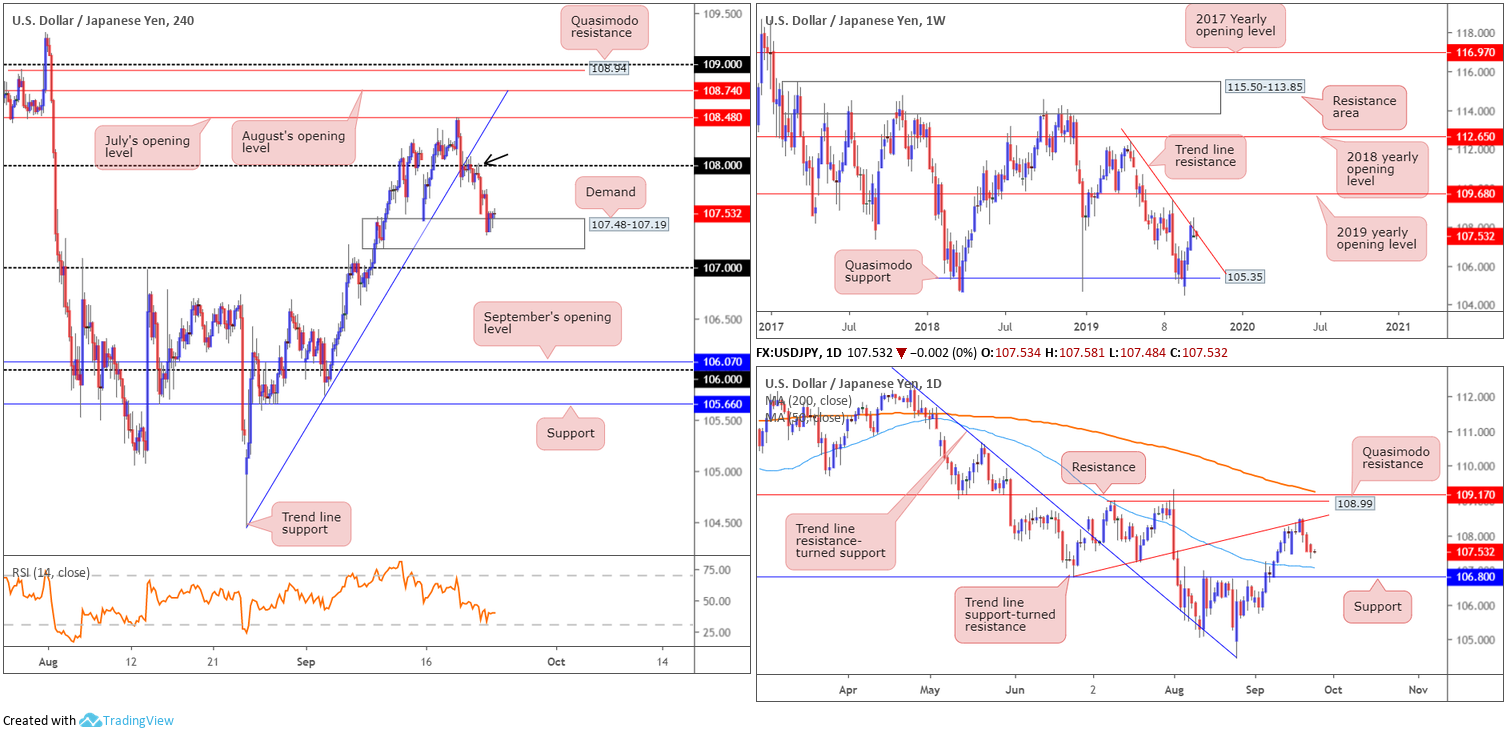
USD/JPY movement settled at the top edge of a H4 demand area at 107.48-107.19 Monday, following a move lower in response to sub-standard Eurozone flash metrics across the board. This consequently revived concerns over a global economic slowdown, increasing demand for safe-haven assets, such as the Japanese yen and Swiss franc.
Traders who read Monday’s technical briefing you may recall the following pieces regarding the higher timeframes:
The recovery from weekly Quasimodo support at 105.35 was impressive, shaped by three back-to-back bullish closes. Last week’s action, nevertheless, proposes a pause in momentum may be in store, formed by way of a weekly shooting star candlestick pattern off weekly trend line resistance (extended from the high 112.40). Additional upside could see the 2019 yearly opening level at 109.68 enter the mix, though a reaction off the 109.31 high may also occur.
Daily trend line support-turned resistance (extended from the low 106.78) recently made an appearance and saw price action form a daily bearish engulfing formation Thursday, followed by additional selling Friday. Daily support at 106.80, located south of the 50-day SMA (blue – 107.07), is eyed as the next downside target on this scale, which, as you can see, boasts strong history since the end of June.
The research team also went on to highlight a H4 shooting star pattern off 108 Friday, which also immersed the previous candle’s range (an outside setting – black arrow). This followed through with a strong downside move. Traders short 108 might want to consider reducing risk to breakeven and liquidating a portion of the position at the said H4 demand. Given both weekly and daily timeframes exhibit potential to push as far south as daily support at 106.80, though, holding the position to here is an option.
Areas of consideration:
As evident from the H4 timeframe this morning, demand at 107.48-107.19 made an appearance, therefore traders short may want to think about reducing risk to breakeven and taking a portion of the position off the table.
As underlined in recent reports, further downside is a possibility to at least 107, beyond H4 demand, which merges with the 50-day SMA on the daily timeframe and is closely sited nearby daily support at 106.80. Traders are also urged to remain aware of weekly price engaging with trend line resistance, thus indicating a higher-timeframe move lower might also be on the cards, possibly penetrating daily support at 106.80.
USD/CAD:
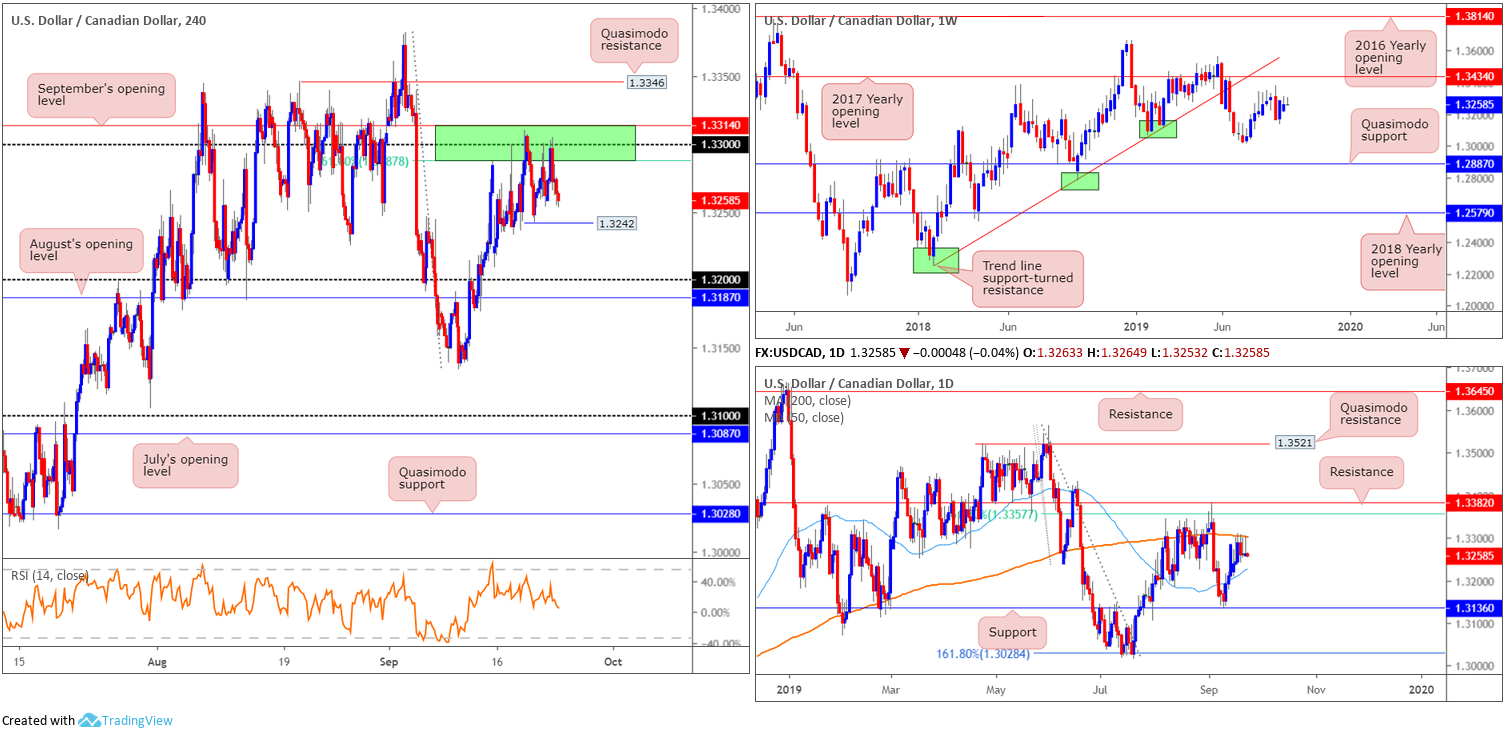
USD/CAD prices, as well as WTI, remain mostly unchanged as we head into Asia Pac hours this morning. Interestingly, the H4 candles retested the underside of a familiar sell zone (green) yesterday between September’s opening level at 1.3314, the round number 1.33 and the 61.8% Fibonacci ratio at 1.3287 (1.3314/1.3287), limiting upside at 1.33 (supported further by the 200-day SMA highlighted on the daily timeframe in orange).
The H4 sell zone mentioned above at 1.3314/1.3287, as underscored in Monday’s briefing, has been tested on three separate occasions over the last week, and once again yesterday, each time failing to produce a lower low. Technically, this may eventually result in a break of the said area and a possible run to H4 Quasimodo resistance at 1.3346 this week. Despite this, sellers still have the upper hand all the while the H4 candles respect the mentioned area of resistance.
Areas of consideration:
Outlook unchanged.
To confirm healthy intent from the current H4 resistance area, the research team requires a H4 close beneath 1.3242. A break of this low likely clears the runway to at least 1.32 and August’s opening level at 1.3187, possibly followed by a move to daily support at 1.3136.
A potential entry, albeit considered somewhat conservative, is wait and see if the H4 candles retest 1.3242 following the break lower. A retest of this level, preferably formed by a H4 or H1 bearish candlestick pattern (entry/risk can be defined according to this structure), is likely sufficient to entice sellers to at least 1.32ish. Traders are also urged to consider risk/reward ratio, targeting at least a 1:1 fix to the initial downside target, before pulling the trigger.
USD/CHF:
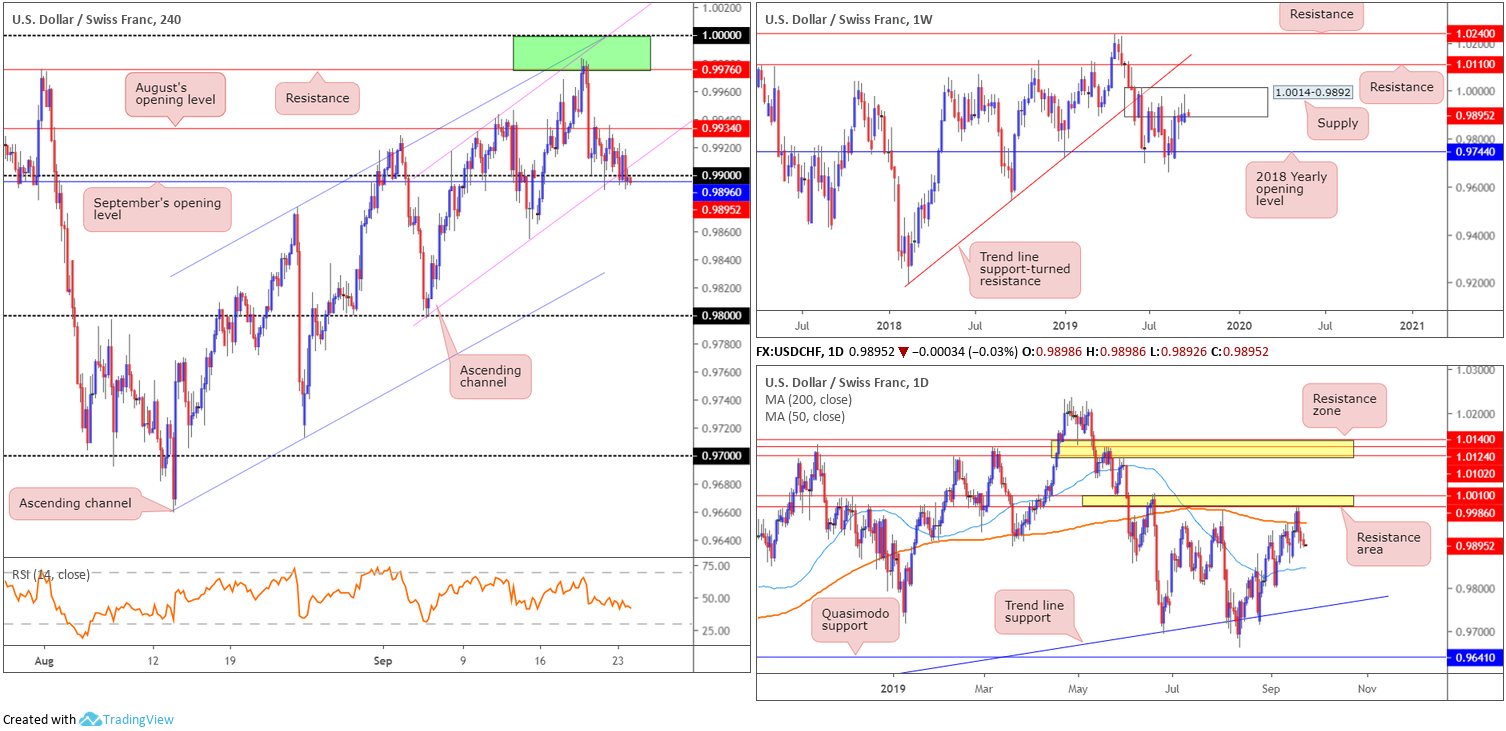
Monday had the US dollar a shade lower against the Swiss franc, down 0.08%. Concerns over slowing global growth added support to safe-haven currencies. This is the third consecutive losing session for the USD/CHF, with the 0.99 handle on the H4 timeframe under pressure. Adding to this, recent selling overthrew H4 channel support taken from the low 0.9798, though is finding some support off September’s opening level at 0.9896.
Weekly price, on the other hand, remains unchanged in terms of technical structure. Longer-term flow has action engaging with familiar supply coming in at 1.0014-0.9892, consequently producing a shooting star formation last week (considered a bearish signal). This is the second time back to the area; therefore, its strength may be compromised. A rotation lower from here, nevertheless, has the 2018 yearly opening level at 0.9744 in view. In the event buyers brush aside the said supply (unlikely a straightforward feat but certainly a possibility), resistance at 1.0110 is in sight, as is long-term trend line support-turned resistance taken from the low 0.9187.
A closer reading of price action on the daily timeframe has the pair airing a reasonably strong bearish vibe just south of a daily resistance area at 1.0010/0.9986. The market also recently saw price engulf the 200-day SMA (orange – 0.9744). The research team notes limited active demand until reaching the 50-day SMA (blue – 0.9844), with an engulf of this line possibly unbolting the door to trend line support etched from the low 0.9542.
(Italicised paragraphs denote work taken from Monday’s technical briefing).
Areas of consideration:
With both weekly and daily timeframes emphasising a bearish tone, focus shifts to possible shorting opportunities on the H4 timeframe.
To confirm a bearish theme, look for a decisive H4 close beneath 0.9896. This – coupled with a (bearish candlestick) retest at 0.99ish – highlights selling opportunities to at least the 50-day SMA on the daily timeframe, followed by a possible run to 0.98. Entry and protective stop-loss orders can be set based on the rejection candlestick’s framework.
Dow Jones Industrial Average:
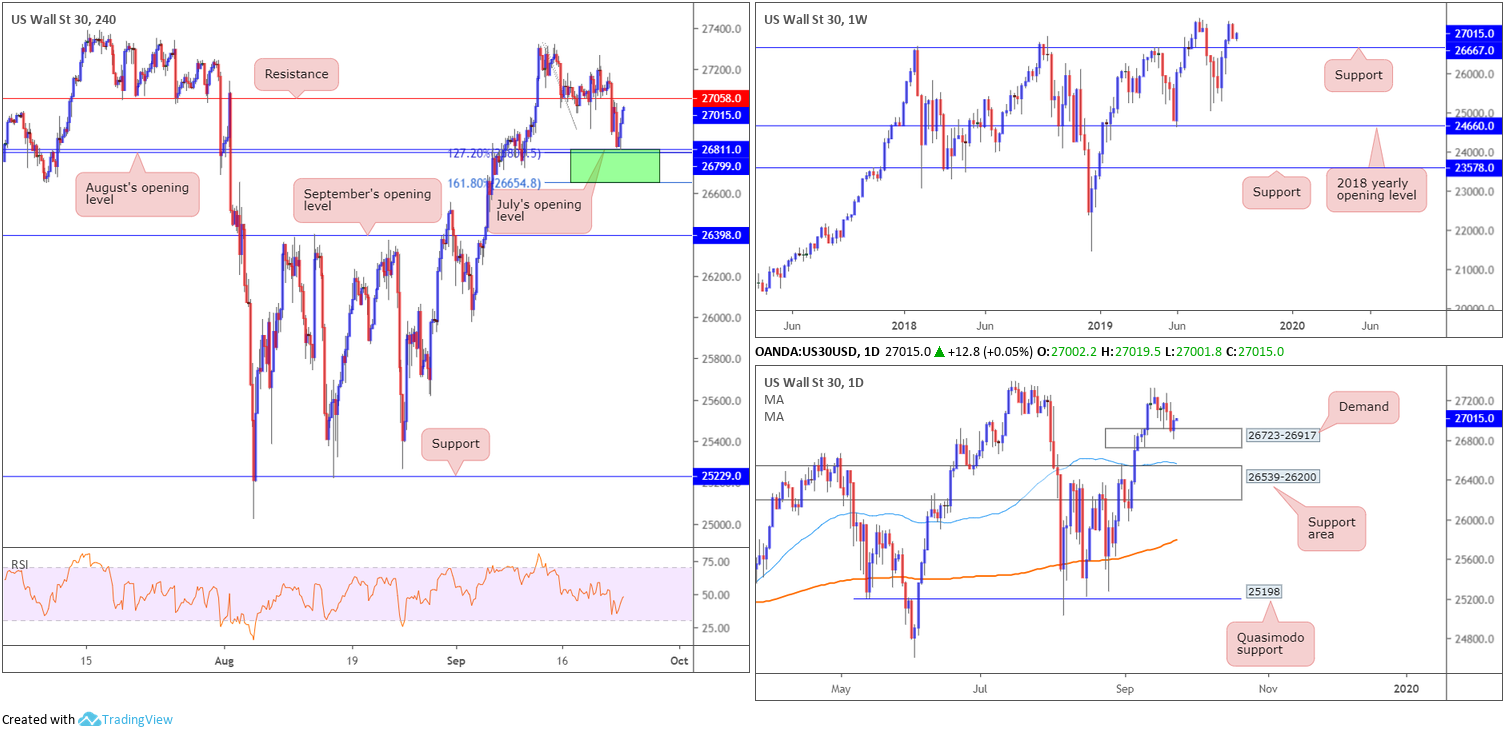
US equities barely moved Monday, as investors digested weak economic figures out of Germany. The Dow Jones Industrial Average added 14.92 points, or 0.06%; the S&P 500 concluded flat as did the tech-heavy Nasdaq 100.
For traders who read Monday’s technical briefing you may recall the following:
Technical support at 27058 was obliterated Friday (now acting support), guiding a close set a few points north of August and July’s opening levels at 26799 and 26811, respectively. Note the 127.2% Fibonacci extension value at 26800 closely aligns with the said levels, with the 161.8% Fibonacci extension also in sight at 26654 (green area). This is a particularly appealing area of support having seen it boast a connection to weekly support at 26667 and the current daily demand at 26723-26917.
On account of the research, the H4 support area at 26654/26811 denotes a possible buy zone this week. Having noted a connection to weekly support at 26667, based within the lower boundary of the said H4 support zone, a move deep into the area could occur before buyers make an appearance. For that reason, waiting for additional candlestick confirmation to form before pulling the trigger is recommended. Not only does this help identify buyer intent, it also provides traders entry and risk levels to work with.
As can be seen from the H4 timeframe, yesterday’s candles retested the top edge of the H4 support zone and rotated higher. Well done to any of our readers who managed to jump onboard this move, as price is nearing the first take-profit target/area of concern: H4 resistance at 27058.
Areas of consideration:
With longs in play off 26654/26811 on the H4 timeframe, a break of H4 resistance at 27058 will not only help confirm additional upside for traders wishing to pyramid current positions, it opens the door for those who missed the initial move higher. It’s preferable a retest at 27058 as support is seen following the break higher before pulling the trigger, though an entry on the breakout candle may suffice (entry and stop-loss orders can be positioned according to the candlestick’s structure), with the take-profit target set around the all-time high of 27388.
XAU/USD (GOLD):
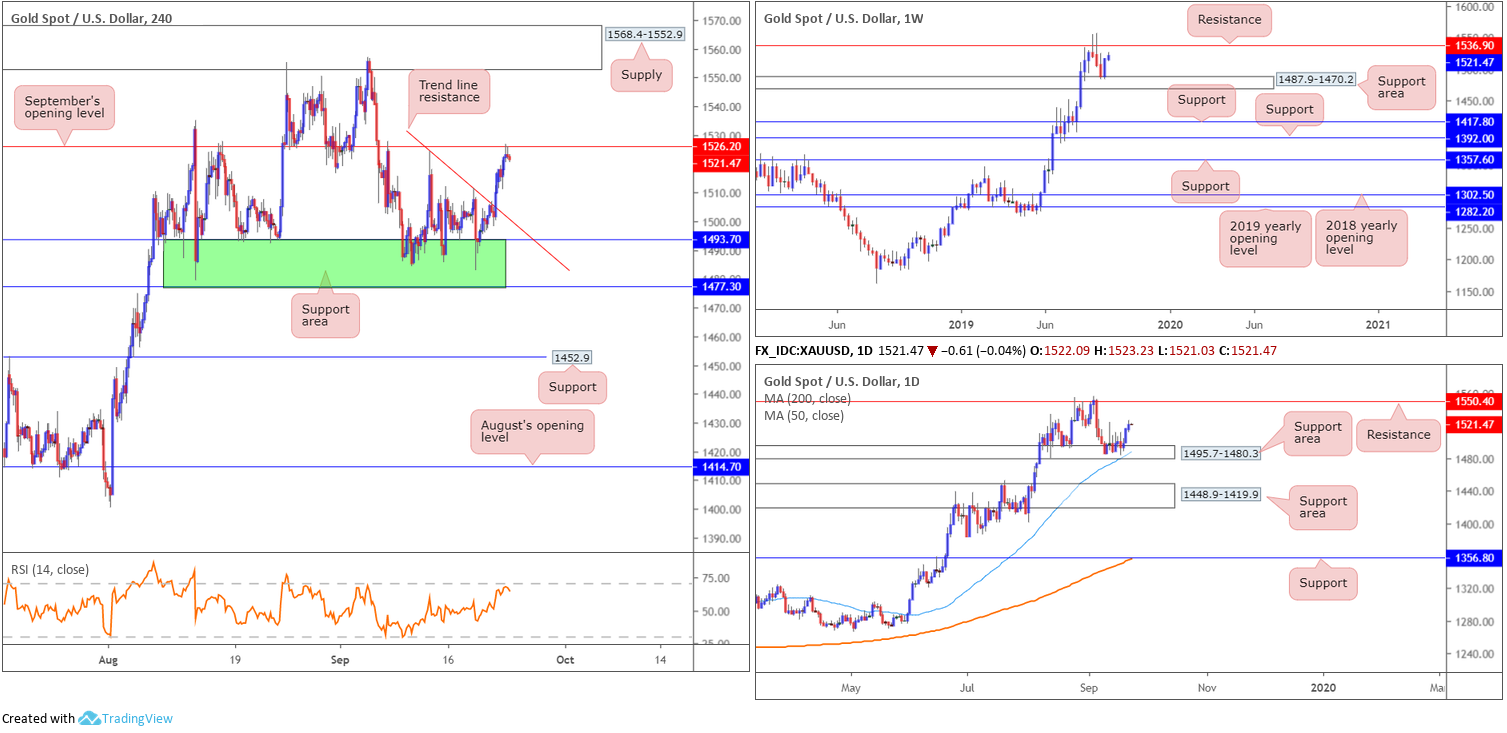
In $ terms, bullion kicked off the week on a positive note, aided by a haven bid drawn from lower-than-anticipated Eurozone PMI data. Adding more than $5, the H4 candles extended Friday’s gains on Monday and drew the unit towards September’s opening level at 1526.2, which, as you can see, held firm at the close.
As a reminder, here’s what Monday’s report had to say:
As evident from H4 structure, the metal remains testing a familiar support area between 1477.3/1493.7 (green). Buyers, particularly on the H4 timeframe, likely still eye higher prices all the time the current support zone is intact. A break of this area has support at 1452.9 to target.
In order to validate buyer intent out of the current H4 support zone at 1477.3/1493.7, a H4 close above local trend line resistance (extended from the high 1524.2) is required. A decisive push through this barrier exposes September’s opening level as the next resistance at 1526.2. Ideally, a retest at the broken trend line as support is eyed as possible entry, even better if the retest forms by way of a H4 bullish candlestick signal (entry and risk can then be set according to this structure).
As can be seen from the H4 chart, an entry on the back of the breakout beyond the noted trend line resistance was in the offing Friday, with protective stop-loss orders plotted beneath its lower shadow. Unfortunately, a retest of the broken trend line was not seen.
What attracted the team to the aforementioned H4 support area was its connection to higher-timeframe structure:
From the weekly timeframe:
Shaped in the form of a bullish engulfing configuration, price action rotated higher from a support area coming in at 1487.9-1470.2 (drawn from April 2013) last week. Snapping a three-week losing streak, the recent move positioned the yellow metal within a short walking distance from resistance coming in at 1536.9.
Daily perspective:
In conjunction with weekly moves, daily candles found a floor off a support area coming in at 1495.7-1480.3 (glued to the top edge of the current weekly support area). From this angle, though, the next upside target falls in a touch higher than weekly resistance (1536.9) at 1550.4.
Areas of consideration:
Well done to any of our readers who managed to board the break of the H4 trend line resistance. The initial upside target, as underlined above, September’s opening level at 1526.2 was achieved yesterday. This is a good opportunity to consider reducing risk to breakeven and maybe liquidating a portion of the position.
In view of the bigger picture showing room to press as far north as weekly resistance at 1536.9, though, further upside is expected yet. However, once this key level enters the fray, a cautious stance is recommended, but do not be afraid to hold some of the position for a possible run to H4 supply at 1568.4-1552.9, as this base is sited just north of daily resistance at 1550.4.
The accuracy, completeness and timeliness of the information contained on this site cannot be guaranteed. IC Markets does not warranty, guarantee or make any representations, or assume any liability regarding financial results based on the use of the information in the site.
News, views, opinions, recommendations and other information obtained from sources outside of www.icmarkets.com.au, used in this site are believed to be reliable, but we cannot guarantee their accuracy or completeness. All such information is subject to change at any time without notice. IC Markets assumes no responsibility for the content of any linked site.
The fact that such links may exist does not indicate approval or endorsement of any material contained on any linked site. IC Markets is not liable for any harm caused by the transmission, through accessing the services or information on this site, of a computer virus, or other computer code or programming device that might be used to access, delete, damage, disable, disrupt or otherwise impede in any manner, the operation of the site or of any user’s software, hardware, data or property.


