
A note on lower timeframe confirming price action…
Waiting for lower timeframe confirmation is our main tool to confirm strength within higher timeframe zones, andhas really been the key to our trading success. It takes a little time to understand the subtle nuances, however, as each trade is never the same, but once you master the rhythm so to speak, you will be saved from countless unnecessary losing trades. The following is a list of what we look for:
- A break/retest of supply or demand dependent on which way you’re trading.
- A trendline break/retest.
- Buying/selling tails – essentially we look for a cluster of very obvious spikes off of lower timeframe support and resistance levels within the higher timeframe zone.
- Candlestick patterns. We tend to only stick with pin bars and engulfing bars as these have proven to be the most effective.
For us, lower timeframe confirmation starts on the M15 and finishes up on the H1, since most of our higher timeframe areas begin with the H4.
EUR/USD:
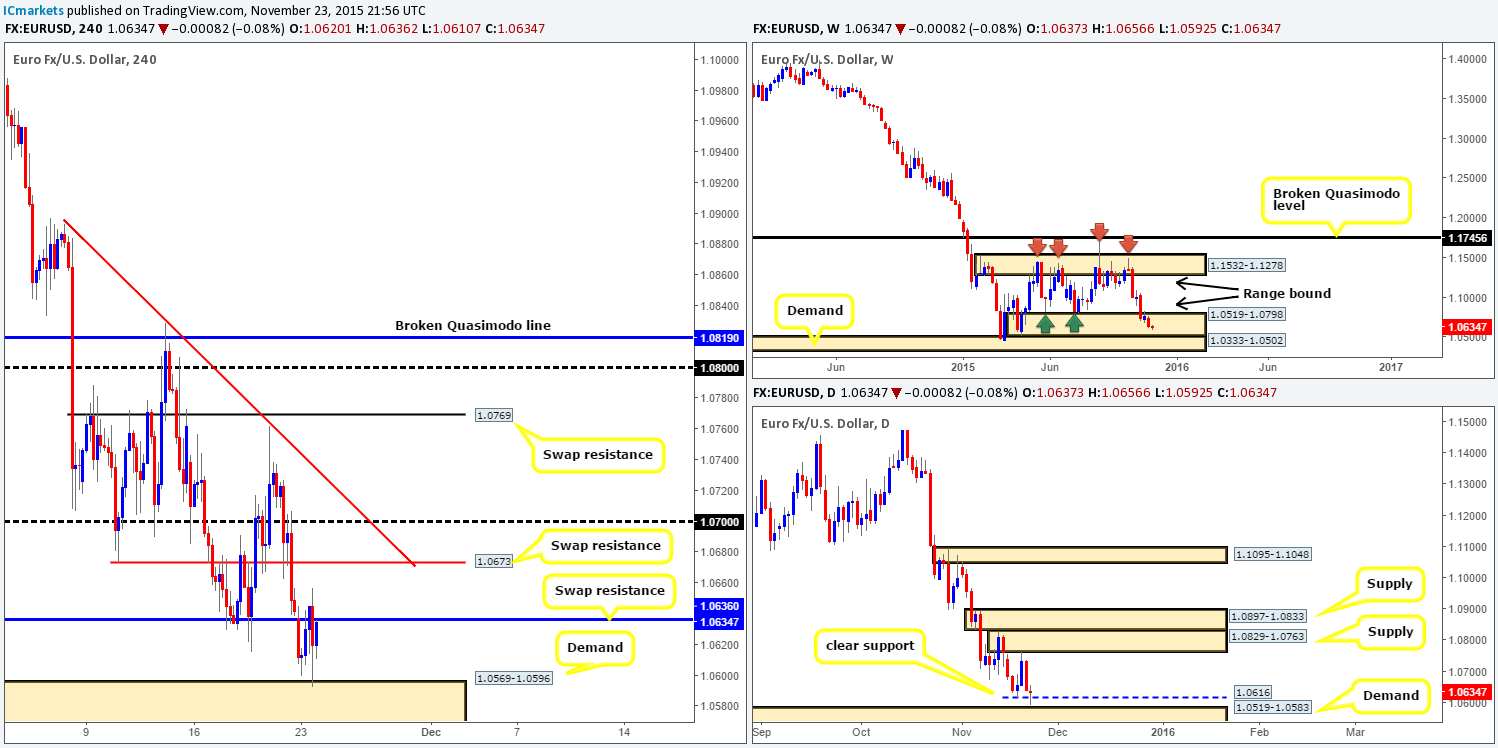
Starting from the top this morning, weekly action continues to linger within range demand seen at 1.0519-1.0798, which has so far not seen much interest from the buy-side of this market. Scrolling a page lower to the daily chart, recent activity saw the EUR stab through support at 1.0616, missing demand at 1.0519-1.0583 by a mere nine pips!
Moving down on to the H4 timeframe, we can see that price held nicely around demand at 1.0569-1.0596 yesterday. Given this, coupled with the situation on the higher timeframe picture (see above in bold), our attention will mostly be driven toward longs today. Ultimately, we’re looking for a clean break above the swap resistance level at 1.0636, as this will likely free the path north up to at least 1.0673, followed closely by psychological resistance 1.0700. However, our team has pointed out that they’d only be interested in trading this move if: (1) 1.0636 is retested as support following the break higher, and (2), lower timeframe confirmation is seen.
Levels to watch/live orders:
- Buys:Watch for offers to be consumed at 1.0636 and then look to trade any retest seen at this level (confirmation required).
- Sells: Flat (Stop loss: N/A).
GBP/USD:
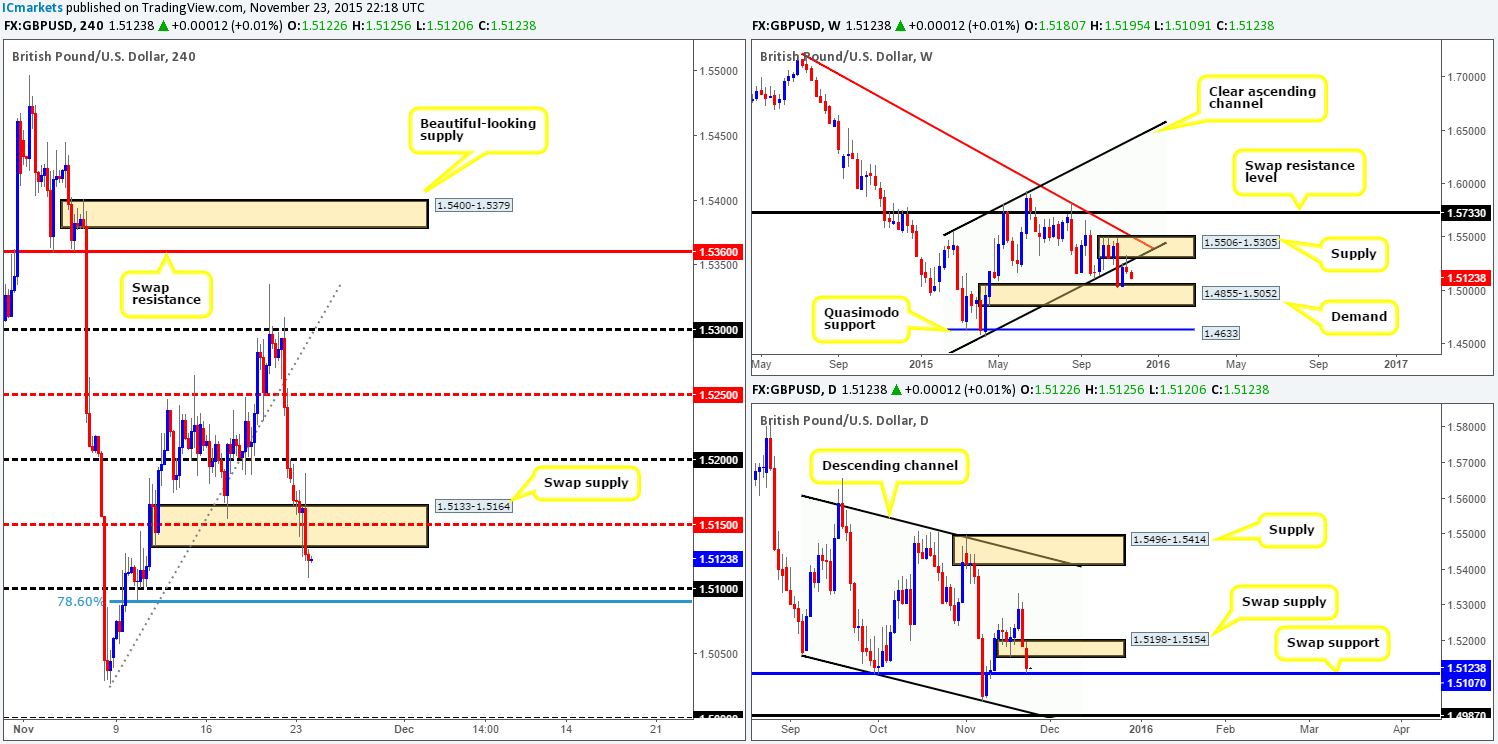
This morning’s analysis will kick-off with a look at the weekly timeframe…Following the rebound from supply seen at 1.5506-1.5305 (converges so nicely with the underside of a recently broken channel support [1.4564]); price is, at the time of writing, seen extending lower. The next downside target from this point is demand coming in at 1.4855-1.5052. On the other side of the coin, however, daily action has took out demand (now supply) at 1.5198-1.5154 and collided into a clear swap support level drawn from 1.5107.
Turning our attention to the H4 timeframe reveals price did in fact give a small bounce from demand (now supply) at 1.5133-1.5164, as reported it may do. Short after though, Cable took a turn for the worst and heavily drove below this zone, reaching lows of 1.5109 on the day.
We now have our eye on psychological support 1.5100 for a potential buy trade. Not only does this number line up with 78.6% Fibonacci support, it also ties in nicely with the above said daily swap support. The only downside to this is the fact that fifty pips below 1.5100 sits the top-side of the aforementioned weekly demand. Therefore, price could very easily blast through 1.5100 and head for the weekly base.
This being the case, our team will, if price reaches 1.5100 today of course, require lower timeframe confirmation before risking capital on this idea. Should all go to plan and we manage to spot a setup here, we’ll be eyeing the underside of the recently broken demand at 1.5133 as our first take-profit target.
Levels to watch/ live orders:
- Buys: 1.5100 region [Tentative – confirmation required] (Stop loss: dependent on where one confirms this level).
- Sells: Flat (Stop loss: N/A).
AUD/USD:
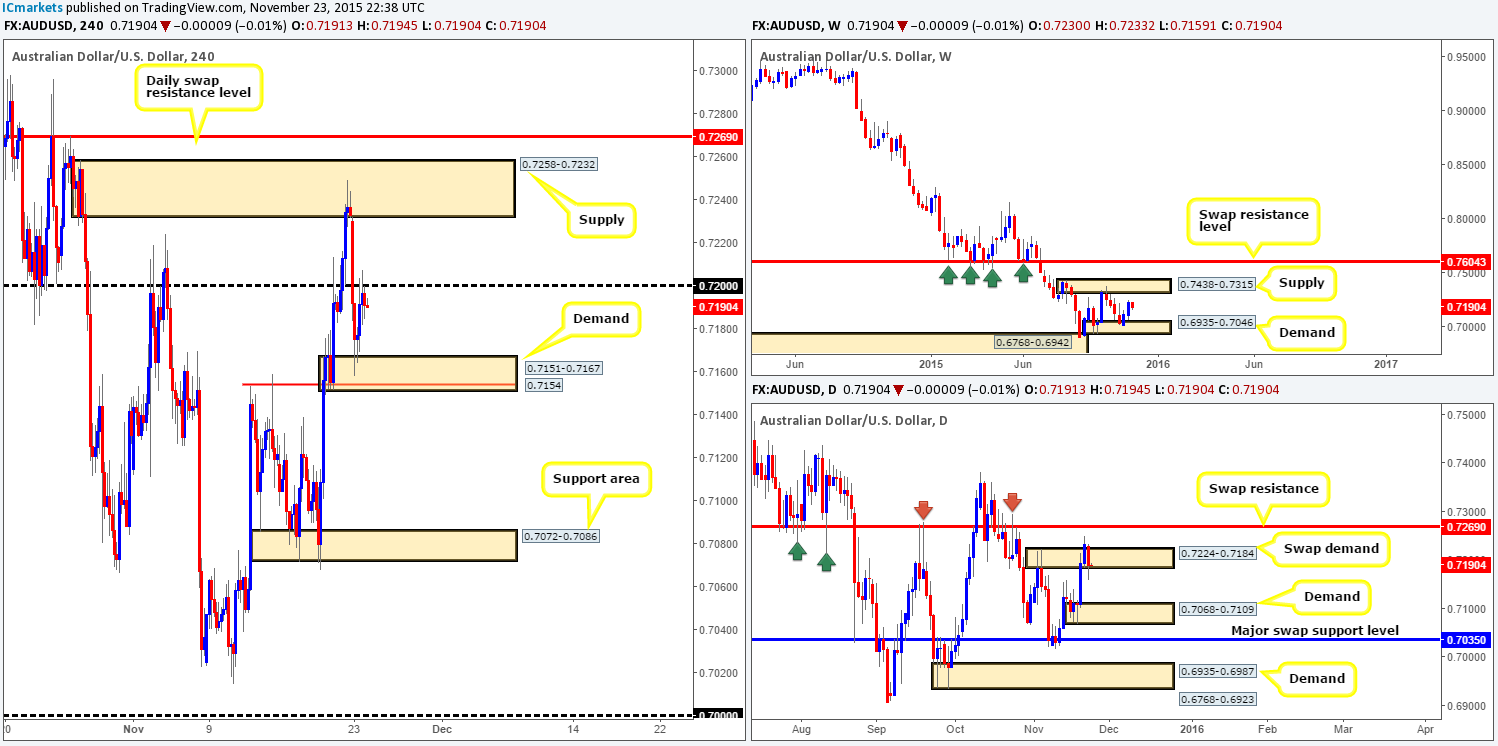
Following Sunday’s open 0.7230 the Aussie saw ‘red’ and heavily snowballed south. This, as you can see, took out psychological support 0.7200 and ended its bearish run by connecting with demand at 0.7151-0.7167. It was from this point, things begun to stabilize and eventually rally back up to retest 0.7200 as resistance.
Given that the weekly offers very little other than price trading mid-range between demand at 0.6935-0.7046/supply at 0.7438-0.7315 right now, and daily action is just holding on within swap demand at 0.7224-0.7184, selling from 0.7200 is not something we’d stamp high probability. In fact, the only viable trade opportunity we’d consider today would be a break above and confirmed retest of 0.7200, targeting the supply above at 0.7258-0.7232. Other than this, we feel this pair is best left on the sidelines for the time being.
Levels to watch/ live orders:
- Buys: Watch for offers to be consumed at 0.7200 and then look to trade any retest seen at this level (confirmation required).
- Sells:Flat (Stop loss: N/A).
USD/JPY:
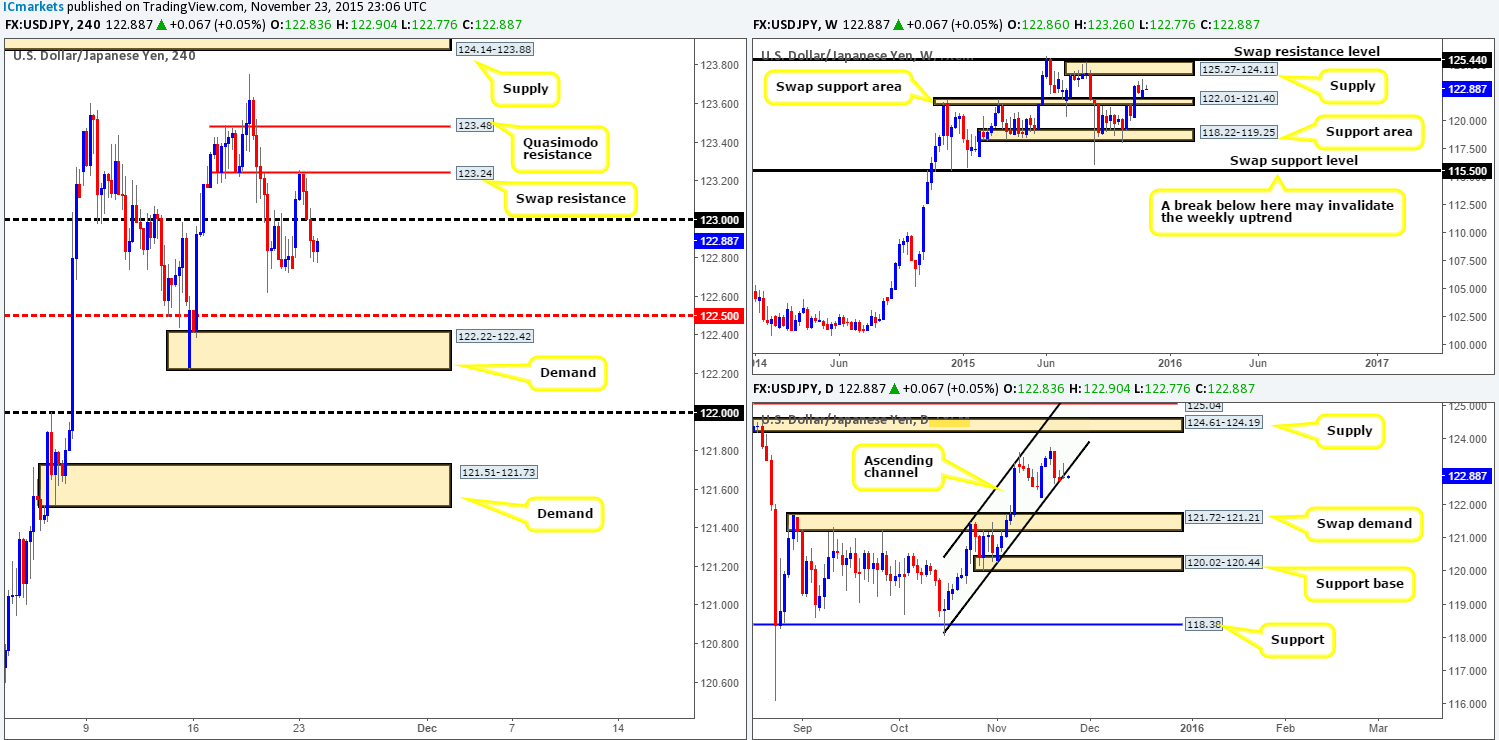
Shortly after the market opened at 122.86, a strong wave of bids pushed price above psychological resistance 123.00, which followed with price collidingwith the swap resistance level coming in at 123.24. Clearly the buyers run out of steam here, as the USD/JPY tumbled back below 0.7200 to the week’s opening line.
Consequent to this recent movement, daily price formed a clear bearish selling wick, potentiallysuggesting that the ascending channel support taken from 118.06/121.47 has had its day. Seeing as the weekly timeframe offers very little other than price trading mid-range between a swap support area at 122.01-121.40 and a supply area seen at 125.27-124.11 at the moment, we’re finding this pair difficult to read for now.
That being the case, we intend to remain flat during today’s trade. Despite this, do keep a note of the following areas since these are very high-probability turning points, but we feel are just too far from current price to be concerned with at present:
- The psychological number 122.00 and demand sitting below it at 121.51-121.73. Both of these areas are associated with the weekly support area mentioned above.
- Also, do keep a tab on the supply sitting at 124.14-123.88. Not only is this beauty glued to the underside of the weekly supply mentioned above at 125.27-124.11, but it is also positioned just below daily supply seen at 124.61-124.19.
Levels to watch/ live orders:
- Buys:122.00/121.51-121.73 (Keep these areas in mind).
- Sells:124.14-123.88 (Keep this area in mind).
USD/CAD:
Using a top-down approach this morning, we can see that weekly action is beginning to show selling strength from within the combined supply/swap resistance area at 1.3456-1.3277/1.3381. Nevertheless, due to there being little noteworthy selling seen here over the past two weeks, we feel it is best to let the current weekly candle close before making any further judgments.
Down in the pits of the daily timeframe, price aggressively broke out north yesterday and hit the Quasimodo resistance level at 1.3415, which just as aggressively sent prices back down to where it came from, the swap support at 1.3352.
Moving down a peg lower to the H4 timeframe, we see little difference between this timeframe and that of the daily. Therefore, as we remain unsure to the strength of the aforementioned weekly combined supply/swap resistance area, we’re going to let price action lead the way today. In the event that we are able to locate a lower timeframe confirmed buy setup on either the 30 or 60 minute timeframes above the daily swap support level, this is the direction we’ll trade in. Conversely, should price break below and retest the underside of this daily level, we’ll then begin looking for lower timeframe confirmation (again on the 30/60 minute charts) to short.

Levels to watch/ live orders:
- Buys:1.3352 [Tentative – confirmation required] (Stop loss: dependent on where one confirms this level).
- Sells: Watch for bids to be consumed at 1.3352 and then look to trade any retest seen at this level (confirmation required).
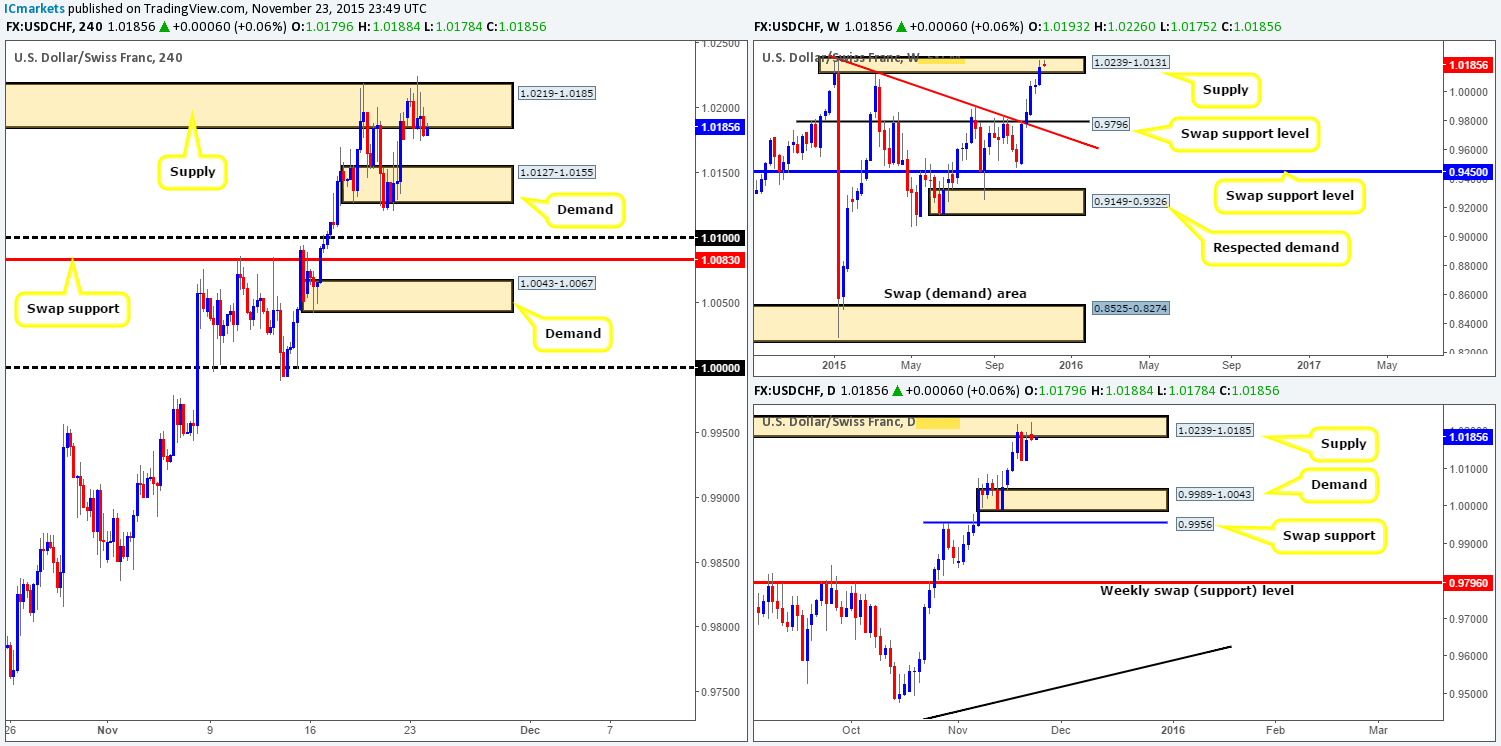
USD/CHF:
Both the buy and sell-side of this market were relatively quiet during yesterday’s trade. Price did, however, manage to slightly spike above supply at 1.0219-1.0185, reaching session highs of 1.0225. Given this somewhat lackluster performance, this pair, at least in our book, remainstrading within overall supply. Weekly supply can be found at1.0239-1.0131, whilst down on the daily timeframe supply comes in at 1.0239-1.0185.
As a result, ever since the market opened at 1.0194, we have been looking to short this pair. What’s stopping us, nevertheless, is the fact that there is a clear M30 support around the 1.0175 that is currently holding this market higher. Ultimately, we’d like to see this barrier taken out and retested as resistance, as this will effectively be our cue to pull the trigger! Take a look on the M30 for yourself, the support will jump out at you!
In the event that the above does come to fruition, we’ll be eyeing the base of H4 demand at 1.0127 to take partial profits (in case of any residual orders left over from the recent break), and then look to close our full position around 1.0100.
Levels to watch/ live orders:
- Buys:Flat (Stop loss: N/A).
- Sells:1.0219-1.0185 [Tentative – confirmation required] (Stop loss: dependent on where one confirms this area).
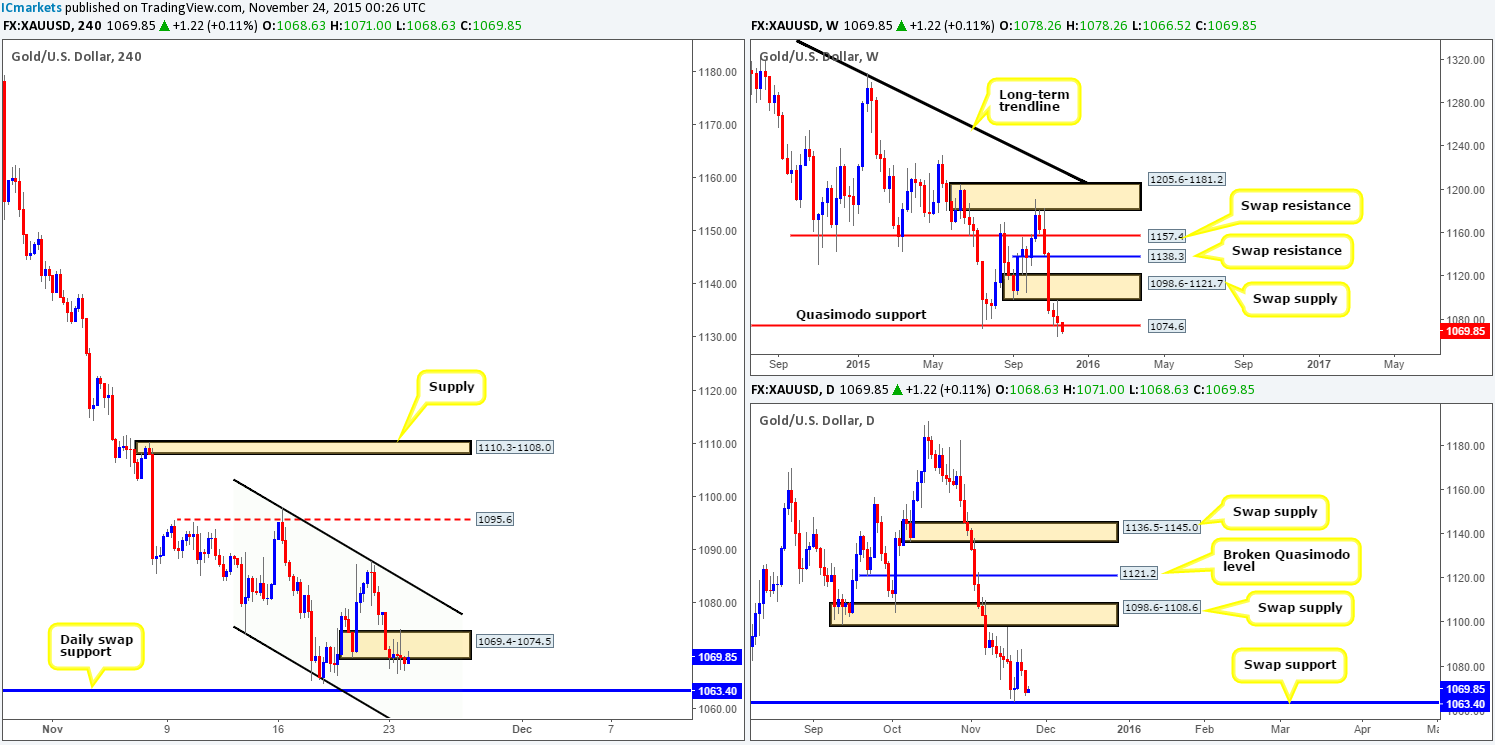
XAU/USD: (Gold)
Beginning with the weekly timeframe this morning, we can see that the Quasimodo support at 1074.6 appears to be struggling to hold on at the moment. With that being said, however, we feel it is best to let the current weekly candle close before making any further judgments – a lot can happen in a week!
Turning our attention to daily action shows that price appears to be heading back down towards the swap support level seen at 1063.4. Ultimately, if this level fails to hold, we feel like it may be game over for the above said weekly Quasimodo level, since it was because of the bids sitting above this daily barrier that price was able to close above the weekly level last week.
Moving down one more level to the H4 timeframe reveals that Gold broke below demand at 1069.4-1074.5, and at the same time, took out our stop-loss order at 1068.25. As far as today’s upcoming sessions are concerned, we have set an alert at 1064.5 since we intend to watch how price behaves around the above said daily swap support. In addition to this, we’re also going to be keeping an eye on the descending channel resistance line taken from the high 1098.0, as this could be a nice place to look to short. Just to be clear here though guys, we would only consider this a valid resistance line if price DOES NOT hit the daily swap support and DOES show a lower timeframe sell signal.
Levels to watch/live orders:
- Buys:1063.4 [Tentative – confirmation required] (Stop loss: dependent on where one confirms this level).
- Sells: Channel resistance line [Tentative – confirmation required] (Stop loss: dependent on where one confirms this level).


