
A note on lower timeframe confirming price action…
Waiting for lower timeframe confirmation is our main tool to confirm strength within higher timeframe zones, and has really been the key to our trading success. It takes a little time to understand the subtle nuances, however, as each trade is never the same, but once you master the rhythm so to speak, you will be saved from countless unnecessary losing trades. The following is a list of what we look for:
- A break/retest of supply or demand dependent on which way you’re trading.
- A trendline break/retest.
- Buying/selling tails/wicks – essentially we look for a cluster of very obvious spikes off of lower timeframe support and resistance levels within the higher timeframe zone.
- Candlestick patterns. We tend to only stick with pin bars and engulfing bars as these have proven to be the most effective.
We search for lower timeframe confirmation between the M15 the H1 timeframes, since most of our higher-timeframe areas begin with the H4. Stops are usually placed 5-10 pips beyond confirming structures.
EUR/USD:
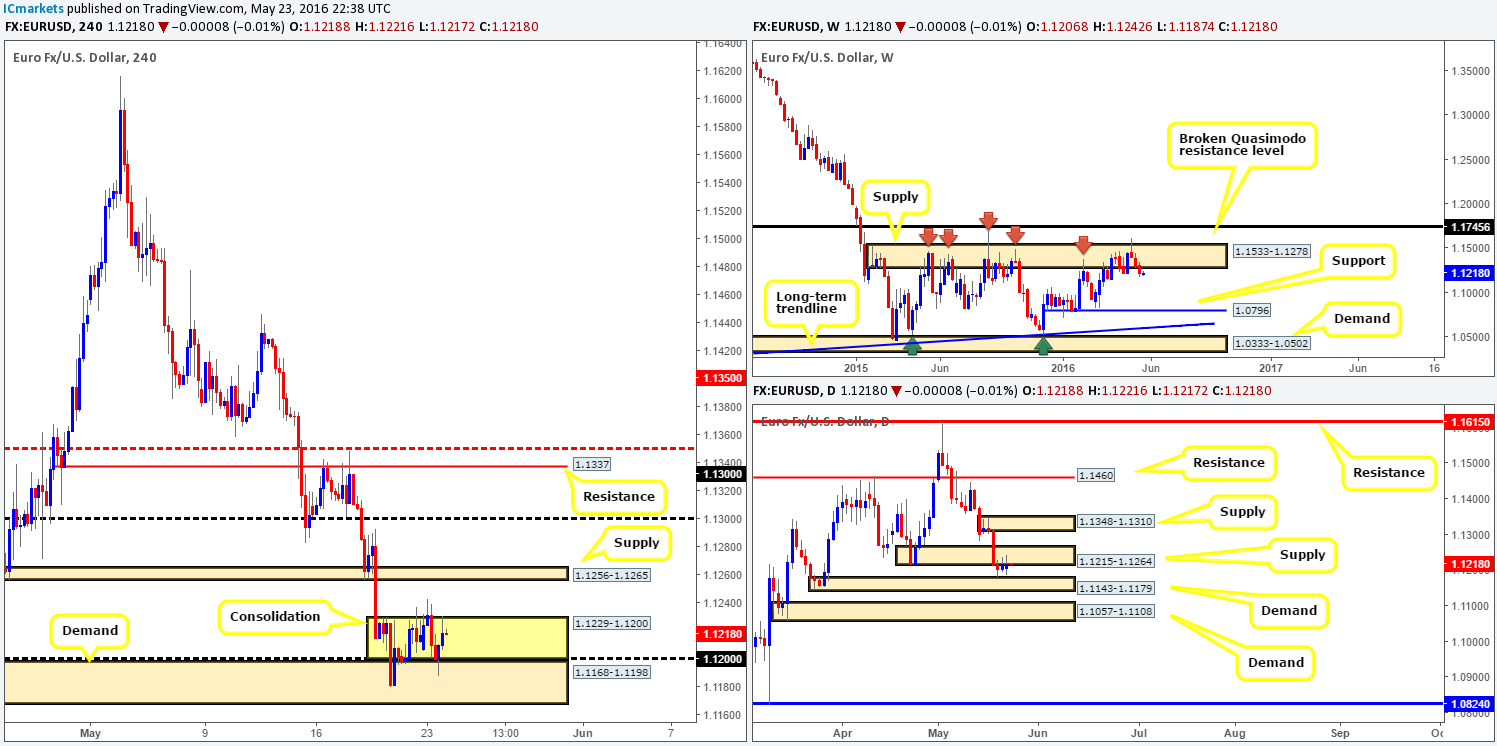
With little high-impacting news on the docket yesterday, the EUR begun chiseling out a small H4 consolidation fixed between 1.1200-1.1229, which, as you can see, sits on top of a H4 demand base drawn from 1.1168-1.1198. From the H4 chart, we can also see that should price break above this range today, it would not be long before the single currency shakes hands with H4 supply seen at 1.1256-1.1265. A break below this range, however, would place one immediately within the jaws of the current H4 demand – a break below this could open the gates for further downside to a H4 demand seen at 1.1057-1.1096.
In light of the H4 picture, let’s not forget that weekly bears continue to reflect bearish intentions from weekly supply at 1.1533-1.1278 that has capped this market since May 2015. As far as we’re concerned, further selling could still be on the cards down to support coming in at 1.0796 – the next weekly downside target. Daily action, nevertheless, remains sandwiched between supply logged in at 1.1215-1.1264 and a demand base formed at 1.1143-1.1179. A break higher would likely clear the rubble for a try at the supply zone seen at 1.1348-1.1310, whereas a cut lower would likely place demand at 1.1057-1.1108 in the firing range.
Our suggestions: Given both the weekly and daily supplies (see above in bold) currently in play at the moment, buying the breakout of the H4 range at 1.1229-1.1200 is not really something our team would stamp high probability. What we are interested in, however, is a break below the current H4 demand at 1.1168-1.1198. As we have already mentioned, this would open the door to further selling down to H4 demand at 1.1057-1.1096 (sits within the extremes of daily demand at 1.1057-1.1108). A short trade could be a possibility for our team if price retests 1.1168-1.1198 as supply alongside a lower timeframe sell setup (for ways to enter the market at higher-timeframe zones please see the top of this report).
Levels to watch/live orders:
- Buys: Flat (Stop loss: N/A).
- Sells: Watch for price to consume 1.1168-1.1198 and look to trade any retest seen thereafter (lower timeframe confirmation required).
GBP/USD:
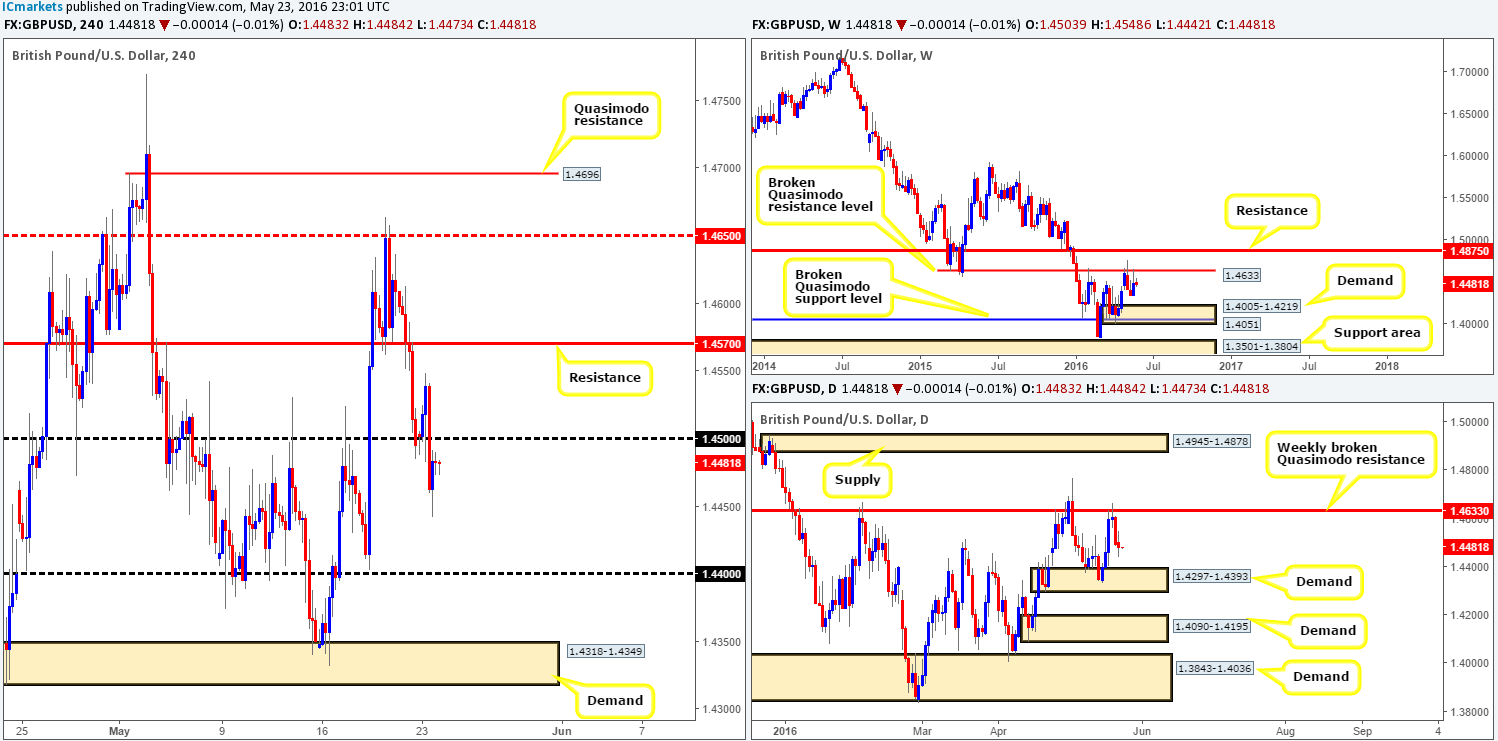
Shortly after the market opened yesterday, GBP bulls went on the offensive from the 1.45 handle quickly advancing to highs of 1.4548 in a likely bout of short covering of off Friday’s sell-off. As can be seen from the H4 chart, this rally was a short-lived one as a heavy round of offers came into the market going into the London open, consequently forcing price below the 1.45 mark. Considering that this pair is now seen loitering below this number, a short from here could be a possibility – here’s why:
- As long as the sellers remain in good shape from the weekly broken Quasimodo resistance line at 1.4633, we see little structure stopping price from hitting weekly demand seen at 1.4005-1.4219.
- The daily chart also shows room for price to continue trading lower this week down to daily demand seen at 1.4297-1.4393. This area has already managed to hold this pair higher from the last sell-off from the aforementioned weekly broken Quasimodo resistance, so this daily demand base will be a KEY zone to watch this week!
Our suggestions: Look to short from 1.45 today and target the 1.44 boundary which is essentially the top-side of daily demand mentioned above at 1.4297-1.4393. Although both the weekly and daily timeframes suggest lower prices could be on the horizon (see above), do take into account that the H4 chart over on Silver (a highly correlating market to the Pound) is holding above support at 16.313. Therefore, we would only recommend taking a short from 1.45 if and only if lower timeframe confirmation is present. A break/retest of demand, a trendline break/retest or simply a cluster of selling wicks around the 1.45 region would be sufficient enough for us. Stops are usually placed 5-10 pips beyond confirming structures.
Levels to watch/live orders:
- Buys: Flat (Stop loss: N/A).
- Sells: 1.45 region [Tentative – confirmation required] (Stop loss: dependent on where one confirms this area).
AUD/USD:
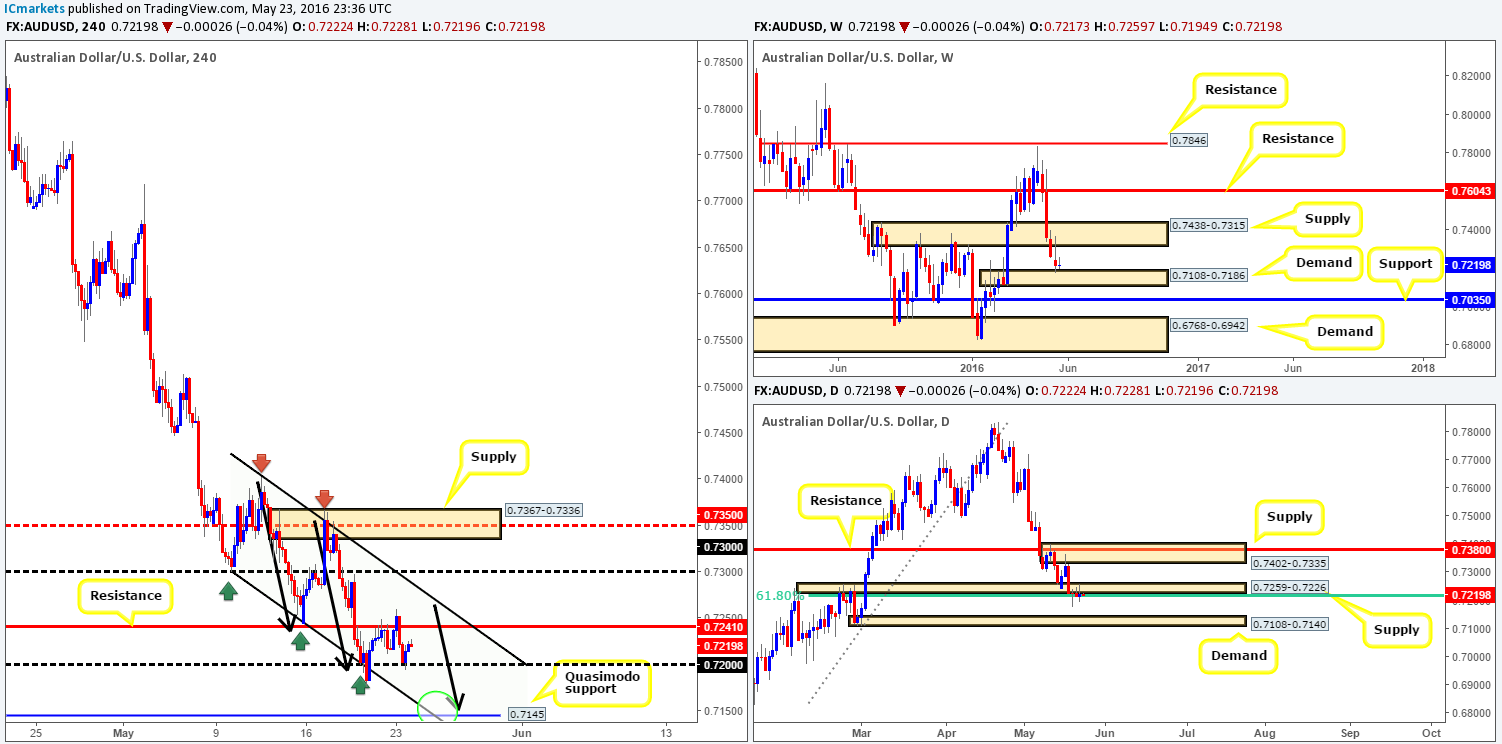
During the course of yesterday’s sessions, we can see that the commodity currency whipsawed above H4 resistance at 0.7241 and sold-off. This clawed back Friday’s gains and went on to fill bids around the 0.72 handle. To keep this analysis short and sweet, we’re going to jump in and show what we have our eye on at the moment:
- The Aussie is now seen testing weekly demand coming in at 0.7108-0.7186.
- Daily action shows that the buyers and sellers continue to battle for position between support derived from a 61.8% daily Fibonacci support at 0.7210 and near-term daily supply at 0.7259-0.7226. In the event of a breakdown through 0.7210, further downside could be seen to daily demand at 0.7108-0.7140 (sits within the extremes of the above said weekly demand), meanwhile, a push above the current daily supply would likely place daily supply at 0.7402-0.7335 (converges nicely with daily resistance at 0.7380) back in the limelight.
- Over on the H4 chart is where things get a little more interesting. Right now, we see a H4 downward channel in play extended from 0.7402/0.7299, a three-drive H4 bullish approach (see black arrows) and a H4 Quasimodo support line at 0.7145. Take into account that this H4 Quasimodo also sits within the above said weekly demand and only five pips above daily demand. On top of this, the H4 line fuses beautifully with the H4 downward channel support (see green circle), as well as correlation confluence seen over on the H4 AUD/SGD chart around H4 support coming in at 0.9932.
Our suggestions: In light of the above points we have placed a pending buy order at 0.7150, with a stop below the apex of the H4 Quasimodo pattern at 0.7106. First take-profit is set around the 0.72 mark, followed by the aforementioned H4 channel resistance. Good luck.
Levels to watch/live orders:
- Buys: 0.7150 [Pending order] (Stop loss: 0.7106).
- Sells: Flat (Stop loss: N/A).
USD/JPY:
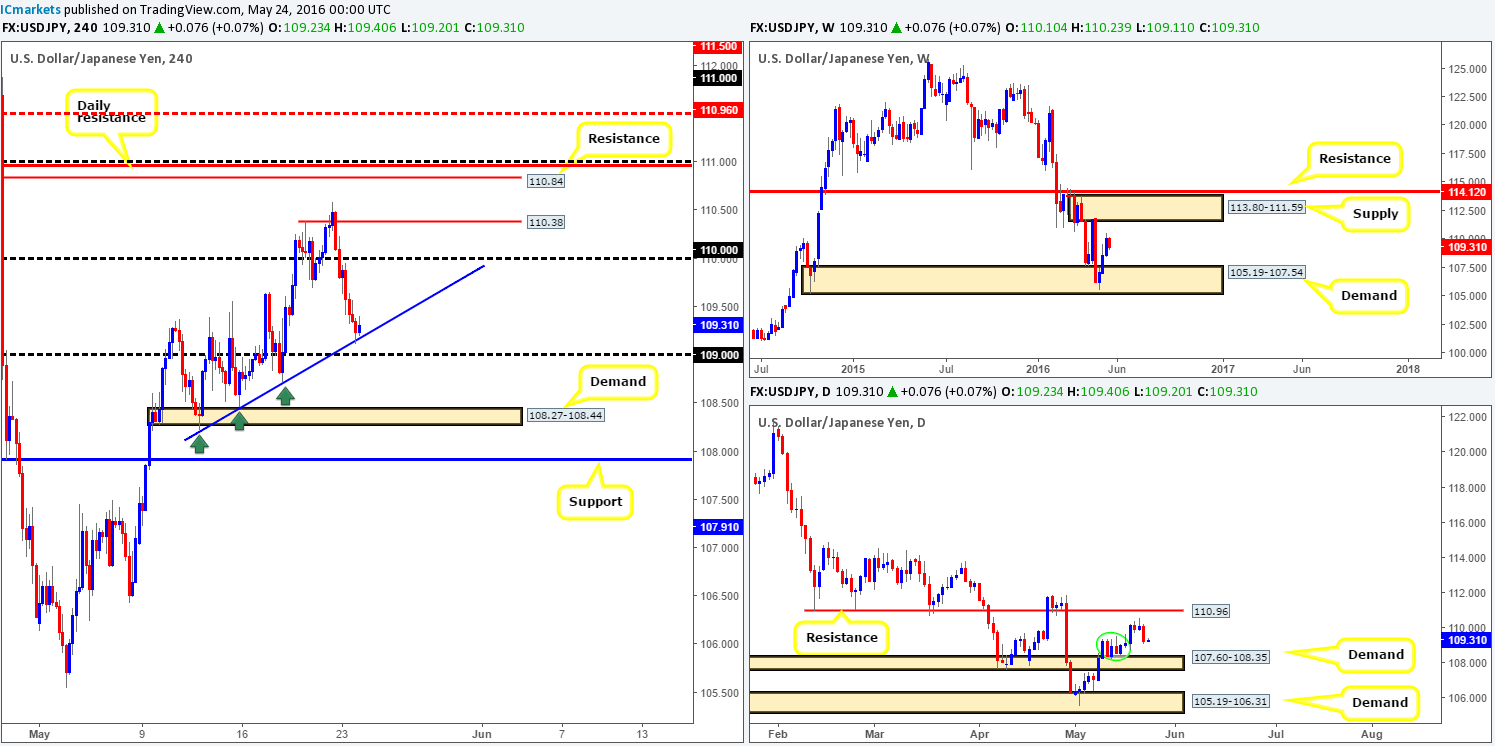
Beginning with a quick look at the weekly chart this morning, the USD/JPY pair, in our view, shows room for prices to continue driving higher this week towards weekly supply sitting at 113.80-111.59. The recent selling, which can clearly be seen on the daily chart, has traded directly into what we believe to be a sturdy-looking daily demand base at 108.38-109.39 (green circle). Should this fail to hold price, there’s another daily demand (a swap zone) seen just below penciled in at 107.60-108.35. Conversely, if the buyers do make an appearance here we may see price touch gloves with daily resistance drawn from 110.96.
Stepping across to the H4 chart, candle action, after an extremely bearish day yesterday, recently found support at a H4 trendline extended from the low 108.22. Owing to there being little to no support converging with this trendline, and with the 109 handle lurking just below, we are not going to be looking to buy from here today. 109, however, could be an option for longs since a ton of stops will likely be ripped from the market on the break below the H4 trendline as traders attempt to buy from here (sell stops provide liquidity to buy into).
Our suggestions: With both the higher-timeframe charts suggesting price may head higher (see above), a long from 109 could be a possible option today. Assuming that this number holds, 110 would likely be our first port of call for profit taking, followed by the 111.00/110.84 zone (round-number 111.00, daily resistance at 110.96 and H4 resistance at 110.84). Of course, let’s not forget that price has the potential to rally as high as 111.50 as this closely represents the underside of weekly supply discussed above at 113.80-111.59, so do bear this in mind if you’re also considering longs from 109.
Lower timeframe confirmation is required at 109 (for ways to enter the market at higher-timeframe zones please see the top of this report).
Levels to watch/live orders
- Buys: 109 region [Tentative – confirmation required] (Stop loss: dependent on where one confirms this area).
- Sells: Flat (Stop loss: N/A).
USD/CAD:
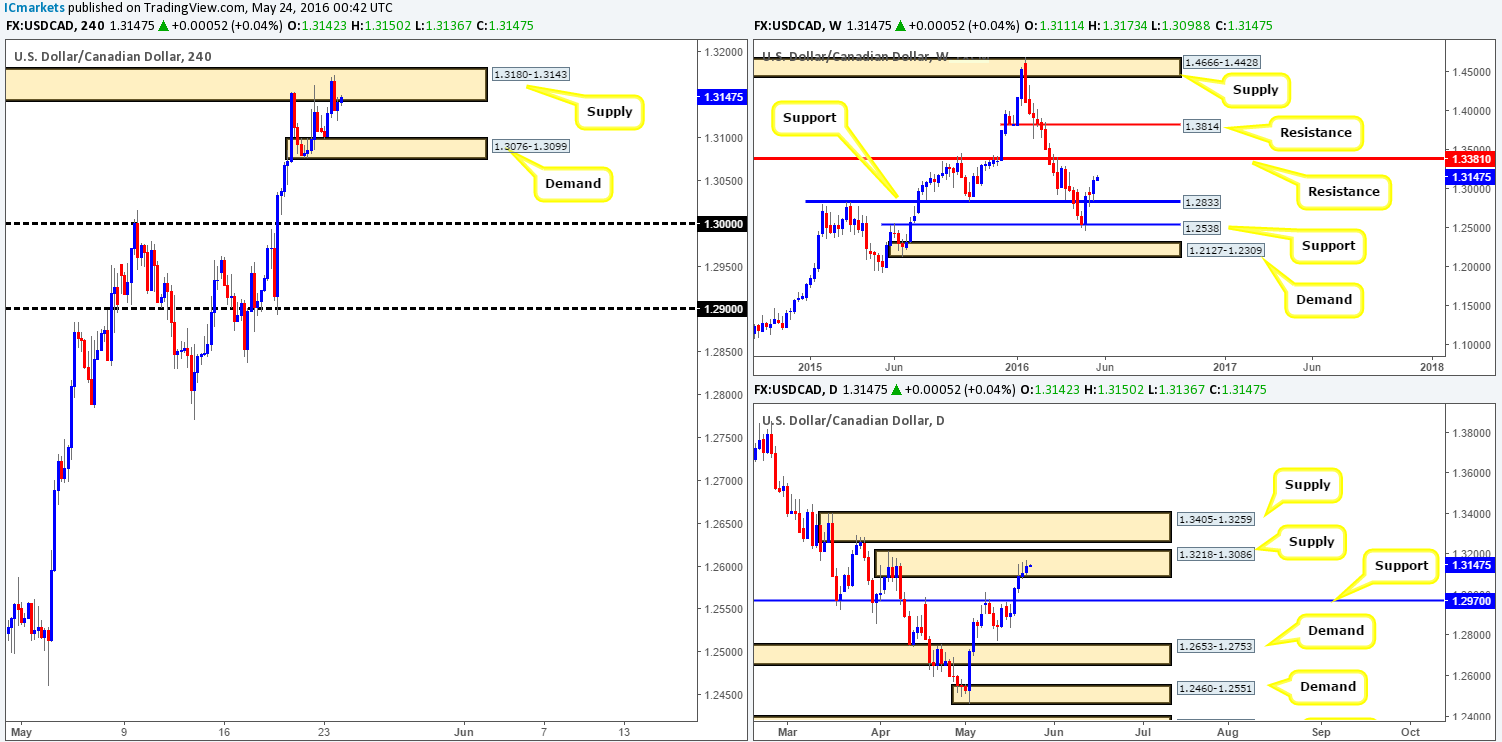
Supported by a small rally over on oil from H4 demand seen at 46.72-47.36, the USD/CAD found offers within H4 supply at 1.3180-1.3143 during yesterday’s trading. Despite this, little has changed since we last analyzed this pair – price effectively remains capped between H4 supply at 1.3180-1.3143 and H4 demand drawn from 1.3076-1.3099.
With the above in mind, where does our team stand in the bigger picture? Over on the weekly chart, the Loonie extended its bounce from support at 1.2833 last week, likely opening the gates for a possible touch of 1.3381 – weekly resistance. Down on the daily chart, offers within the current daily supply zone at 1.3218-1.3086 appear to be struggling right now. This may suggest that this pair could rally north (in-line with weekly expectations) to connect with daily supply at 1.3405-1.3259 sometime soon (encapsulates the aforementioned weekly resistance level).
Our suggestions: After re-evaluating the charts, trading this market right now is difficult and potentially very risky. A buy would almost certainly place you within the jaws of a daily supply zone, whilst a sell would, as you can see, put you up against weekly buying! Therefore, opting to stand on the sidelines here today may very well be the best path to take.
Levels to watch/live orders:
- Buys: Flat (Stop loss: N/A).
- Sells: Flat (Stop loss: N/A).
USD/CHF:
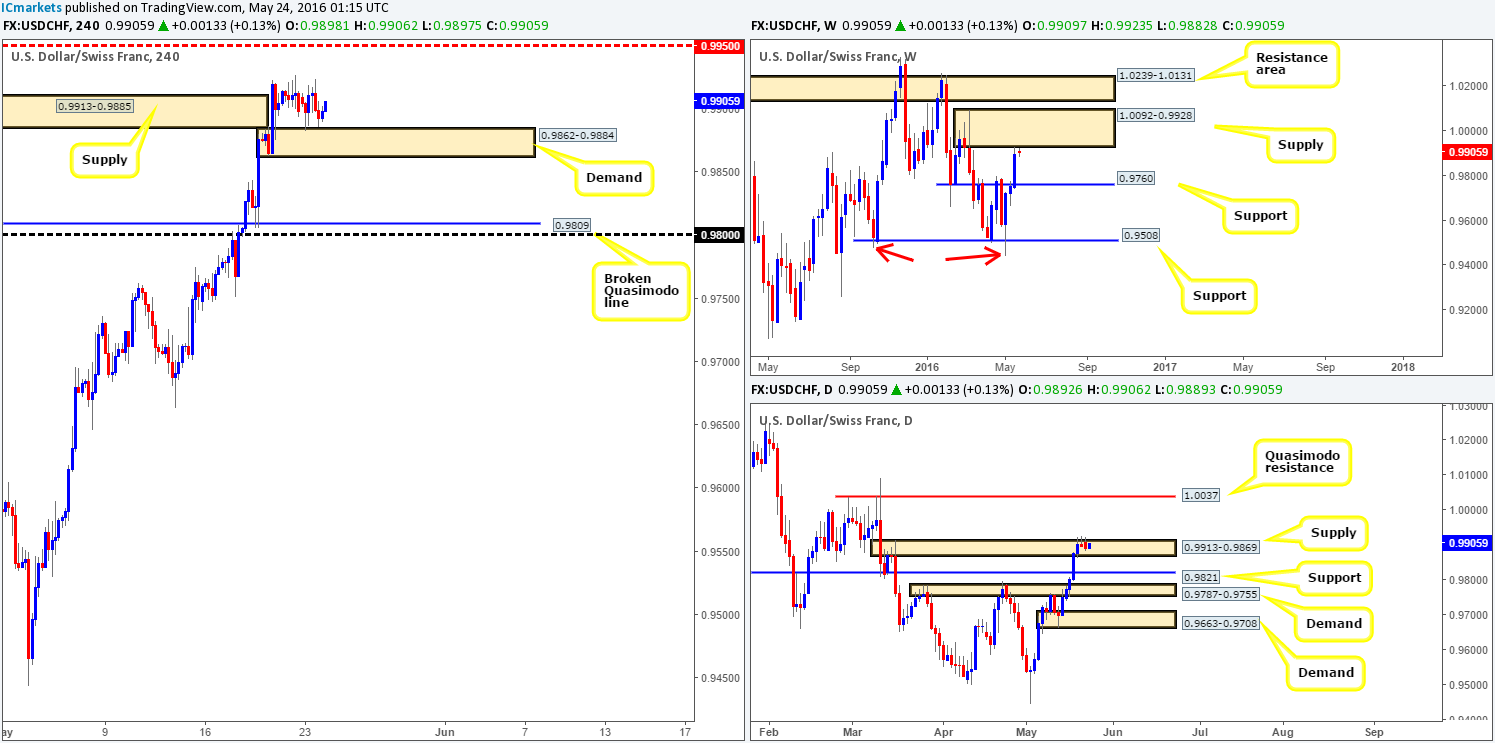
In recent trading, the Swiss couple touched base with H4 demand drawn from 0.9862-0.9884 in the early hours of yesterday morning, and has not broken this low since. On top of that, H4 supply at 0.9913-0.9885 is very likely consumed, thus possibly clearing the pathway north for a push up to at least the H4 mid-way resistance line 0.9950. Before we go looking to buy from here, however, let’s see how the land lies over on the bigger picture…
Last week’s sharp run to the upside brought this pair within two pips of weekly supply chalked in at 1.0092-0.9928. This supply zone is relatively large so a drive higher is still possible before we see weakness come into the market.
Lower down the scale on the daily chart, the unit continues to flirt around the extremes of daily supply coming in at 0.9913-0.9869. In the event that bids now outweigh offers here, it is likely we’ll see price gravitate to the next point of resistance – a Quasimodo line drawn from 1.0037 (lodged within the extremes of the current weekly supply). So this level is certainly somewhere to keep an eyeball on this week!
Our suggestions: As we mentioned in yesterday’s report, our team is bullish this pair until parity (1.0000) comes into view due to both the daily and H4 structure at present (see above). In support of this, we can also see that the USDX (a highly correlating market with the Swissy) is currently trading from a notable H4 support at 95.12. Also, with our analysis over on the EUR/USD chart indicating shorts may be the best bet, longs, at least to us, make more sense for now. Therefore, if one is able to spot a lower timeframe buy setup from the current H4 demand, it may be worth a shot, targeting 0.9950 and closing the remainder at parity which is seen just below the aforementioned daily Quasimodo resistance (for confirming techniques please see the top of this report). The reason for requiring confirmation here is simply due to weekly price now tickling the underside of weekly supply (see above).
In regards to selling this market, we really like the daily Quasimodo resistance at 1.0037 coupled with parity as a sell zone, which let’s not forget is also housed within the extremes of the above said weekly supply. As such, it may be an idea to note this zone down for future use.
Levels to watch/live orders:
- Buys: 0.9862-0.9884 [Tentative – confirmation required] (Stop loss: dependent on where one confirms this area).
- Sells: 1.0037/1.0000 [Tentative – confirmation required] (Stop loss: dependent on where one confirms this area).
DOW 30:
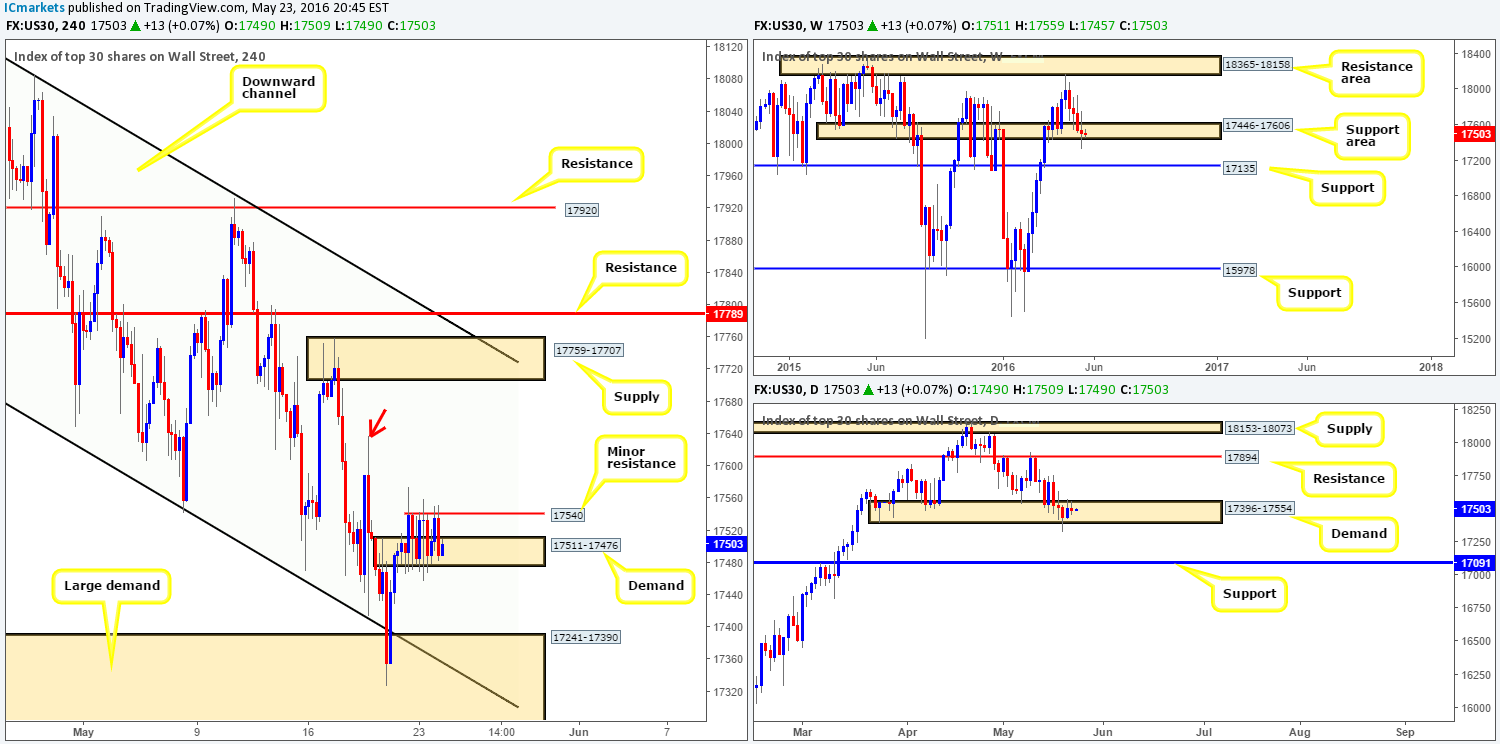
Since the DOW broke above H4 supply at 17511-17476 on Friday, this unit has entered into a phase of chop using the broken area (now demand) as support. We really feel for those caught up in this!
Should the buyers manage to close above minor H4 resistance at 17540 today, there may be a possible long trade up for grabs if price retests the broken line as support followed with a lower timeframe buy setup (for details on possible lower timeframe entries, please see the top of this report). First take-profit target would be the H4 high marked with a red arrow at 17637 and then H4 supply at 17759-17707.
The reason for requiring confirmation here, other than the fact to avoid being taken out on a whipsaw, is down to the higher-timeframe structure. The weekly support area at 17446-17606, although holding, is not registering much buying activity at the moment. Similar to the weekly chart, daily demand at 17396-17554, which is also holding, is not demonstrating much in the way of buying strength right now. Therefore, trade this market with caution guys as the floor looks like it may give way anytime soon.
Levels to watch/live orders:
- Buys: Watch for price to consume 17540 and look to trade any retest seen thereafter (lower timeframe confirmation required).
- Sells: Flat (Stop loss: N/A).
GOLD:
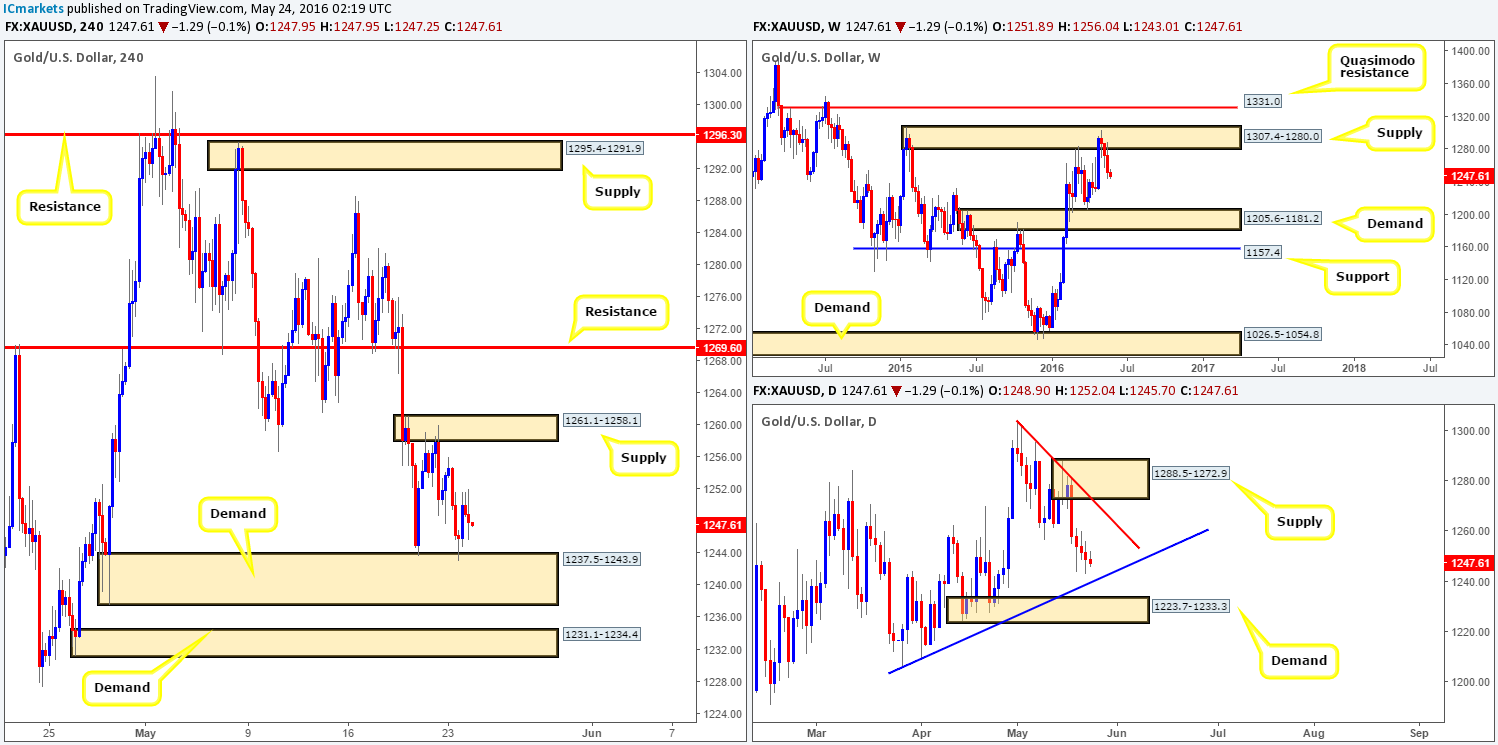
Reporting directly from the weekly timeframe this morning, the yellow metal continues to portray a relatively strong bear market. Since price came into contact with weekly supply seen at 1307.4-1280.0 three weeks ago, gold has recorded three straight losing weeks! In view of this, we firmly believe the next downside target sits around weekly demand coming in at 1205.6-1181.2 which has already bounced price twice already (22/02/16 – 28/03/16), so further selling could be on the cards.
Sliding down to the daily chart, bearish momentum appears to be diminishing, just ahead of a daily trendline support taken from the low 1205.4. Directly below this line also stands a daily demand base drawn from 1223.7-1233.3, which held this market higher once already back in April. Both of these barriers could very well bounce price this week, but to say that either is a reversal point is not really something we would agree with due to what we’ve seen weekly price do over the past three weeks (see above).
Looking over to the H4 chart, gold tagged in bids around H4 demand at 1237.5-1243.9 going into the early hours of yesterday’s American session, consequently pushing price to highs of 1252.0 by the close. This area alongside the small H4 demand base at 1231.1-1234.4 are, as we mentioned in yesterday’s report, very interesting zones. The upper H4 demand fuses beautifully with the aforementioned daily trendline, and the lower base also sits within daily demand coming in at 1223.7-1233.3.
Our suggestions: Although we believe this market is headed lower, price can and will likely bounce from both of the above said H4 demand zones due to each joining together with higher-timeframe areas (see above). Therefore, for now, our team will continue watching both of these H4 barriers for potential trades into this market (we missed yesterday’s move from the H4 demand at 1237.5-1243.9 unfortunately).
Once again, however, please bear in mind that WE ARE NOT placing pending orders at these zones and will only enter from either base upon satisfactory lower timeframe price action. This could be either a lower timeframe supply engulf and return, a trendline break/retest or simply a collection of buying tails around lower timeframe support or better still at the extremes of the higher-timeframe zone itself.
Levels to watch/live orders:
- Buys: 1237.5-1243.9 [Tentative – confirmation required] (Stop loss: dependent on where one confirms this area). 1231.1-1234.4 [Tentative – confirmation required] (Stop loss: dependent on where one confirms this area).
- Sells: Flat (Stop loss: N/A).


