
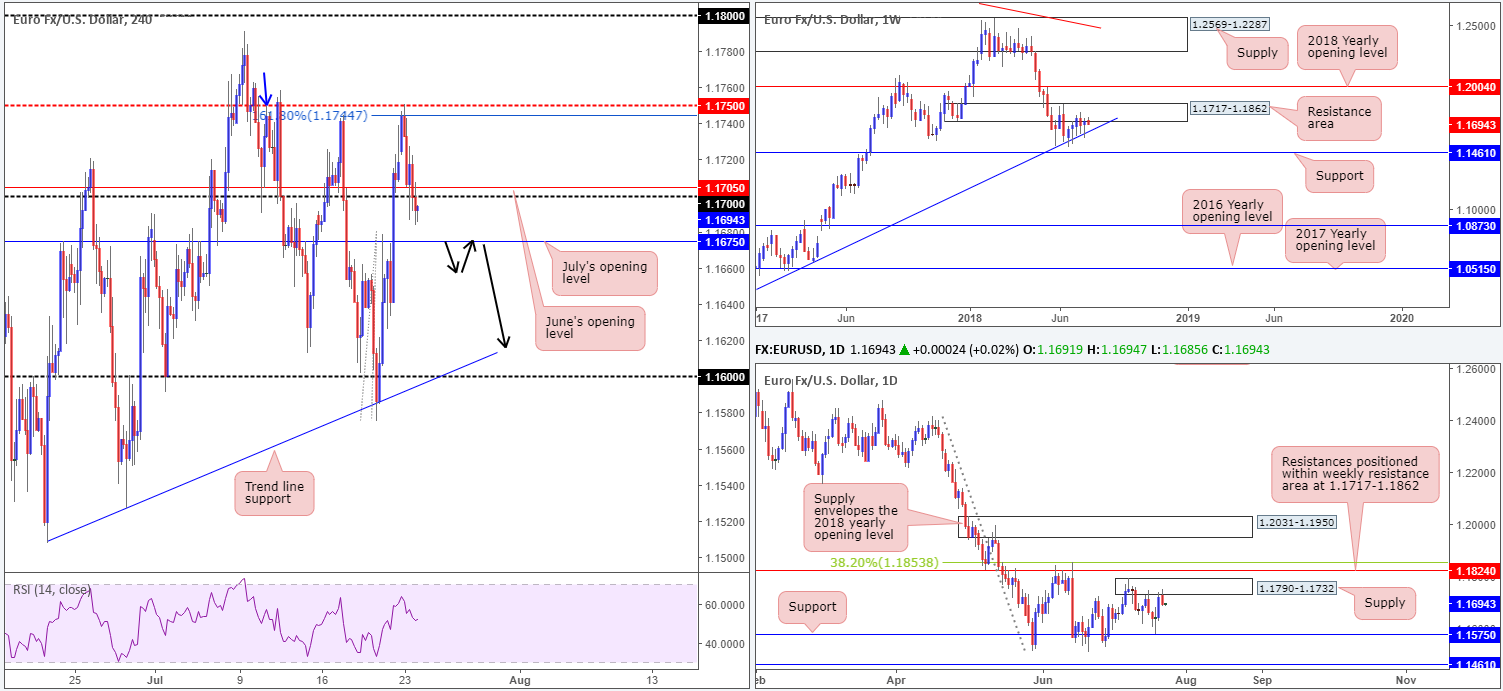
EUR/USD:
H4 mid-level resistance at 1.1750 elbowed its way into the spotlight amid early trade on Monday. Note this level also happens to represent a Quasimodo resistance (taken from the left shoulder marked with a blue arrow) and a 161.8% H4 Fib ext. point at 1.1744. A robust dollar (impetus coming from rebounding US Treasury yields) guided the single currency lower from 1.1750 throughout yesterday’s session, breaking through June’s opening level on the H4 timeframe at 1.1705 and the 1.17 handle. The move, as you can see, left H4 candles eyeing nearby support in the form of July’s opening level at 1.1675.
From the higher timeframes, we’re seeing some selling interest appear from the underside of a weekly resistance area priced in at 1.1717-1.1862. Further downside from here has the nearby weekly trend line support (etched from the low 1.0340) to target. A little lower on the curve, daily supply at 1.1790-1.1732 was brought into the fray yesterday. A selloff from here may call for a retest of daily support at 1.1575.
Areas of consideration:
With both weekly and daily timeframes indicating a potential downward move, a break of June’s opening level (H4) mentioned above at 1.1675 may be of interest to some traders, given room on the H4 scale beneath this number to probe as far south as the trend line support (taken from the low 1.1508) and 1.16 handle.
An ideal scenario, as far as technical setups go, would be for a H4 close to form beneath 1.1675 that’s followed up with a retest in the shape of a full or near-full-bodied H4 bear candle (sell on the close of the candle with stops above the wick).
Today’s data points: Eurozone flash manufacturing PMIs.
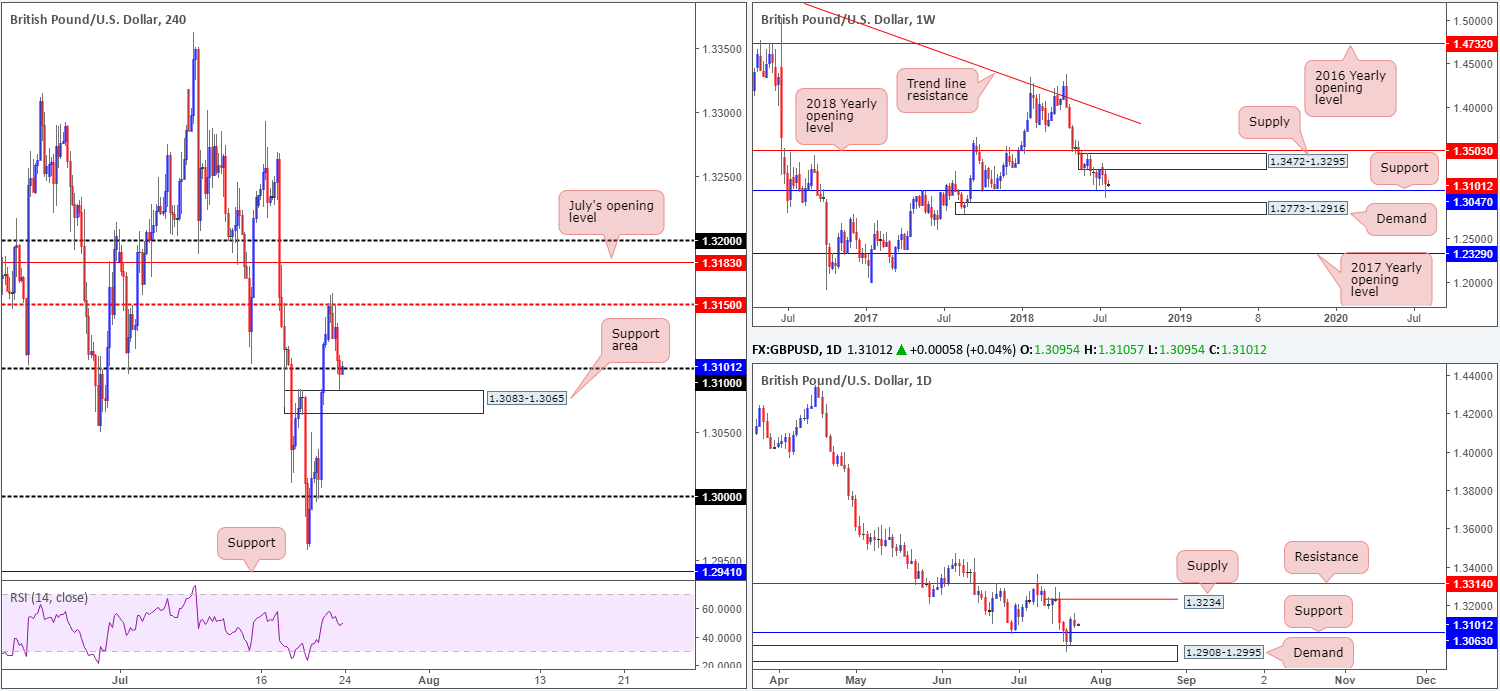
GBP/USD:
Kicking off with a look at the weekly timeframe this morning, the market witnessed a reasonably solid response take shape last week off support penciled in at 1.3047, despite suffering a whipsaw to lows of 1.2957. Failure to hold this level would likely lead to a test of demand at 1.2773-1.2916, while upside has supply on its radar at 1.3472-1.3295.
A closer look at price action on the daily timeframe brings demand at 1.2908-1.2995 into the picture, which held the GBP higher on Friday and broke through nearby resistance at 1.3063 (now acting support). The next upside target on this scale falls in at supply drawn from 1.3234.
Across on the H4 timeframe, traders observed a modest uptick form in Asia on Monday, pulling the unit to mid-level resistance at 1.3150. Amid a broad USD recovery and another round of negative Brexit headlines, the GBP/USD eased lower, consequently surpassing the 1.31 handle and testing the top edge of a nearby support area at 1.3083-1.3065.
Areas of consideration:
Should we see daily price retest support at 1.3063 today, or even weekly price retest support at 1.3047, this will lead to a fakeout, or even the removal of the current H4 support area at 1.3083-1.3065. Therefore, given a retest of the daily support is highly likely to be seen, traders should remain cognizant of the possible move and protect themselves accordingly in terms of stop-loss placement.
In terms of high-probability areas to trade, there is little that jumps out at us this morning. As such, we have labelled this market as flat this morning.
Today’s data points: Limited.
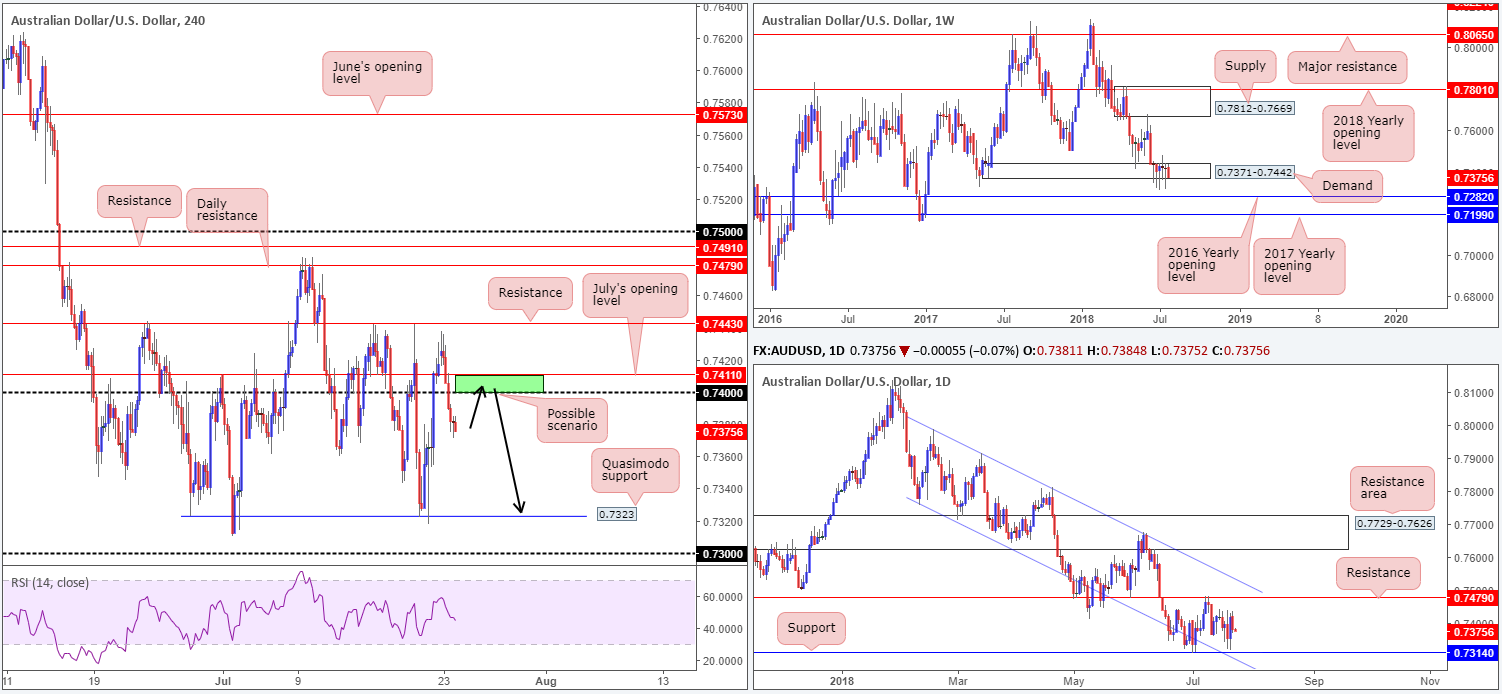
AUD/USD:
The commodity-linked currency entered into a defensive mode on Monday just ahead of H4 resistance at 0.7443. As you can see, H4 price fell back below July’s opening level at 0.7411 and the 0.74 handle, amid a broad USD recovery (DXY back above 94.50). From current price, traders likely have their crosshairs fixed on the underside of the 0.74 handle as resistance and the H4 Quasimodo support plotted at 0.7323.
The story over on the bigger picture shows weekly demand at 0.7371-0.7442 remains in a fragile state. Continued indecisiveness here could open the window to a possible test of the 2016 yearly opening level at 0.7282 sometime down the road. In the event that the bulls regain consciousness, however, a retest of supply at 0.7812-0.7669 may be on the cards. Daily activity, on the other hand, is seen hovering between support at 0.7314 and its closely associated channel support (taken from the low 0.7758), and resistance at 0.7479.
Areas of consideration:
A retest to the underside of 0.7411/0.74 (green area on the H4 timeframe) may be of interest to traders this morning, in light of where we are trading on the higher timeframes (see above). A retest of this area in the shape of a full or near-full-bodied H4 bear candle would, in our view, be enough to confirm bearish intent, with the first downside target located at 0.7323: the H4 Quasimodo support mentioned above.
Today’s data points: Limited.
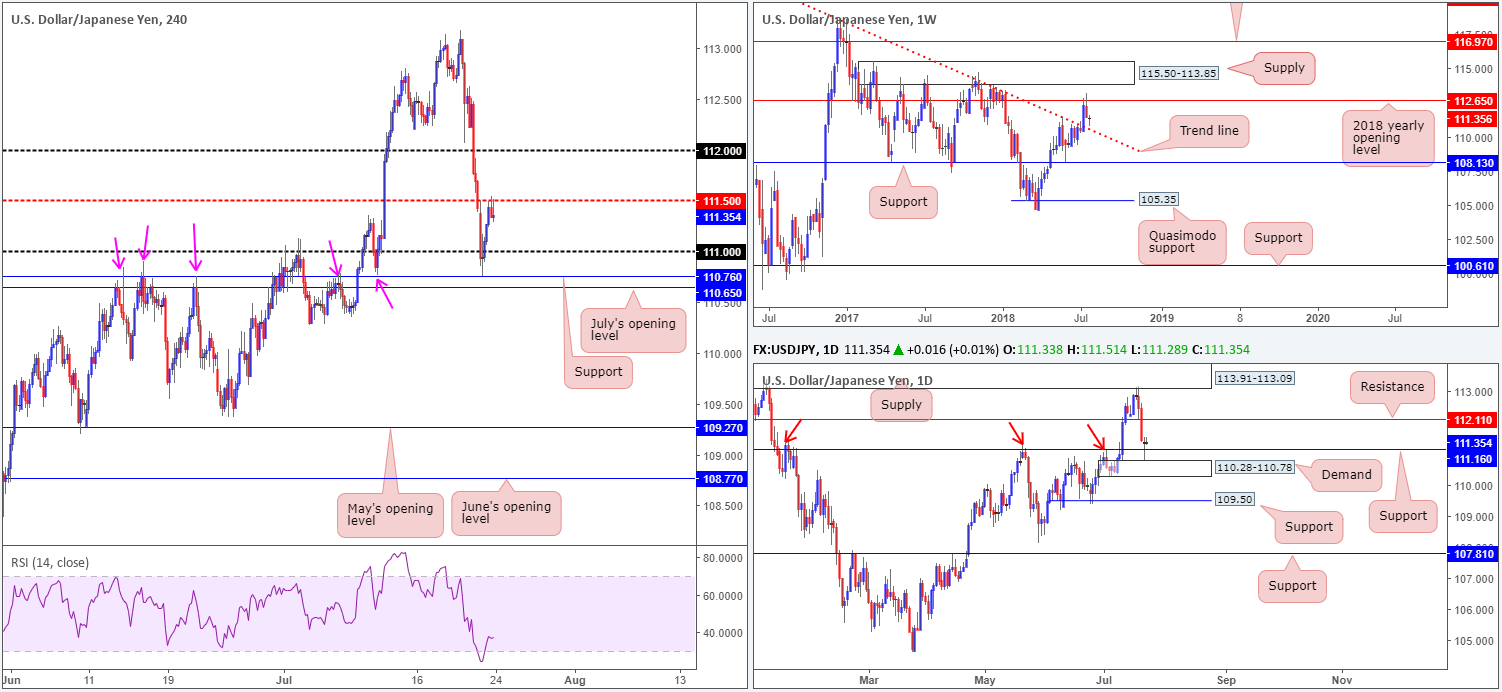
USD/JPY:
The Japanese yen advanced in early Asia on Monday, guiding the USD/JPY beneath the 111 handle to nearby H4 support priced in at 110.76. Having seen 110.76 provide this market with strong support and resistance over the past month, it was no surprise to see the pair print a response from here and reclaim the 111 handle into London trade. Further upside (bolstered by robust US Treasury yields) was also observed in US hours, reaching highs of 111.54 on the day.
Technical movement on the weekly timeframe shows the pair found support just north of trend line resistance-turned support (taken from the high 123.57). Failure to strike this weekly barrier was likely due to daily support at 111.16 and nearby daily demand at 110.28-110.78 entering the fray.
Areas of consideration:
As of writing, the pair is echoing a bullish vibe, as far as we can see. Despite H4 price finding modest resistance off 111.50, let’s remember what we have on the daily and weekly timeframes supporting this market!
On account of this, there are two scenarios worthy of watching:
- A retest of the 111 handle as support for a possible entry long. To help avoid a fakeout to nearby H4 support mentioned above at 110.76, consider waiting for H4 price to print a full or near-full-bodied bull candle before pulling the trigger (stops best set below the rejection candle’s tail). Ultimately traders will want to see 111.50 taken out before reducing risk to breakeven and taking some profits off the table.
- A H4 close above 111.50 that’s followed up with a retest, targeting the 112 handle, followed closely by daily resistance 112.11 (the next upside target on the daily scale).
Today’s data points: Limited.
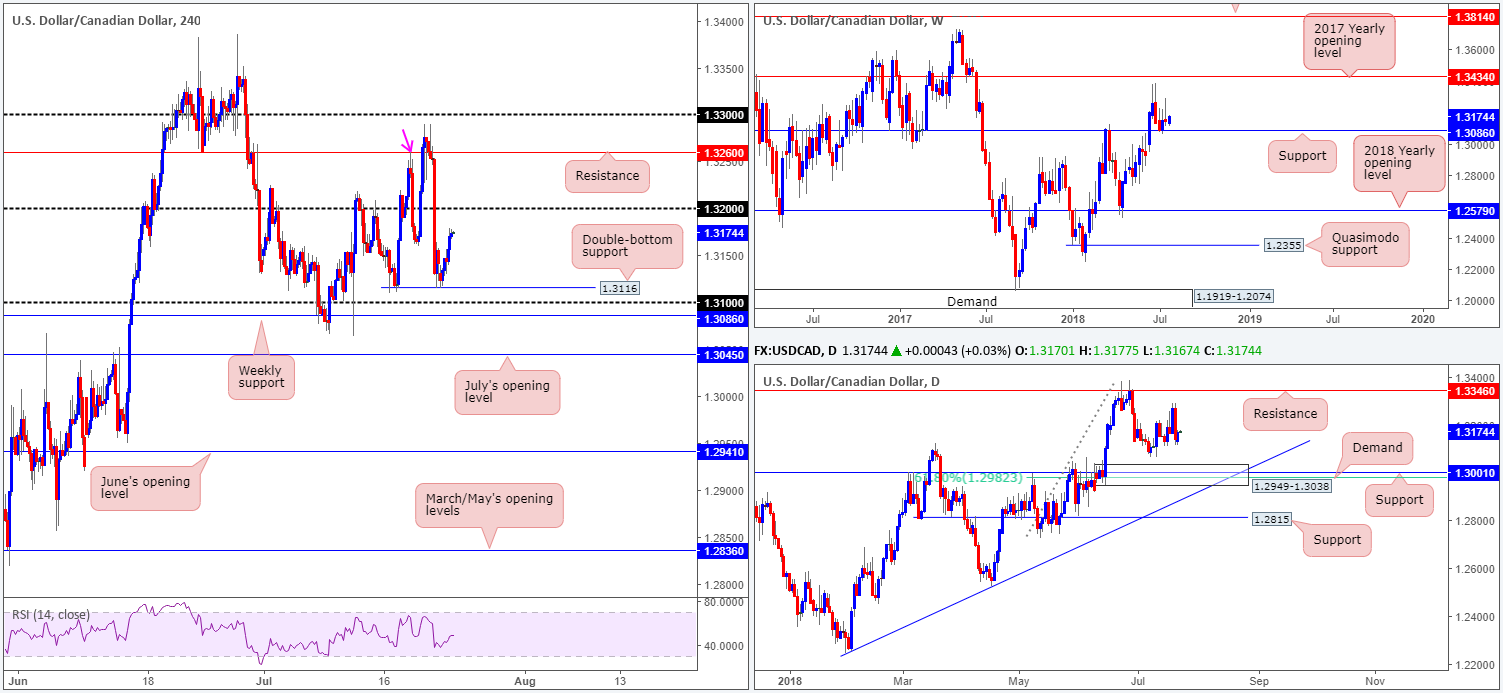
USD/CAD:
Monday’s movement witnessed increased demand for the USD, following the formation of a H4 double-bottom support at 1.3116. Additional buying seen from this point has the 1.32 handle to target. A break beyond here likely suggests a test of the H4 resistance level at 1.3260 (note this level also represents a Quasimodo resistance taken from the left shoulder marked with a pink arrow), shadowed closely by the 1.33 handle.
Weekly support at 1.3086 remains a focal point in this market. Having seen this level provide strong support and resistance over the years, overlooking this hurdle would be unwise. Areas of interest on the daily timeframe can be seen at demand drawn from 1.2949-1.3038. Within this area we also see support standing at 1.3001 along with the 61.8% daily Fib support at 1.2982. To the upside we see resistance plotted at 1.3346.
Areas of consideration:
Focusing on the H4 timeframe for just a moment, buyers are likely to continue pushing northbound today, at least until we reach the 1.32 handle.
Another possibility, however, is a selloff from current price (or even the 1.32 handle) and a break the 1.31 handle to tackle weekly support at 1.3086, as there are likely a truckload of willing buyers situated around this region. This would be an ideal location to be looking for longs.
Today’s data points: Limited.
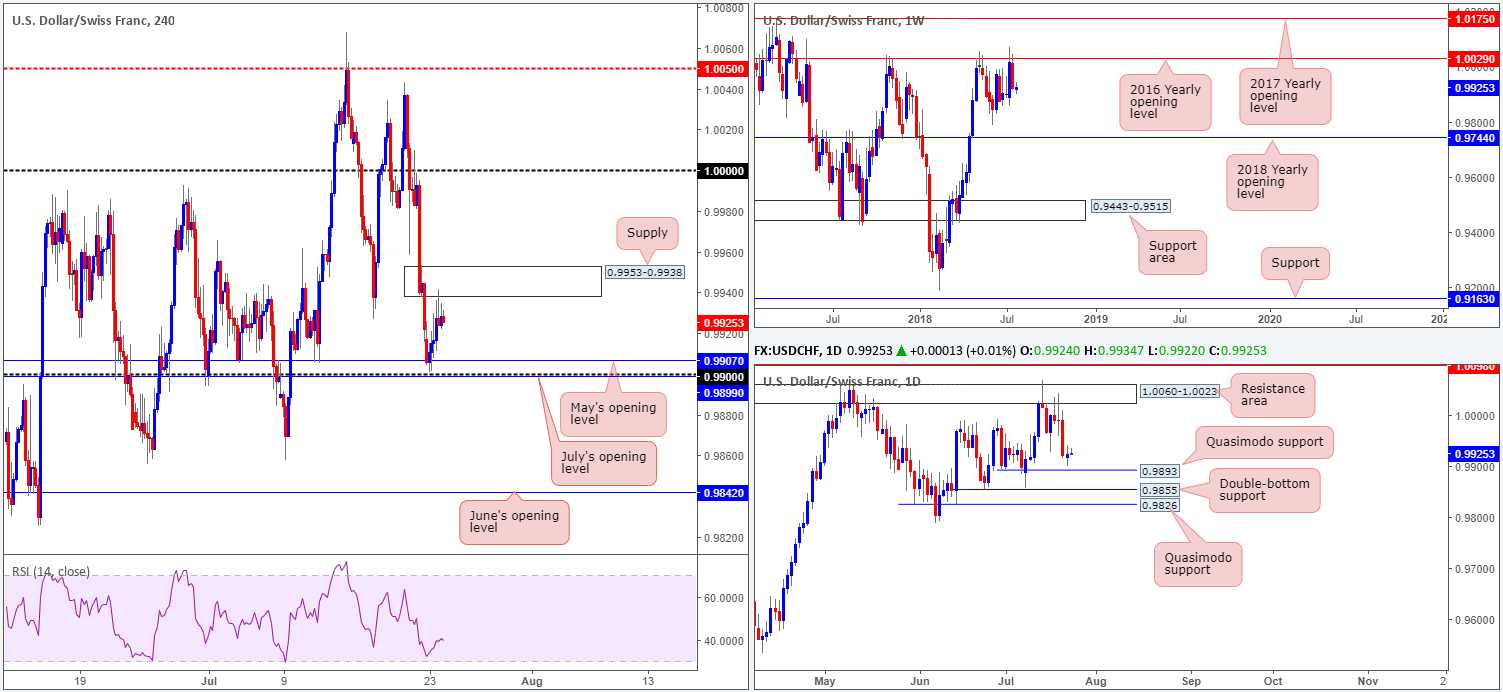
USD/CHF:
Beginning from the top this morning, weekly price remains capped by the 2016 yearly opening level at 1.0029. Additional resistance is seen beyond this line at 1.0175: the 2017 yearly opening level, whereas below 1.0029 we have June lows at 0.9788 to target, as well as the 2018 yearly opening level at 0.9744. Turning the focus to the daily timeframe, we can see the unit hovering just north of Quasimodo support at 0.9893. Note the additional layer of supports seen directly below at 0.9855 (a double-bottom formation) and another Quasimodo support at 0.9826.
A quick recap of Monday’s movement on the H4 timeframe reveals price action marginally whipsawed through May’s opening level at 0.9907, just missing the 0.99 handle by a hair, before turning positive. Fresh supply at 0.9953-0.9938 was brought into the fray amid US hours and so far has held ground. Above this area, not a whole lot of resistance is visible until around parity (1.0000).
Areas of consideration:
A rejection from the current H4 supply zone will likely lead to a fakeout of 0.99 to tackle the daily Quasimodo support mentioned above at 0.9893. This is an area traders should have bookmarked as a possible reversal zone for longs.
Continued buying, however, as mentioned above, has parity to target on the H4 scale. A decisive H4 close above the current supply that’s followed up with a retest as support would, in our view, be sufficient enough to confirm bullish intent.
Today’s data points: Limited.
Dow Jones Industrial Average:
US equities concluded trade mixed on Monday, with the H4 candles seen hovering between support at 24891 and the resistance area parked at 25138-25068. In recent hours, however, the market has pushed north and entered into the jaws of the said resistance zone. A decisive push above this area immediately has July 19 highs at 25191 to contend with, followed then by Quasimodo resistance at 25324.
The other key thing to note in this market is weekly price is seen nearing trend line resistance (etched from the high 25807). This level will likely hinder H4 price from reaching the noted Quasimodo resistance. On the daily timeframe, nevertheless, it appears we have a clear run to resistance at 25418.
Areas of consideration:
Buying this market is tricky. Not only do we have the current H4 resistance area in play right now, we also have a weekly trend line resistance lurking just above it!
In view of this, the team has noted to keep eyes on how H4 price behaves once/if we touch the top edge of the H4 resistance zone, given there’s also a H4 AB=CD completion point seen just above it at 25154 (pink arrows). A H4 full or near-full-bodied bearish candle printed from this region (that brings in the weekly trend line resistance) is a high-probability sell signal that’ll likely strike at least the H4 support mentioned above at 24891.
Today’s data points: Limited.

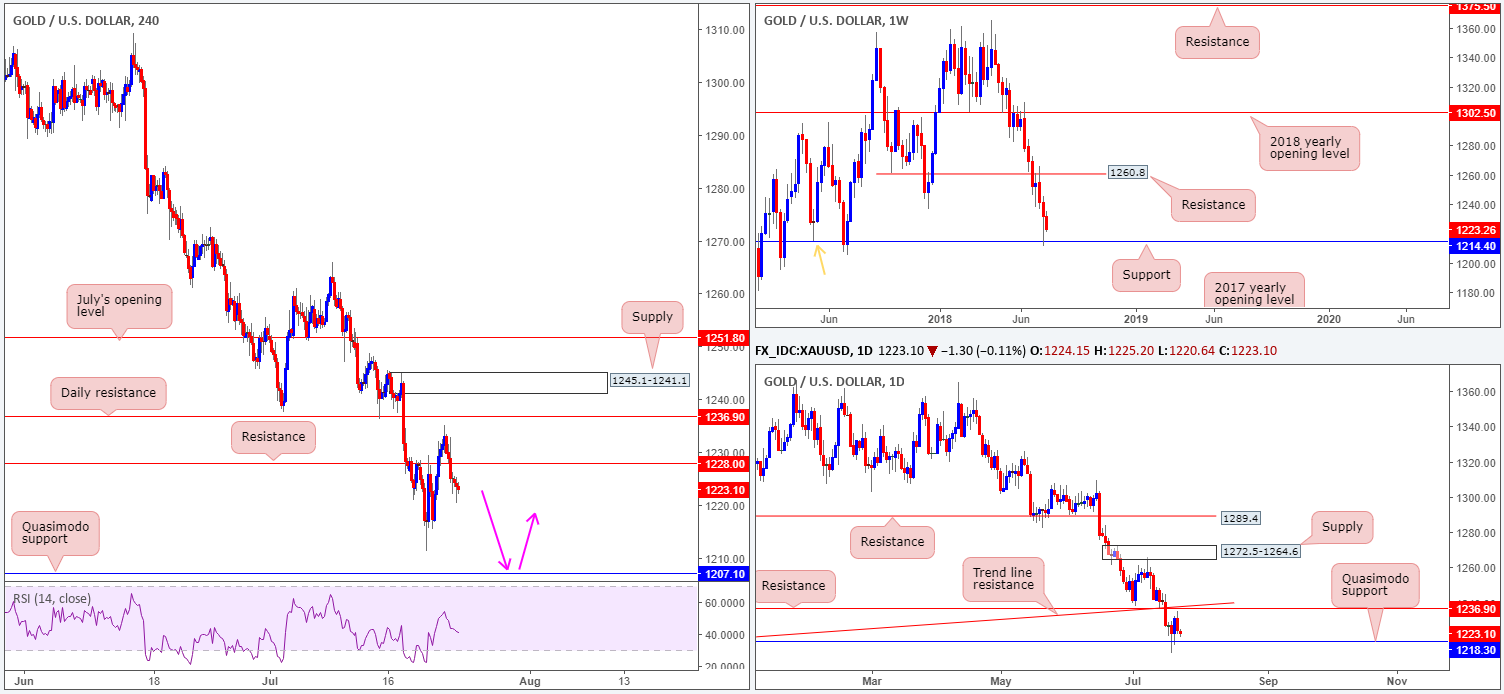
XAU/USD (Gold)
Longer term, bullion is seen testing weekly support drawn from 1214.4. The level also represents a weekly Quasimodo support taken from the left shoulder marked with an orange arrow. Movement on the daily timeframe, nonetheless, shows price action sandwiched between resistance at 1236.9 and a Quasimodo support at 1218.3.
Zooming in for a closer look at the H4 timeframe reveals price came within striking distance of daily resistance mentioned above at 1236.9 before turning lower on Monday. USD strength forced the yellow metal back beneath H4 support at 1228.0 (now acting resistance), exposing Thursday’s low at 1211.2, followed closely by H4 Quasimodo support at 1207.1. A level taken from July 2017!
Areas of consideration:
Although H4 price indicates further downside may be on the cards, entering into short positions is a chancy move knowing the bigger picture is hovering nearby supports.
However, should the market test the noted H4 Quasimodo support level and hold in the shape of a full or near-full-bodied H4 bull candle this would, according to the technicals, be a high-probability long as it is in line with higher-timeframe flows. As usual, stop-loss orders are best placed beyond the rejection candle’s tail.
The use of the site is agreement that the site is for informational and educational purposes only and does not constitute advice in any form in the furtherance of any trade or trading decisions.
The accuracy, completeness and timeliness of the information contained on this site cannot be guaranteed. IC Markets does not warranty, guarantee or make any representations, or assume any liability with regard to financial results based on the use of the information in the site.
News, views, opinions, recommendations and other information obtained from sources outside of www.icmarkets.com.au, used in this site are believed to be reliable, but we cannot guarantee their accuracy or completeness. All such information is subject to change at any time without notice. IC Markets assumes no responsibility for the content of any linked site. The fact that such links may exist does not indicate approval or endorsement of any material contained on any linked site.
IC Markets is not liable for any harm caused by the transmission, through accessing the services or information on this site, of a computer virus, or other computer code or programming device that might be used to access, delete, damage, disable, disrupt or otherwise impede in any manner, the operation of the site or of any user’s software, hardware, data or property.


