
Key risk events today:
Limited.
EUR/USD:
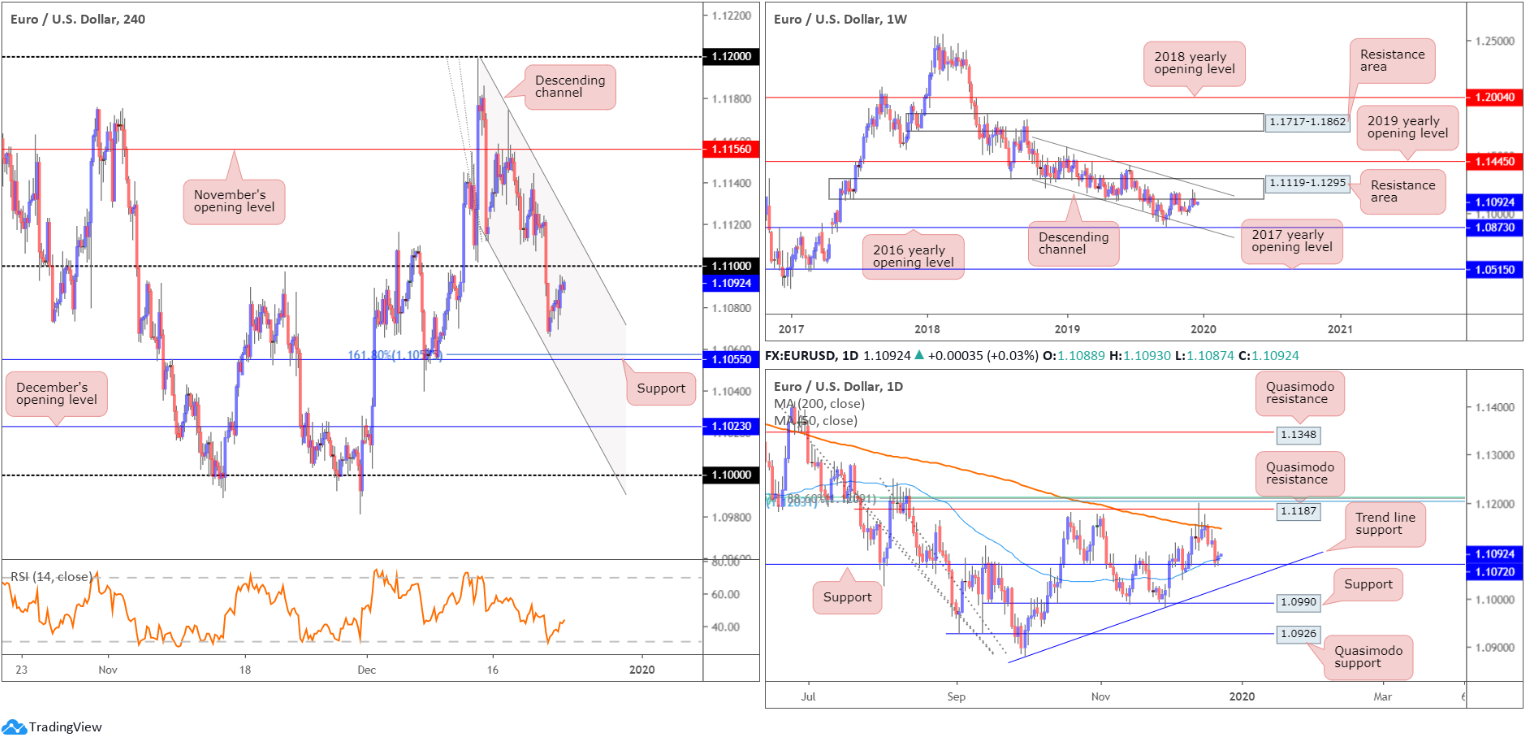
The euro finished a shade higher against the greenback Monday, consequently clipping a portion of Friday’s losses. On the data front, US durable goods orders and sales of new single‐family houses in November 2019 announced less-than-stellar figures, prompting an intraday top in the US dollar index at 97.82. Overall, though, the DXY concluded the day unmoved.
Following yesterday’s movement, H4 price is on course to shake hands with the underside of the 1.11 handle, with a break of this barrier revealing nearby channel resistance, extended from the high 1.1199. To the downside, traders’ crosshairs likely remain fixed on support coming in at 1.1055, as well as the 161.8% Fibonacci extension at 1.1057. In terms of the relative strength index (RSI), the indicator recently crossed above its 50.0 value (indicates a potentially strengthening market), following a decisive rotation out of oversold territory.
On a wider perspective, structure remains pretty much unchanged:
Technical research has weekly movement capped south of a long-standing resistance area at 1.1119-1.1295, which intersects closely with channel resistance, extended from the high 1.1569. Visible downside objectives on this timeframe fall in at the 2016 yearly opening level at 1.0873 and channel support, taken from the low 1.1109.
A closer reading of price action on the daily timeframe reveals the 200-day SMA (orange – 1.1146) held price lower last week. EUR/USD, however, settled recent trade a touch off support drawn from 1.1072, which aligns closely with a 50-day SMA (1.1083). Levels beyond this base fall in at a trend line support, etched from the low 1.0942, support at 1.0990 and Quasimodo support at 1.0926.
Areas of consideration:
Although in line with weekly structure, a short sale from 1.11, or even the current H4 channel resistance, is chancy. Buyer intent evident from daily support at 1.1072, and its accompanying 50-day SMA, is likely enough to deter sellers. However, with added confirmation such as a H4 bearish candlestick pattern (entry and risk levels can be determined according to the pattern’s rules of engagement), 1.11, or the noted channel resistance, could still be worthy contenders for potential selling opportunities.
As we head into the Christmas holidays, liquidity is likely to be thin going forward. Traders are urged to bear this in mind before committing to a position.
GBP/USD:
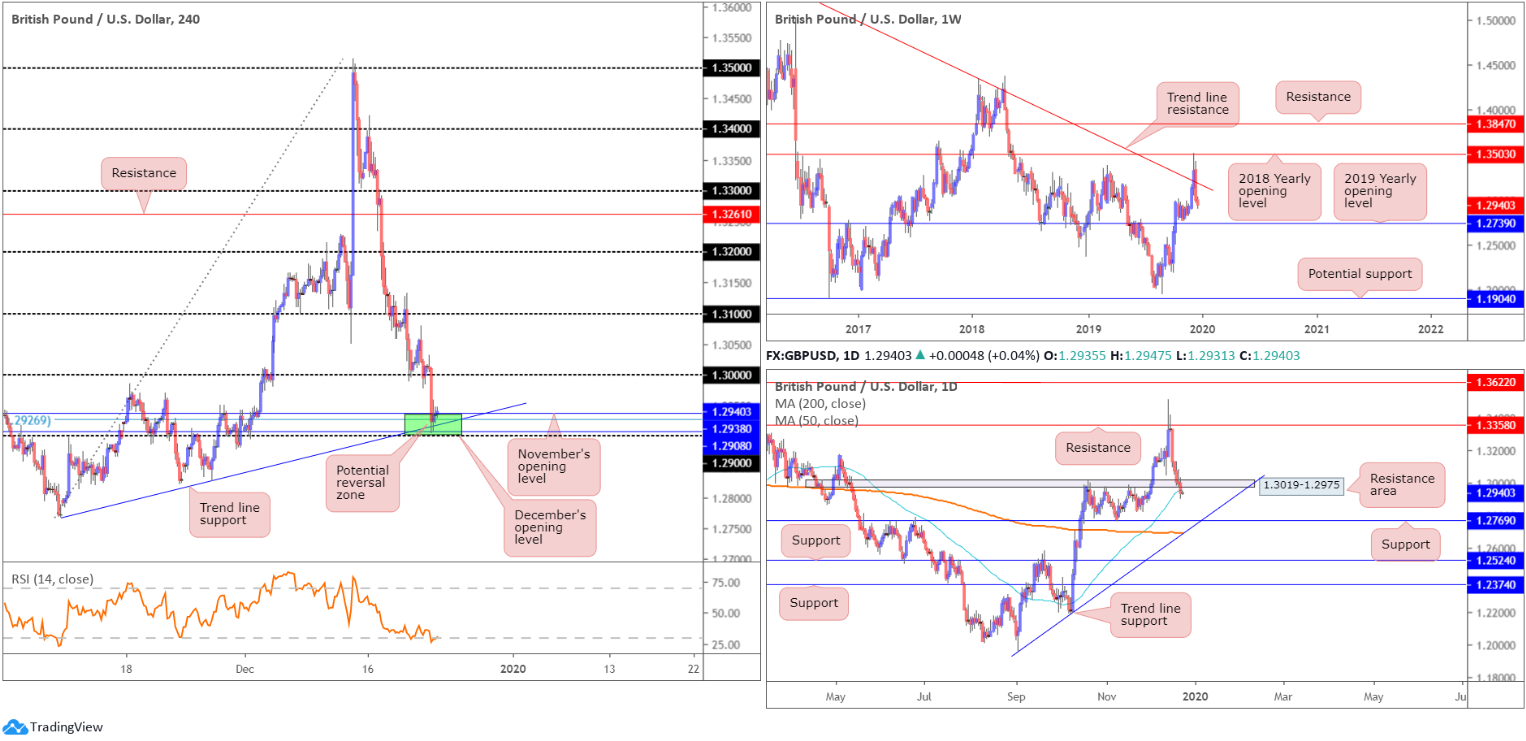
GBP/USD sellers continued to govern movement on Monday, down nearly half-a-percent on the session. The key figure 1.30 gave way in strong fashion, leading to a test of a particularly interesting area of support on the H4 timeframe between 1.29/1.2938 (comprised of December’s opening level at 1.2908, a Fibonacci retracement ratio at 1.2926, a trend line support, taken from the low 1.2768, and a round number at 1.29). Indicator-based traders may also wish to note the relative strength index (RSI) is seen trading within oversold territory.
Weekly price reclaimed GE-related gains last week as sellers strengthened their grip and snapped a three-week winning streak. After topping at the 2018 yearly opening level drawn from 1.3503 the week prior, price crossed back through long-standing trend line resistance, pencilled in from the high 1.5930. Down more than 300 points, the move highlights a possible approach towards the 2019 yearly opening level at 1.2739.
Technical movement on the daily timeframe concluded Monday south of a familiar support area at 1.3019-1.2975 (now serving as a resistance area). Traders may also have their crosshairs fixed on the 50-day SMA (blue – 1.2958). Further selling this week may lead to support at 1.2769 entering the fray, sited close by a trend line support, taken from the low 1.1958, and the 200-day SMA (orange – 1.2689).
Areas of consideration:
The H4 support area 1.29/1.2938, given the mild reaction seen, is likely of interest this morning for buying opportunities. However, while on the H4 timeframe a reasonably clear run to 1.30 is visible, selling interest at the underside of the recently broken daily support area at 1.3019-1.2975 may be problematic. In addition, weekly price, according to the chart studies presented here, suggests further downside is possible.
Interestingly, a H4 inside candlestick formation recently formed within 1.29/1.2938, which may be taken as a bullish signal. At the same time, though, this could simply have formed due to low volatility as we head into the Christmas break.
As we head into the Christmas holidays, liquidity is likely to be thin going forward. Traders are urged to bear this in mind before committing to a position.
AUD/USD:
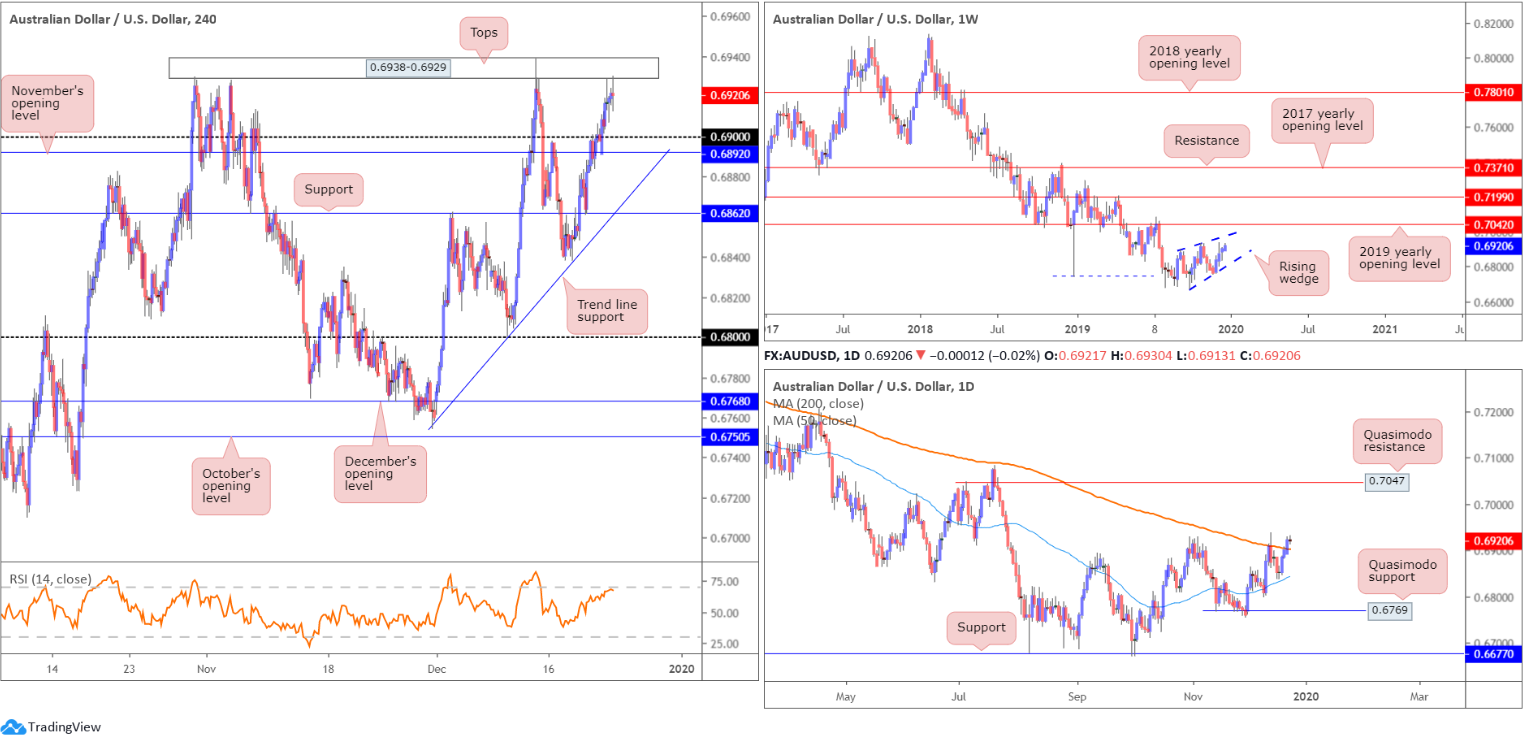
The Australian dollar outpaced its G10 rivals Monday, jostling for top spot having made a firm breach of the 0.69 handle. H4 price, however, is now seen testing tops around the 0.6938-0.6929 region, which could prove problematic for buyers as we head into the festive period. Beyond here, traders likely have the key figure 0.70 in sight. The relative strength index (RSI), for those who follow indicators, will notice the value recently touched gloves with its overbought level.
As for the weekly timeframe, since registering a bottom in late September at 0.6670, the candles have been busy carving out what appears to be a rising wedge formation, typically considered a continuation pattern. As the 2019 yearly opening level at 0.7042 is seen fast approaching, the aforementioned rising wedge could potentially continue compressing until connecting with this angle. The primary downtrend, visible from this timeframe, has also been in play since early 2018, consequently adding weight to a breakout south possibly emerging.
The story on the daily timeframe reveals the unit engulfed the 200-SMA (orange – 0.6902) yesterday, potentially setting the long-term stage to Quasimodo resistance at 0.7047. This is the first close above the said SMA since April 2019.
Areas of consideration:
H4 tops around 0.6938-0.6929 are likely to hamper further upside into Christmas, despite the recent close above the 200-day SMA.
A retest of 0.69 (which aligns closely with the 200-day SMA) may prompt intraday buying, though a fakeout to November’s opening level is highly likely. Therefore, additional confirmation is certainly something to consider before pulling the trigger.
As we head into the Christmas holidays, liquidity is likely to be thin going forward. Traders are urged to bear this in mind before committing to a position.
USD/JPY:
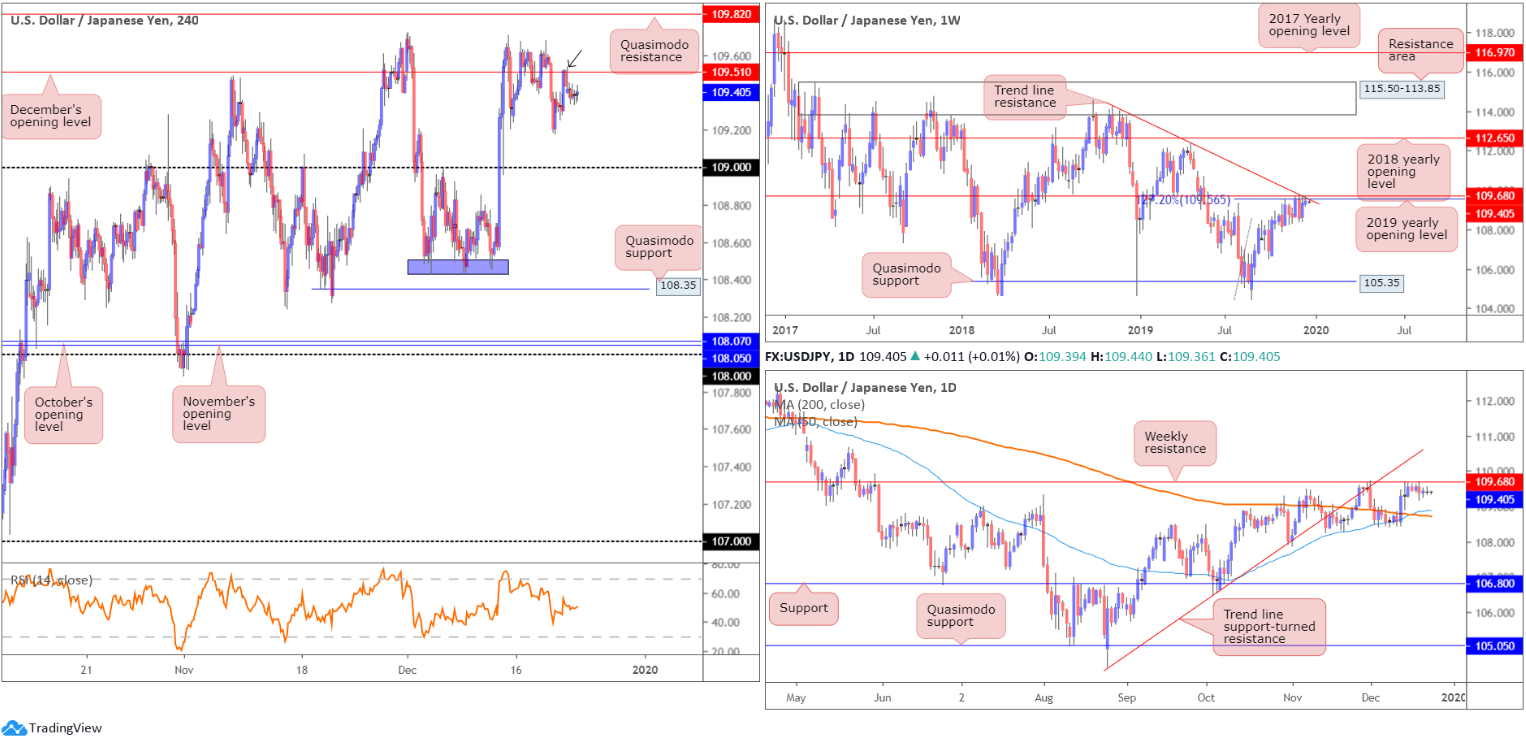
USD/JPY failed to cheer mildly positive comments from the BoJ minutes in recent hours.
As evident from the H4 timeframe, the pair finished Friday retesting the underside of December’s opening level at 109.51, approached in the shape of an intraday ABCD correction. While price remains flagging south of this barrier this morning, traders are urged to pencil in the possibility of a run north to draw in sellers from Quasimodo resistance at 109.82.
USD/JPY remains languishing below notable resistances on the weekly timeframe, comprised of a 127.2% Fibonacci extension at 109.56 (taken from the low 104.44), the 2019 yearly opening level at 109.68 and trend line resistance, extended from the high 114.23. Aside from the 106.48 September 30 swing low, limited support is evident until shaking hands with Quasimodo support at 105.35. A break north, however, highlights the 2018 yearly opening level at 112.65 as the next possible layer of resistance. In regards to the market’s primary trend, the pair has been entrenched within a long-term range since March 2017, spanning 115.50/105.35.
Daily action is also seen crossing swords with the said weekly resistances. The difference on this scale, nonetheless, is the downside targets. The 200/50-day SMAs (orange – 108.72/blue – 108.89) rest as potential support. Interestingly, the 50-day SMA crossed above the 200-day SMA in recent movement, generally viewed as a bullish indicator (a Golden Cross).
Areas of consideration:
An obvious deduction from current structure would be to look for selling opportunities at December’s opening level drawn from 109.51, targeting the 109 handle. Many traders already likely entered short on the back of the shooting star candlestick formation (black arrow).
Beyond 109, traders’ crosshairs are likely fixed on Quasimodo support at 108.35. Note not only is this considered another take-profit target from 109.82 or 109.51, it is also a location buyers will likely look to enter long from, given the sell stops that will be taken from the lows (purple) around 108.45.
As we head into the Christmas holidays, liquidity is likely to be thin going forward. Traders are urged to bear this in mind before committing to a position.
USD/CAD:
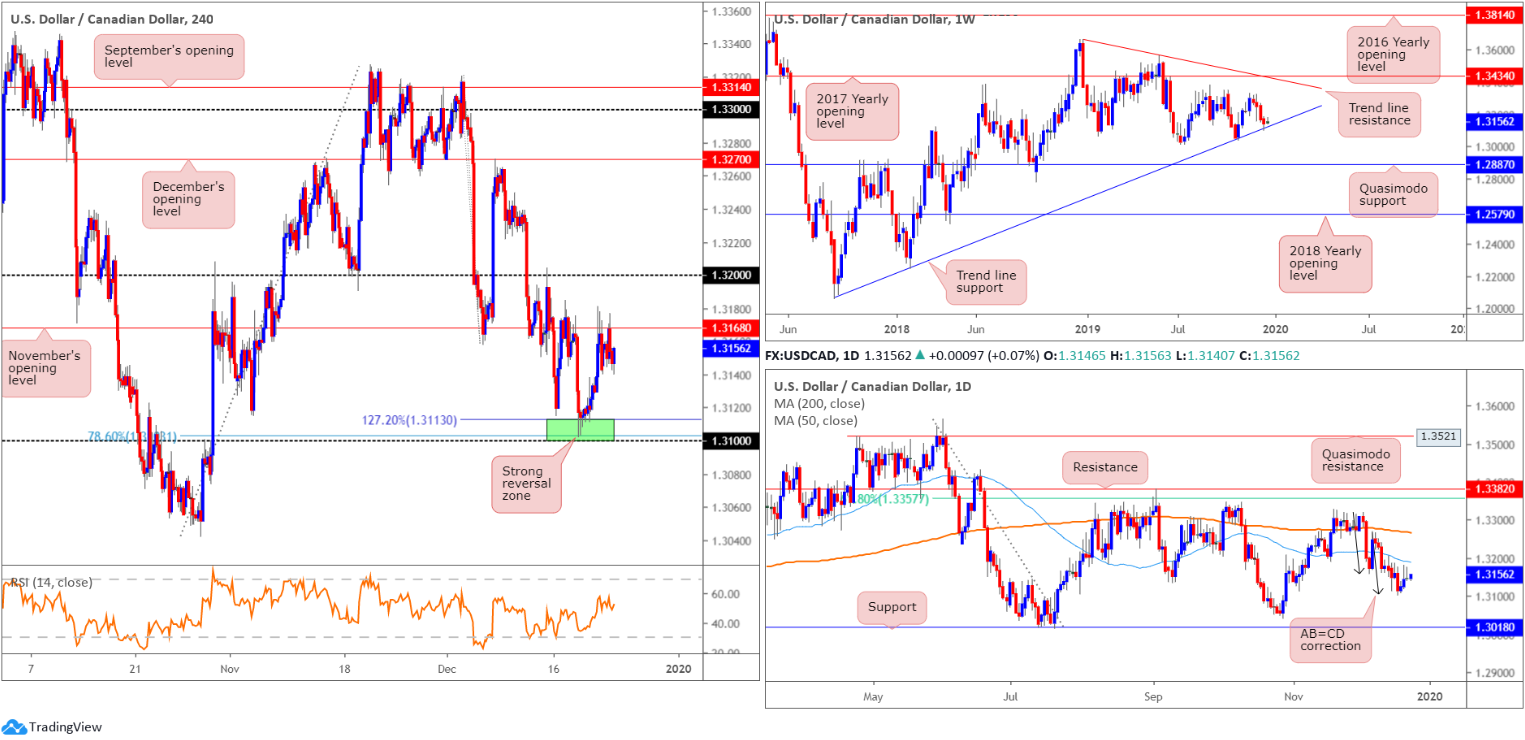
Canada’s economy surprisingly contracted by 0.1% in October, highlighting the first monthly decline since February. Although guiding USD/CAD higher, gains were capped around November’s opening level at 1.3168, based on the H4 timeframe.
Those who read last week’s technical briefings may recall the pieces highlighting 1.31/1.3113 as a reasonably firm area of interest for possible long entries (green – comprised of the round number 1.31, a 78.6% Fibonacci ratio at 1.3103 and a 127.2% Fibonacci extension at 1.3113). The additional component here, also highlighted in previous analysis, is weekly price testing the current long-term trend line support. Well done to any readers who continue to hold longs from here. Risk/reward offered favourable conditions to the first take-profit target at November’s opening level drawn from 1.3168, which was hit Friday.
Meanwhile, weekly price shows USD/CAD recorded its fourth successive losing week, declining more than 20 points on the session. Structurally, nonetheless, trend line support, extended from the low 1.2061, entered the fray which may prompt a round of short covering. Resistance points on the weekly scale are fixed around tops at 1.3320ish, the 2017 yearly opening level at 1.3434 and trend line resistance, taken from the peak at 1.3661. A violation of the current ascending base could lead to Quasimodo support at 1.2887 eventually being brought into view. Overall, though, the immediate trend has faced north since bottoming in September 2017; however, this move could also be considered a deep pullback in a larger downtrend from the 1.4689 peak in early January 2016.
Interestingly, on the daily timeframe, price spent more than three weeks moulding an AB=CD correction (black arrows), which terminated at 1.3105 on Wednesday. Despite boasting limited support on this timeframe, the harmonic pattern continues to hold price higher. Upside objectives from this point are seen around the 50-day SMA (blue – 1.3189), followed by the 200-day SMA (orange – 1.3267). A move lower, on the other hand, has the 1.3042 October 29 low to target, shadowed closely by support at 1.3018.
Areas of consideration:
Traders long from 1.31/1.3113 likely took partial profit at 1.3168 Friday and reduced risk to breakeven. The next take-profit target rests at the 1.32 handle, seen a touch above the 50-day SMA value.
USD/CHF:
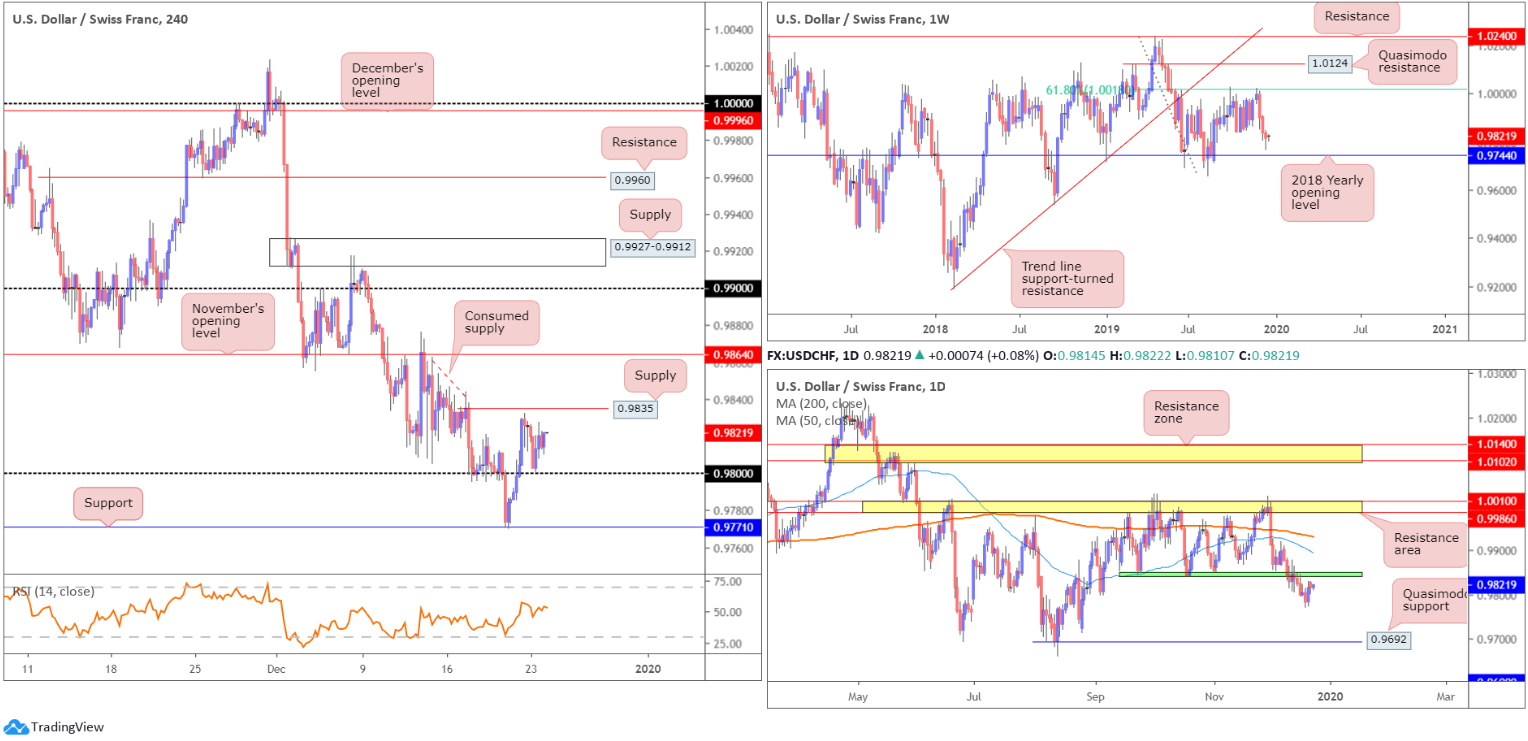
USD/CHF prices wrapped up Monday unchanged, largely unaffected by less-than-stellar US data – durable goods orders and sales of new single‐family houses in November 2019.
The H4 candles remain trading north of the 0.98 handle after coming within a point of retesting the figure amid London hours. Possible supply is close by at 0.9835, while beyond here active supply appears consumed until reaching November’s opening level at 0.9864. Indicator-based traders may wish to acknowledge the relative strength index (RSI) continues to hover north of its 50.0 mid-point value.
Elsewhere, as of mid-June, upside attempts have been capped by a 61.8% weekly Fibonacci retracement ratio at 1.0018. Of late, two decisive bearish candles formed from this Fib base, though momentum diminished last week off lows of 0.9770. Equally impressive is the 2018 yearly opening level at 0.9744. Capping downside since the beginning of the year, this level remains the next support target on the weekly scale, despite last week’s pullback.
The lower edge of a 3-month consolidation at 0.9845ish (green) on the daily timeframe also gave way in recent trading, exposing Quasimodo support at 0.9692 as the next obvious downside target. However, Friday’s stronger-than-expected recovery engulfed a number of bearish candles, closing within striking distance of 0.9845, which should, technically speaking, provide resistance.
Areas of consideration:
Weekly price, despite last week’s late recovery, exhibits room to move lower to 0.9744. In conjunction with this, daily flow is likely to hold at 0.9845ish and push south. For that reason, H4 supply at 0.9835 may be of interest to some traders for short sales. A move beyond here, and focus shifts to November’s opening level at 0.9864 for potential shorts, with the option of positioning protective stop-loss orders above 0.9876. The latter level is the more favourable base, according to chart studies.
As we head into the Christmas holidays, liquidity is likely to be thin going forward. Traders are urged to bear this in mind before committing to a position.
Dow Jones Industrial Average:
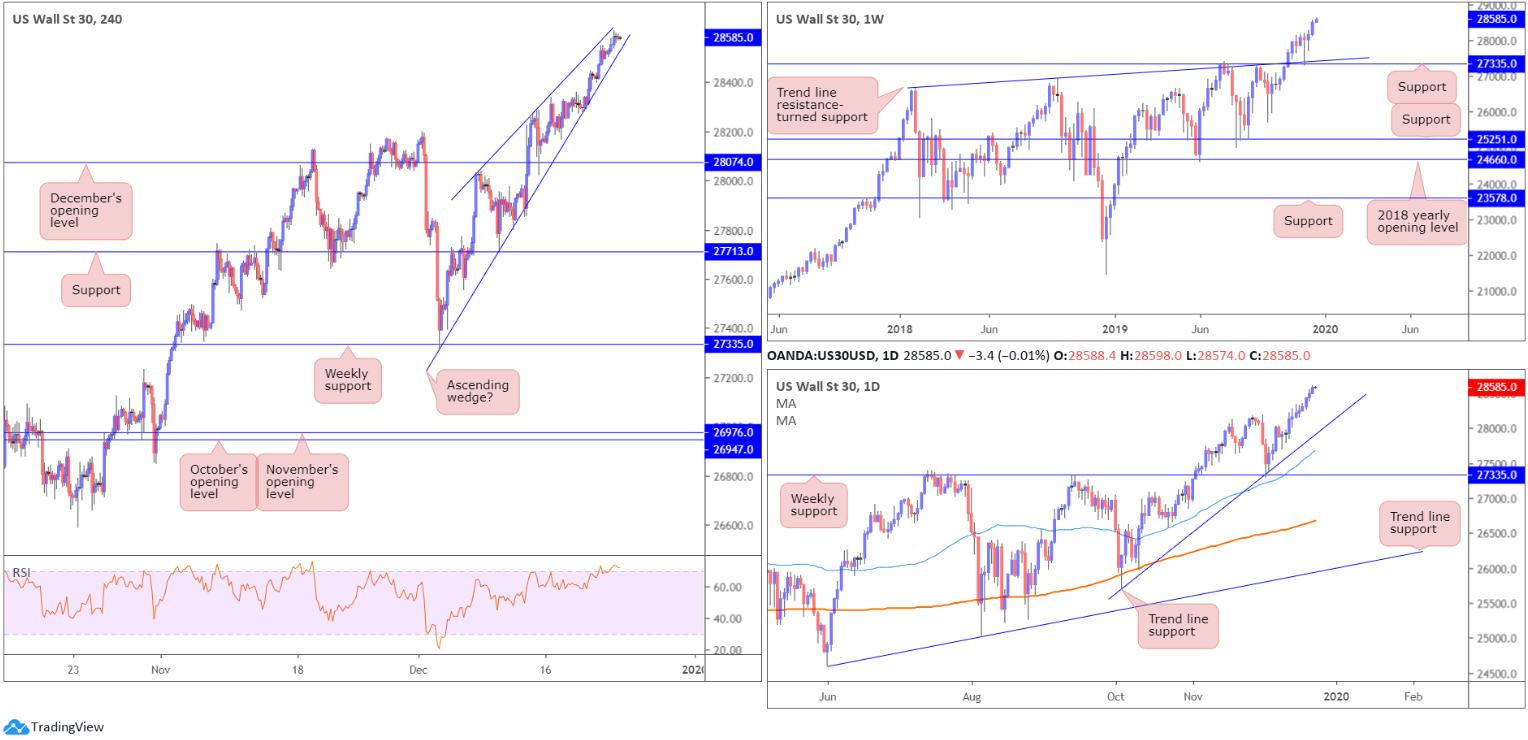
US equities advanced Monday as the year-end rally continued. A jump in Boeing shares drove the Dow Jones Industrial Average to fresh records. The Dow Jones Industrial Average added 96.44 points, or 0.34%; the S&P 500 advanced 2.79 points, or 0.09% and the tech-heavy Nasdaq 100 added 17.52 points, or 0.20%.
According to the H4 timeframe, the technical picture illustrates an ascending wedge formation that’s been in motion since the beginning of December. As evident from the chart, the trend lines are converging, near to the point of crossing. A decisive move lower from here could, therefore, spark a run lower, potentially targeting December’s opening level at 28074. Also worthy of note is the relative strength index (RSI), which trades within overbought territory.
From the weekly timeframe, price continues to reflect strength above support drawn from 27335, along with trend line support etched from the high 26670. As of this chart, further upside is a possibility as is a pullback/retest at 27335. Meanwhile, on the daily timeframe, trend line support, extended from the low 25710, remains intact, bolstered by additional support from the 50-day SMA (blue – 27681).
Areas of consideration:
As the index forms its tenth consecutive daily bullish close, the H4 ascending wedge could eventually prompt a near-term reversal.
Understandably, many traders will not feel comfortable selling this market on a break of the said H4 structure, given its current strength and upcoming holidays. Nevertheless, in the event a break lower materialises, December’s opening level resides as the next support target at 28074, providing attractive risk/reward metrics.
As we head into the Christmas holidays, liquidity is likely to be thin going forward. Traders are urged to bear this in mind before committing to a position.
XAU/USD (GOLD):
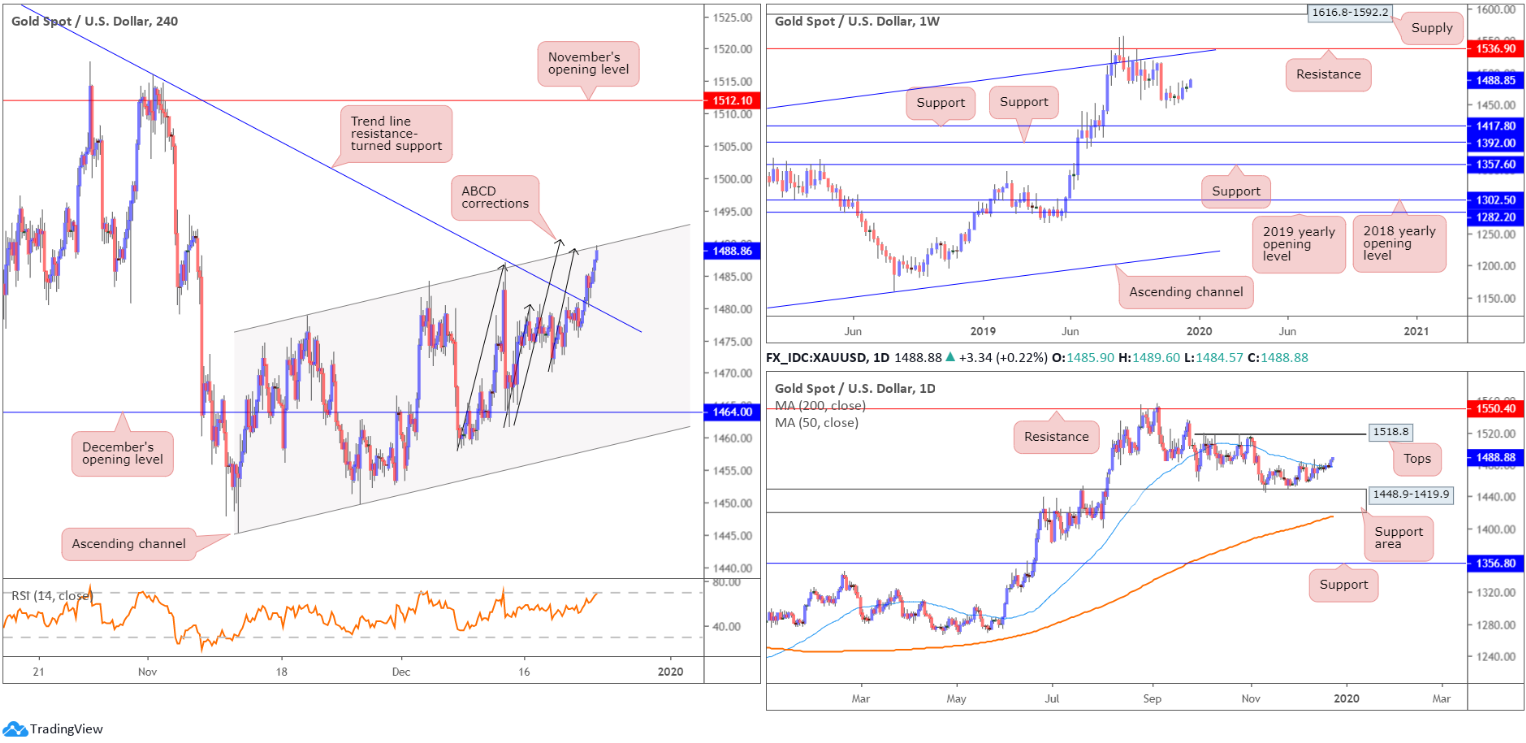
XAU/USD spot added more than $7 Monday, cementing ground north of the H4 trend line resistance, extended from the high 1557.1.
For those who read Monday’s technical briefing you may recall the following piece:
A violation of the aforementioned H4 trend line this week may encourage breakout buying, targeting the H4 channel resistance, taken from the high 1478.8, which could eventually complete two H4 ABCD bearish correction patterns around 1490.7ish (black arrows). The combination of the two harmonic patterns and the channel resistance is likely to attract intraday selling.
H4 price, as you can see, recently shook hands with the noted channel resistance and is further confirmed by RSI (relative strength index) divergence.
On more of a broader perspective, nevertheless, bullion, since connecting with weekly resistance at 1536.9 and channel resistance, extended from the high 1375.1, has been in a mild decline. Further downside from here potentially sets the stage for a move towards two layers of weekly support at 1392.0 and 1417.8. Overall, though, the primary trend has faced a northerly trajectory since bottoming in early December 2015.
The 50-day SMA (blue – 1477.1), which offered resistance since early December, gave way in recent trade, perhaps enough to generate further upside to tops around 1518.8, closely followed by resistance at 1550.4. It might also interest some traders to note the 200-day SMA (orange – 1415.5) remains south of a support area at 1448.9-1419.9, though has been drifting north since mid-April.
Areas of consideration:
Although daily price trades above the 50-day SMA, short entries at the current H4 channel resistance remain an option. The combination of the two ABCD harmonic patterns and channel resistance is likely to attract intraday selling. Conservative traders wishing to add a little more confirmation to the mix, however, may wait and see if a H4 bearish candlestick formation occurs before pulling the trigger. This helps avoid whipsaws and provides entry and risk levels to trade, making risk/reward calculations easier.
As for the initial downside target, the recently broken H4 trend line resistance (now support) serves as an ideal take-profit zone.
As we head into the Christmas holidays, liquidity is likely to be thin going forward. Traders are urged to bear this in mind before committing to a position.
(Italics represents previous analysis)
The accuracy, completeness and timeliness of the information contained on this site cannot be guaranteed. IC Markets does not warranty, guarantee or make any representations, or assume any liability regarding financial results based on the use of the information in the site.
News, views, opinions, recommendations and other information obtained from sources outside of www.icmarkets.com.au, used in this site are believed to be reliable, but we cannot guarantee their accuracy or completeness. All such information is subject to change at any time without notice. IC Markets assumes no responsibility for the content of any linked site.
The fact that such links may exist does not indicate approval or endorsement of any material contained on any linked site. IC Markets is not liable for any harm caused by the transmission, through accessing the services or information on this site, of a computer virus, or other computer code or programming device that might be used to access, delete, damage, disable, disrupt or otherwise impede in any manner, the operation of the site or of any user’s software, hardware, data or property.
.


