
EUR/USD:
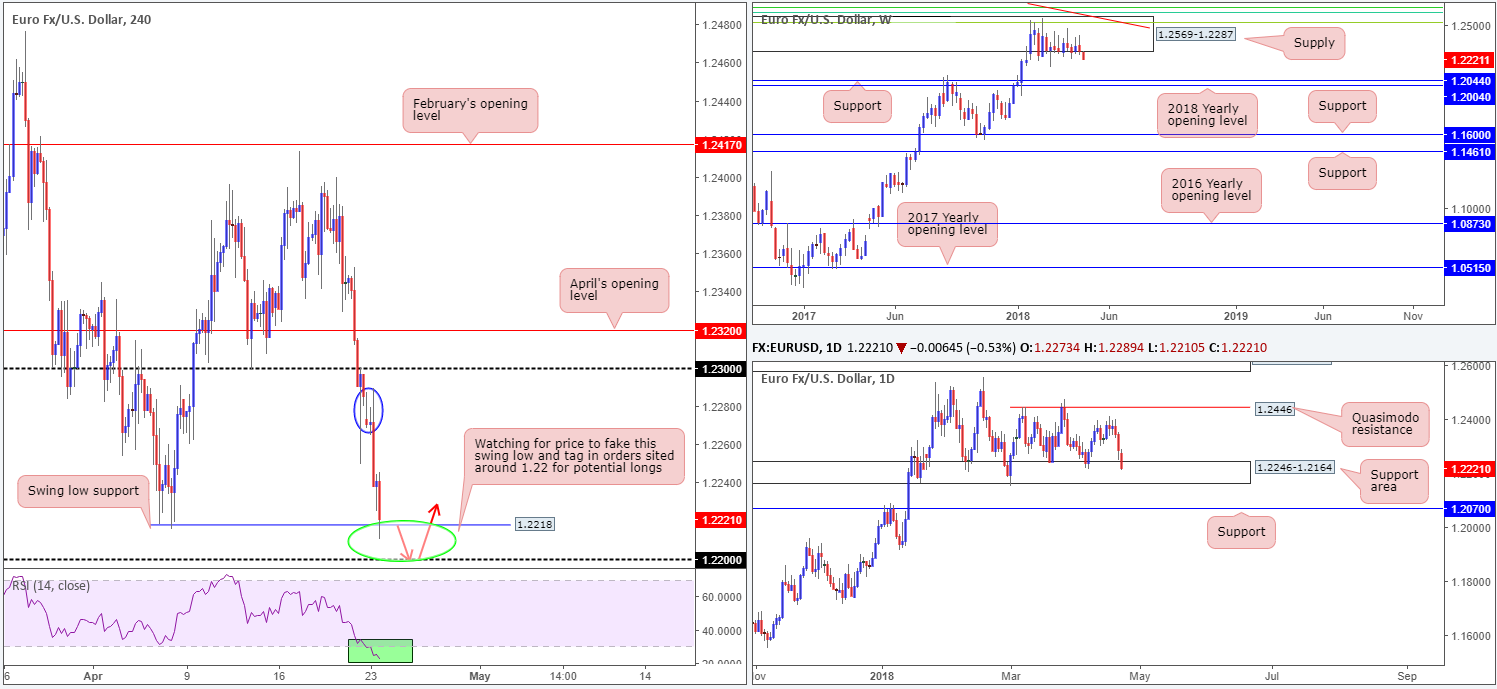
Forming a firm foothold above the 90.50 threshold on Monday, the US dollar traded higher against G10 rivals even though the 10 year US Treasury yield had not quite printed 3%. As of current writing, the EUR/USD market is seen challenging a swing low support on the H4 timeframe priced in at 1.2218, which, as you can see, is shadowed closely by the 1.22 handle.
In terms of higher-timeframe structure, however, the pair remains at conflict despite the recent bout of selling. Weekly supply noted at 1.2569-1.2287 has held the EUR/USD captive since late January. Although the buyers still have a strong hand in this fight (see overall trend), we feel the pair may want to shake hands with nearby support targets (weekly support band at 1.2044, shadowed closely by the 2018 yearly opening level at 1.2004) before making its next play. Daily movement, on the other hand, is currently seen trading within the walls of a daily support area plotted at 1.2246-1.2164. Formed from a daily supply back in 2014, this zone has governed downside action since the beginning of the year.
Potential trading zones:
Although the single currency is trading sharply lower at the moment, we feel a correction could be in store. Shielding this market from lower prices is the aforementioned daily support area, the 1.22 handle (we’re assuming the current swing low H4 support level will eventually be faked in order to bring in 1.22) and also the H4 RSI trading deep in oversold territory.
To become buyers, though, we would strongly recommend waiting for H4 price to interact with 1.22, form a support, and print a H4 bullish close back above 1.2218. Following this, upside is likely free of resistance until we reach 1.2289-1.2271: the H4 supply area circled in blue. Aiming for higher than this may be too chancy, given where we are trading from on the weekly timeframe!
Data points to consider today: German IFO business climate; US consumer confidence.
GBP/USD:
The British pound sustained further losses throughout Monday’s London session. The main focus has been on the rollback of May BoE rate hike expectations following Gov. Carney’s comments last week. However, UK’s Brexit plans have also come under scrutiny again following the Lord’s vote against exiting the EU customs union.
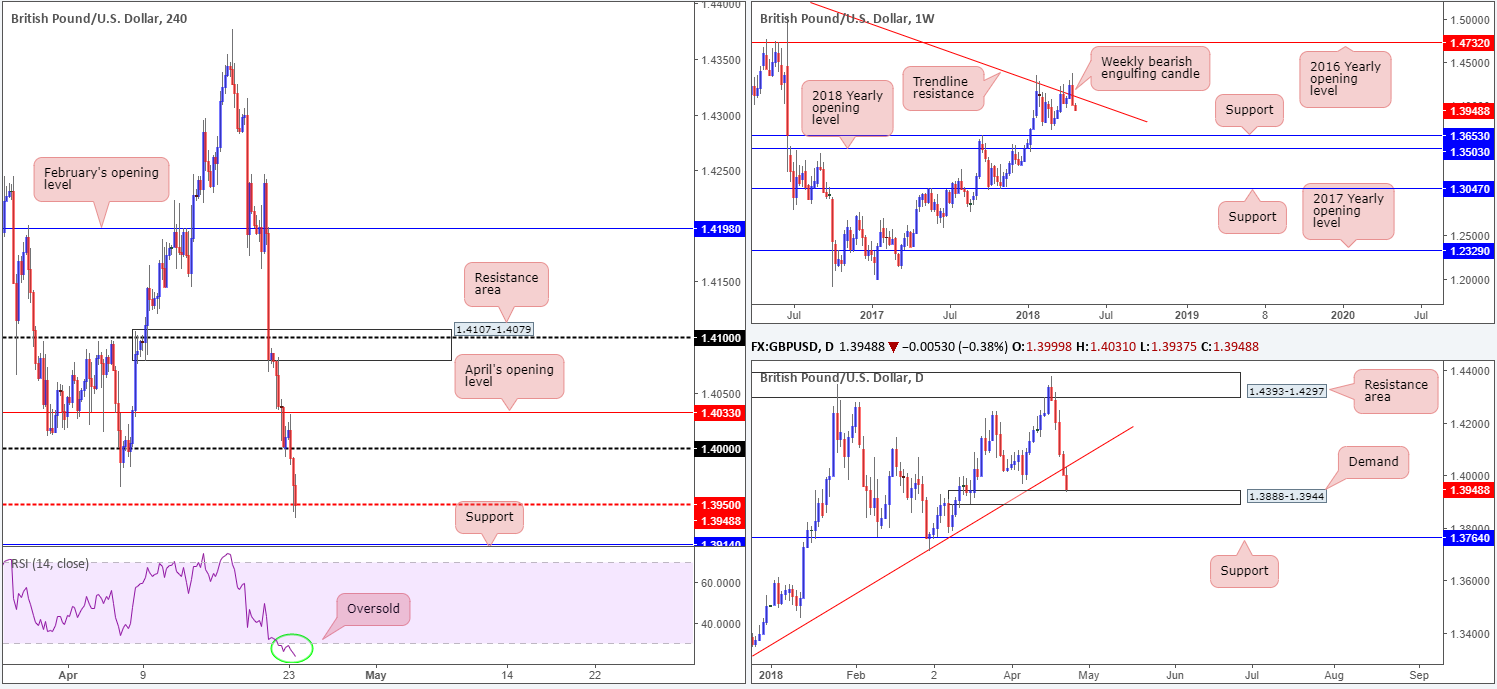
With 1.40 firmly in the rear view mirror and 1.3950 reflecting weakness, there’s little in terms of technical props before we reach 1.3914: a H4 support that is sited just north of the 1.39 handle (not seen on the screen). Adding weight to the downside, let’s also remember that last week’s movement formed a striking weekly bearish engulfing candle that nose-dived back beneath a long-term weekly trend line resistance taken from the high 1.5930. Despite this, we must take into account that the daily timeframe has baked in a daily demand base coming in at 1.3888-1.3944, after crunching its way through a daily trend line support extended from the low 1.3061. This area could potentially invigorate upside interest, even if only on an intraday basis. Notice here that 1.39 and 1.3914 are both positioned within the lower limits of this daily zone.
Potential trading zones:
Trading long from within the current daily demand zone may feel like catching a falling knife. We get that. But with the H4 RSI indicator trading deeply within oversold territory, along with the current daily demand and H4 supports, an intraday bounce may be in store. The beautiful thing about this trade is that one can position stops beneath the daily demand given the position of the H4 levels within the area! Therefore, this could certainly be something to consider going into today’s session.
Data points to consider today: UK public sector net borrowing; US consumer confidence.
AUD/USD:
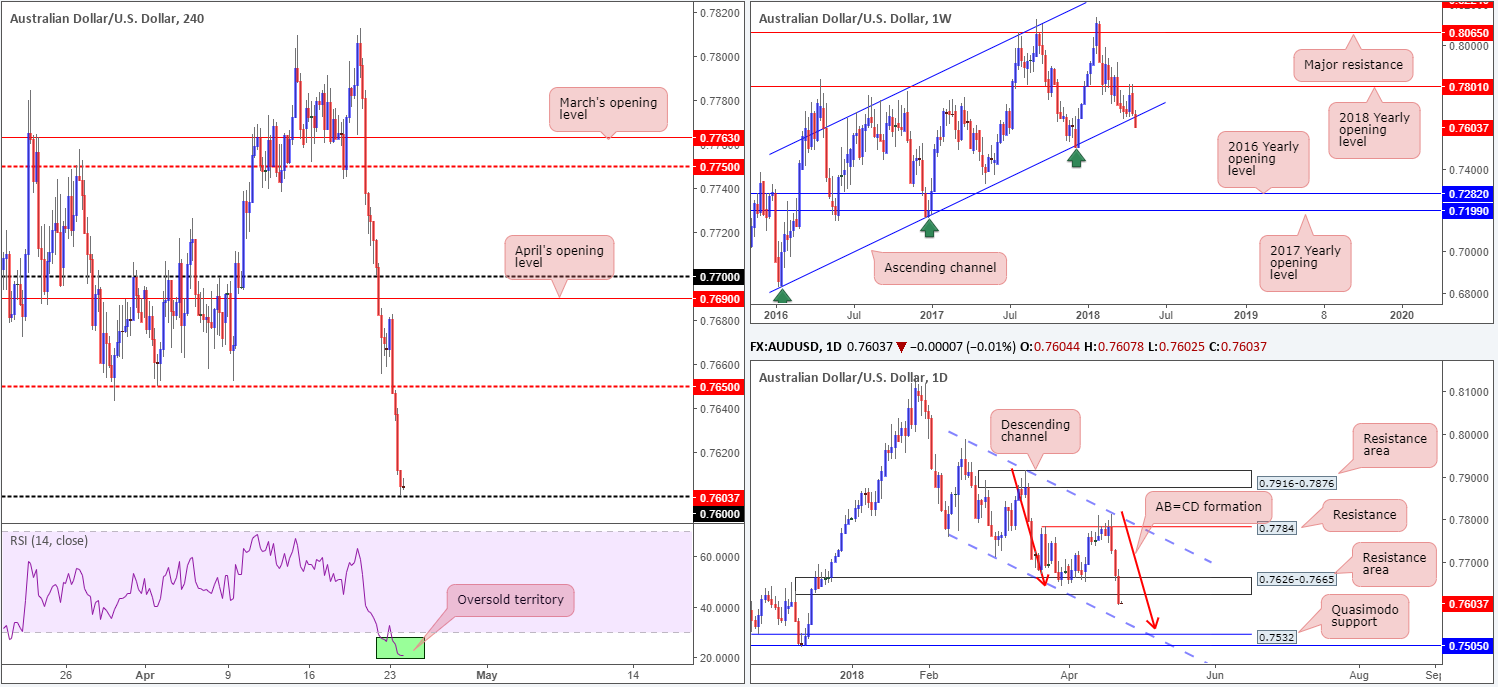
Beginning with the weekly timeframe this morning, we are able to see that weekly price chewed its way through a long-term weekly channel support extended from the low 0.6827 in recent movement. Although the move is impressive, we feel it may be worth waiting for the weekly candle to close shop before presuming that the ascending weekly channel line is consumed.
The daily demand zone printed at 0.7626-0.7665 was taken out in strong fashion on Monday (now acting resistance area), technically opening the path south to a daily channel support drawn in from the low 0.7758, followed then by a daily Quasimodo support at 0.7532. Also worth noting is the potential AB=CD correction that terminates just ahead of this daily support level (see red arrows).
Spurred on by weakness in the metals market along with the US dollar staging a strong recovery across the board, the H4 candles are seen trading off the 0.76 handle, marking a fresh 2018 yearly low for the Aussie dollar. According to higher-timeframe structure, though, there is potential to drive beyond this number this week.
Potential trading zones:
Trading from 0.76 may offer an intraday bounce today. Though, we’d be surprised to see much materialize. The main focus, therefore, is on December’s opening level at 0.7562 (not seen on the screen) for potential long plays, as this level aligns rather nicely with the noted daily channel support. However, what this also means is that traders could pursue intraday shorts beneath 0.76 (preferable to wait for a retest of 0.76 before pulling the trigger) as well, targeting 0.7562 as the initial take-profit zone.
Data points to consider today: Australian inflation figures; US consumer confidence.
USD/JPY:
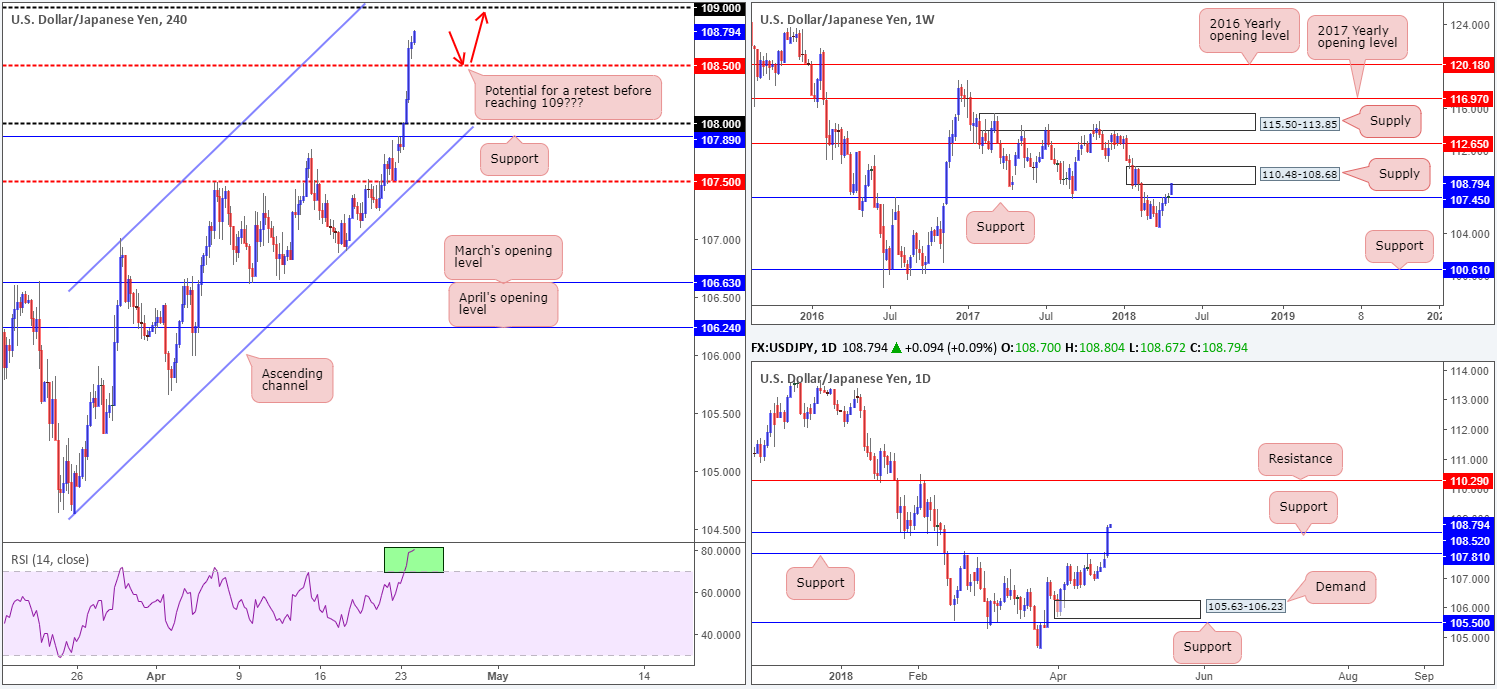
The US dollar traded higher against its Japanese counterpart on Monday, concluding the day at highs of 108.75. Registering its largest daily gain on the month, it’s clear that the safe-haven yen suffered at the hands of a robust dollar across the board.
The next port of call for the H4 candles can be seen at 109, which happens to be positioned just ahead of February’s opening level at 109.19 (not seen on the screen). One other thing to keep in mind here, traders, is the H4 RSI is seen trading aggressively within overbought terrain.
The story over on the bigger picture paints an interesting canvas! On the weekly scale, price is seen shaking hands with weekly supply priced in at 110.48-108.68, after conquering weekly resistance at 107.45. A little lower on the curve, we can also see that daily price recently consumed daily resistance at 108.52 in the shape of a near-full-bodied daily bull candle, potentially opening upside as far north as daily resistance found at 110.29 (positioned within the upper limits of the noted weekly supply).
Potential trading zones:
With both H4 and daily price showing room to extend on recent gains, further upside in this market may be seen today. Unless we see a pullback to the H4 mid-level support at 108.50 (also denoted as a daily support highlighted above) before reaching the 109s, though, we feel it may be a challenging buy.
Furthermore, seeing that weekly price is interacting with the underside of a weekly supply, waiting and seeing if H4 price can formulate support at 108.50 before pulling the trigger is advised (look for reasonably sized bullish candles on the lower timeframes).
Data points to consider today: US consumer confidence.
USD/CAD:
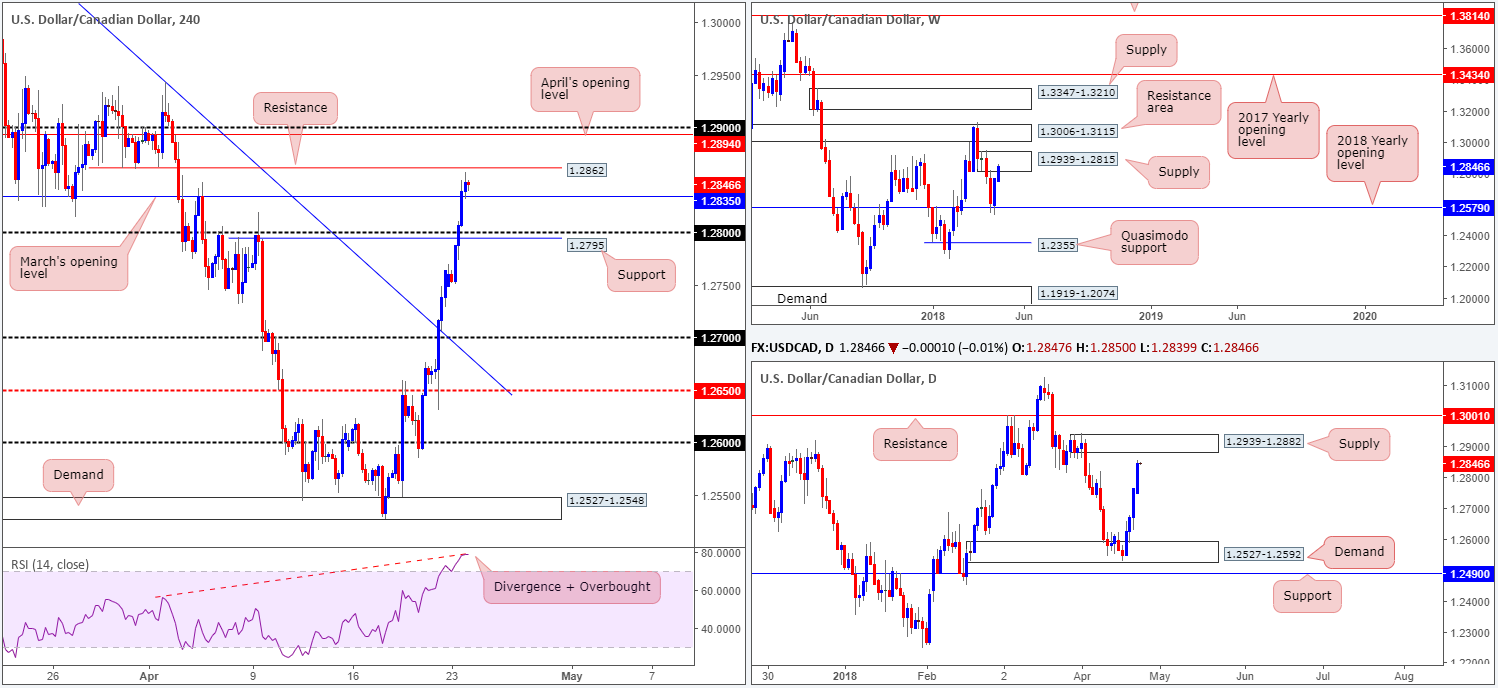
Of late, the Canadian dollar has experienced a rather concerning slump! Canadian wholesale sales printed a disappointing miss on Monday, and BoC’s Poloz signaled that there will be no action from the central bank at this stage. Overall, this sent H4 price above the 1.28 handle, and in the later hours of US trade, above March’s opening level at 1.2835. Overhead, though, we see clear H4 resistance nearby at 1.2862, shadowed closely by April’s opening band at 1.2894. Something else to take on board is the H4 RSI indicator which displays a strong overbought/divergence reading.
Over on the higher-timeframe picture, weekly price is now stationed within the boundaries of weekly supply at 1.2939-1.2815, while daily action shows some room to move higher until we reach daily supply at 1.2939-1.2882 (positioned within the upper limits of the said weekly supply).
Potential trading zones:
In view of current H4 structure, price movement is likely to be somewhat restricted today. In saying this, though, April’s opening level mentioned above at 1.2894 is particularly interesting for shorts, as it is located within the lower limit of the noted daily supply zone, which itself is (as highlighted above) located within the upper boundary of weekly supply! Safe stop-loss placement would therefore be beyond the higher-timeframe supplies.
Data points to consider today: US consumer confidence.
USD/CHF:
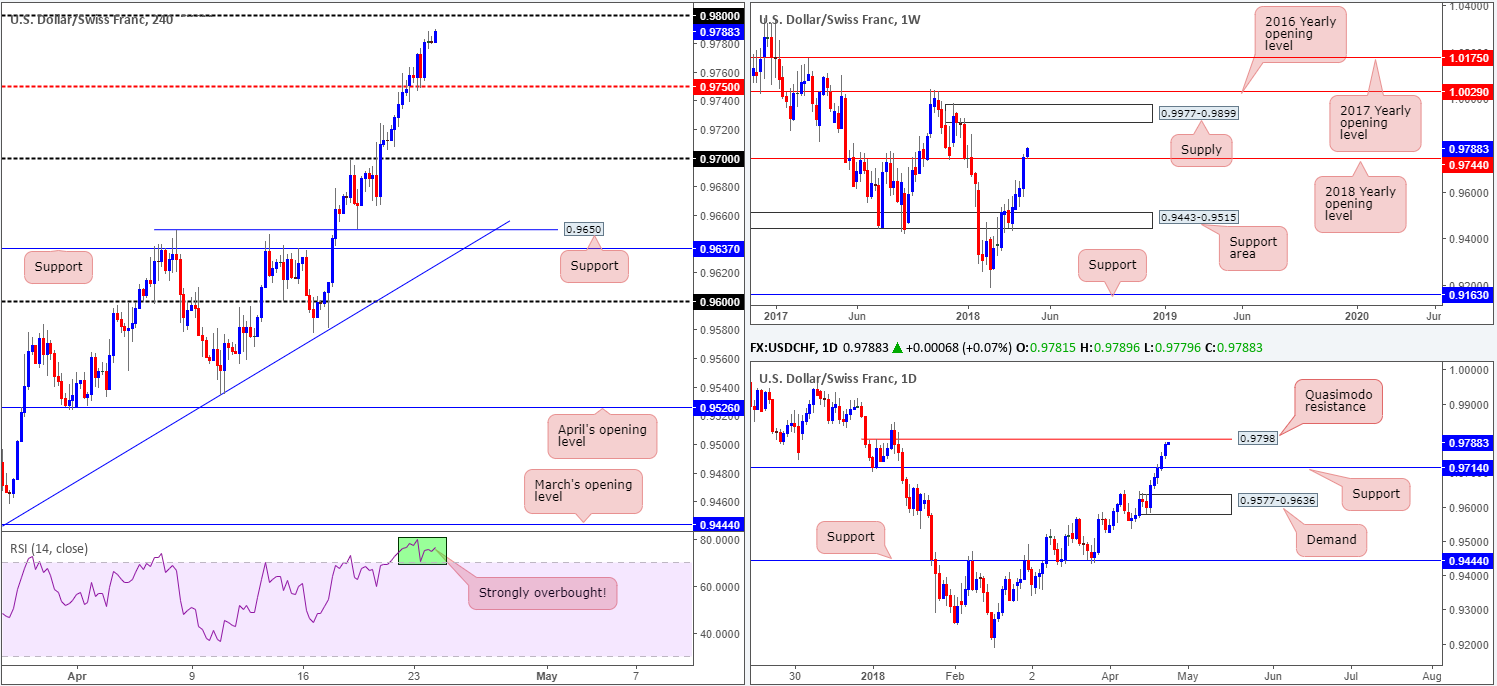
After a marginal weekly close higher above the 2018 yearly opening level at 0.9744, the USD/CHF has pressured its way north on Monday. As is shown on the weekly timeframe, the pair could potentially drive as far north as weekly supply rounded off at 0.9977-0.9899. Despite this upward projection, daily movement is seen trading within shouting distance of a daily Quasimodo resistance level plotted at 0.9798.
In conjunction with daily flows, H4 price is eyeing the 0.98 handle following a close above and retest of the H4 mid-level resistance at 0.9750. Note that not only does the psychological number converge closely with the aforementioned daily Quasimodo resistance, the H4 RSI indicator is also currently trading within overbought territory.
Potential trading zones:
Even though weekly price is trading a tad above the 2018 open level, the team has noted to keep a watchful eye on 0.98 today for possible short plays. Given its meeting with daily structure and the H4 RSI positioning, a pullback to the H4 mid-level support at 0.9750 is not out of the question, in our technical view.
Data points to consider today: US consumer confidence.
DOW 30:
US equities were mixed during Monday’s trade as US Treasury yields weighed on stock prices.
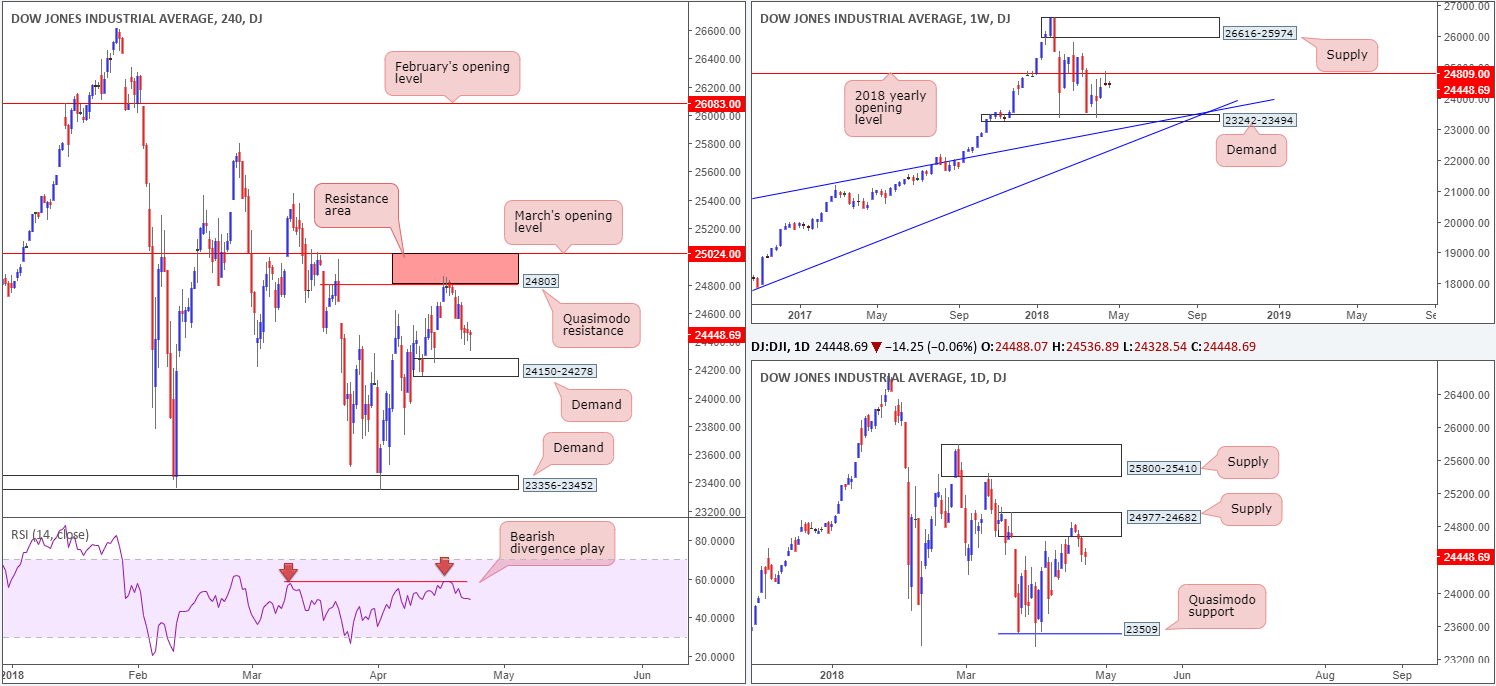
Technically speaking, the desk remains bearish this market. This is largely due to higher-timeframe structure. Weekly activity recently connected with the 2018 yearly opening level baked in at 24809 in the shape of a weekly bearish pin-bar formation. This, alongside daily price driving lower from daily supply noted at 24977-24682, is likely to continue fuelling downside pressure.
On the H4 timeframe, however, price is seen hovering just north of a H4 demand base located at 24150-24278. Although we may see a bounce from this region, we do not believe it will be anything to get excited about. Apart from being located against higher-timeframe flow, the demand area was already tested on April 13 (see red arrow), which has potentially weakened buyers here. Beyond this area, the team has noted to keep an eyeball on the H4 demand at 23356-23452 as the next downside target which happens to be positioned just beneath the daily Quasimodo support at 23509.
Potential trading zones:
As of current price action we do not see much to hang our hat on. A decisive H4 push beyond the H4 demand mentioned above at 24150-24278, nevertheless, could provide a favorable opportunity to sell this market and target the lower H4 demand. An ideal sell signal would be for a retest to the underside of the current H4 demand as resistance in the shape of a full or near-full-bodied H4 bearish candle.
Data points to consider today: US consumer confidence.
GOLD:
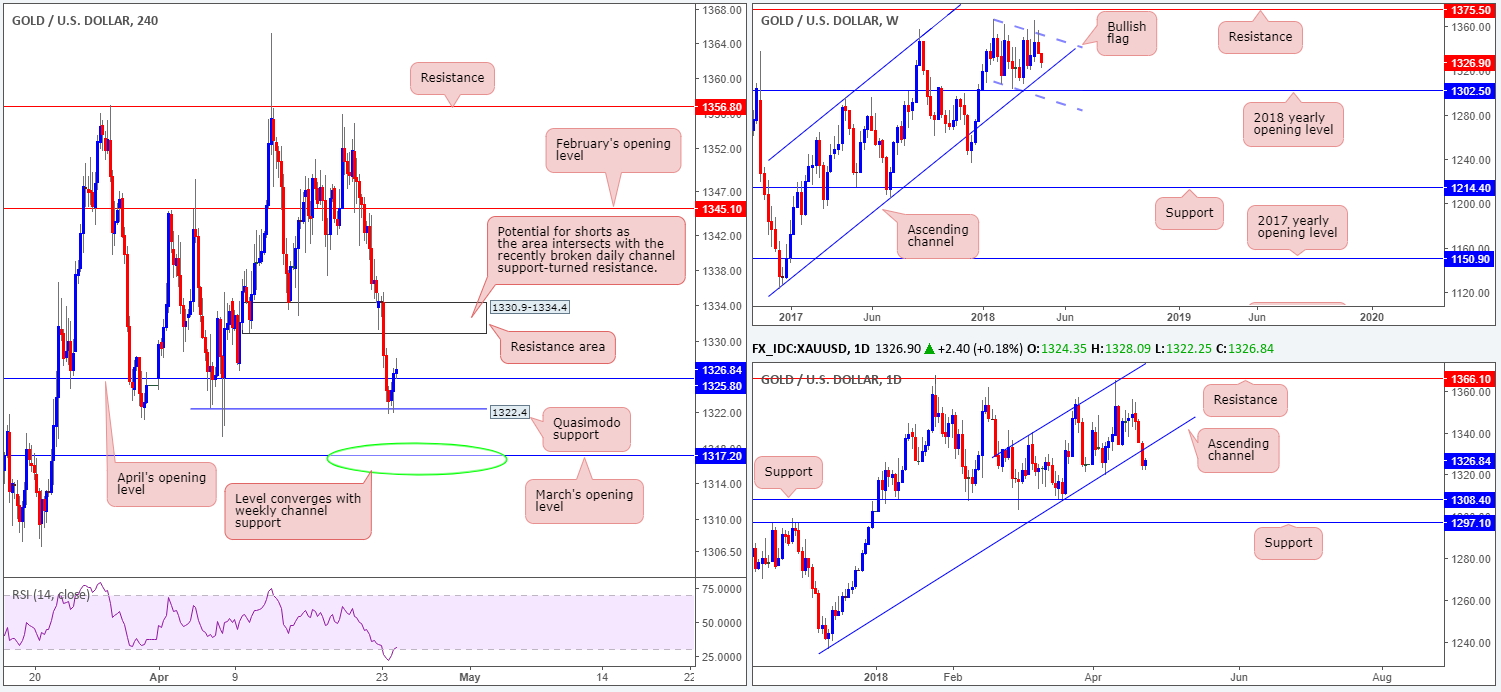
Weighed on by a robust US dollar seen across the board, gold sustained its downside momentum on Monday. The H4 demand at 1330.9-1334.4, along with April’s opening level at 1325.8, were both taken out, with H4 price only showing signs of bullish activity once connecting with a H4 Quasimodo support at 1322.4. As you can see, the unit has since re-established some support and propelled its way back above April’s opening band.
Weekly action shows room to drive as far south as a long-term weekly channel support taken from the low 1122.8. In addition to this, we can also see that daily price broke out from its ascending channel support taken from the low 1236.6 and has a daily support at 1308.4 to target.
Potential trading zones:
The area that really jumps out at us this morning is March’s opening level seen on the H4 timeframe at 1317.2. This is due to it intersecting reasonably well with the noted weekly channel support. Does this guarantee a winning trade? Absolutely not! In fact, there is a strong chance that this level could be whipsawed in order to bring in orders off of daily support mentioned above at 1308.4.
Another interesting area for consideration is the H4 resistance zone at 1330.9-1334.4 for shorts since this zone intersects beautifully with the recently broken daily channel support-turned resistance.
This site has been designed for informational and educational purposes only and does not constitute an offer to sell nor a solicitation of an offer to buy any products which may be referenced upon the site. The services and information provided through this site are for personal, non-commercial, educational use and display. IC Markets does not provide personal trading advice through this site and does not represent that the products or services discussed are suitable for any trader. Traders are advised not to rely on any information contained in the site in the process of making a fully informed decision.
This site may include market analysis. All ideas, opinions, and/or forecasts, expressed or implied herein, information, charts or examples contained in the lessons, are for informational and educational purposes only and should not be construed as a recommendation to invest, trade, and/or speculate in the markets. Any trades, and/or speculations made in light of the ideas, opinions, and/or forecasts, expressed or implied herein, are committed at your own risk, financial or otherwise.
The use of the site is agreement that the site is for informational and educational purposes only and does not constitute advice in any form in the furtherance of any trade or trading decisions.
The accuracy, completeness and timeliness of the information contained on this site cannot be guaranteed. IC Markets does not warranty, guarantee or make any representations, or assume any liability with regard to financial results based on the use of the information in the site.
News, views, opinions, recommendations and other information obtained from sources outside of www.icmarkets.com.au, used in this site are believed to be reliable, but we cannot guarantee their accuracy or completeness. All such information is subject to change at any time without notice. IC Markets assumes no responsibility for the content of any linked site. The fact that such links may exist does not indicate approval or endorsement of any material contained on any linked site.
IC Markets is not liable for any harm caused by the transmission, through accessing the services or information on this site, of a computer virus, or other computer code or programming device that might be used to access, delete, damage, disable, disrupt or otherwise impede in any manner, the operation of the site or of any user’s software, hardware, data or property.


