
Key risk events today:
French Flash Services PMI; French Flash Manufacturing PMI; German Flash Manufacturing PMI; German Flash Services PMI; EUR Flash Manufacturing PMI; EUR Flash Services PMI; UK Flash Manufacturing PMI; UK Flash Services PMI; BoE Gov Bailey Speaks; US Flash Manufacturing PMI; US Flash Services PMI.
(Previous analysis as well as outside sources – italics).
EUR/USD:
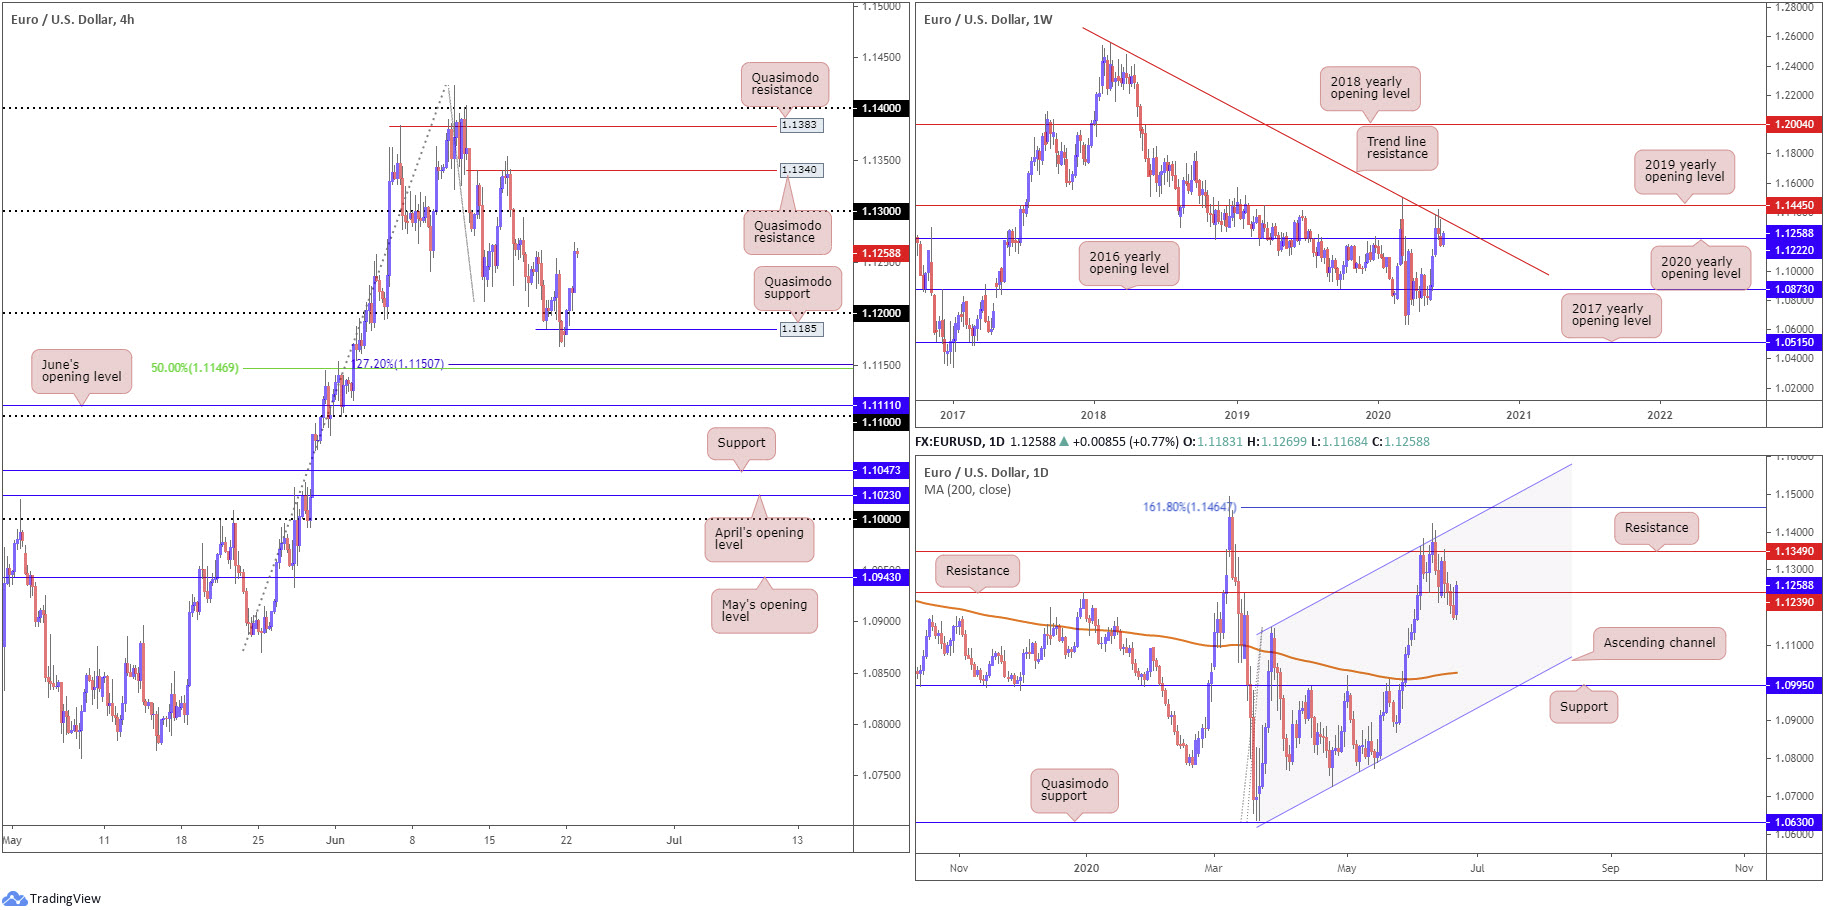
Upbeat risk sentiment weighed on the US dollar index Monday, firmly snapping a four-day bullish phase. EUR/USD H4 reclaimed 1.12+ status and recently conquered 1.1250, with eyes now on 1.13 as potential resistance, followed by a Quasimodo formation at 1.1340.
Meanwhile, on the weekly timeframe, we are seeing price action attempt to regain footing above the 2020 yearly opening level at 1.1222, echoing the possibility of reconnecting with long-standing trend line resistance, taken from the high 1.2555. Daily movement, as you can see, had price cross back above resistance at 1.1239 in recent action, snapping a four-day bearish phase and refocusing the spotlight on resistance at 1.1349.
Areas of consideration:
Holding 1.1250 today could see a push for 1.13.
There is also a chance a retest at 1.1239 could take shape, the recently engulfed daily resistance, before seeking higher ground.
A fakeout through 1.13 is also something to keep in mind. Surpassing 1.13 and tagging H4 Quasimodo resistance at 1.1340 would not only trip stops above the round number, it would entice fresh sellers off 1.1340. Conservative sellers, however, would want to see a H4 close back under 1.13 form before committing to this fakeout scenario, targeting 1.1250ish as an initial take-profit zone.
GBP/USD:
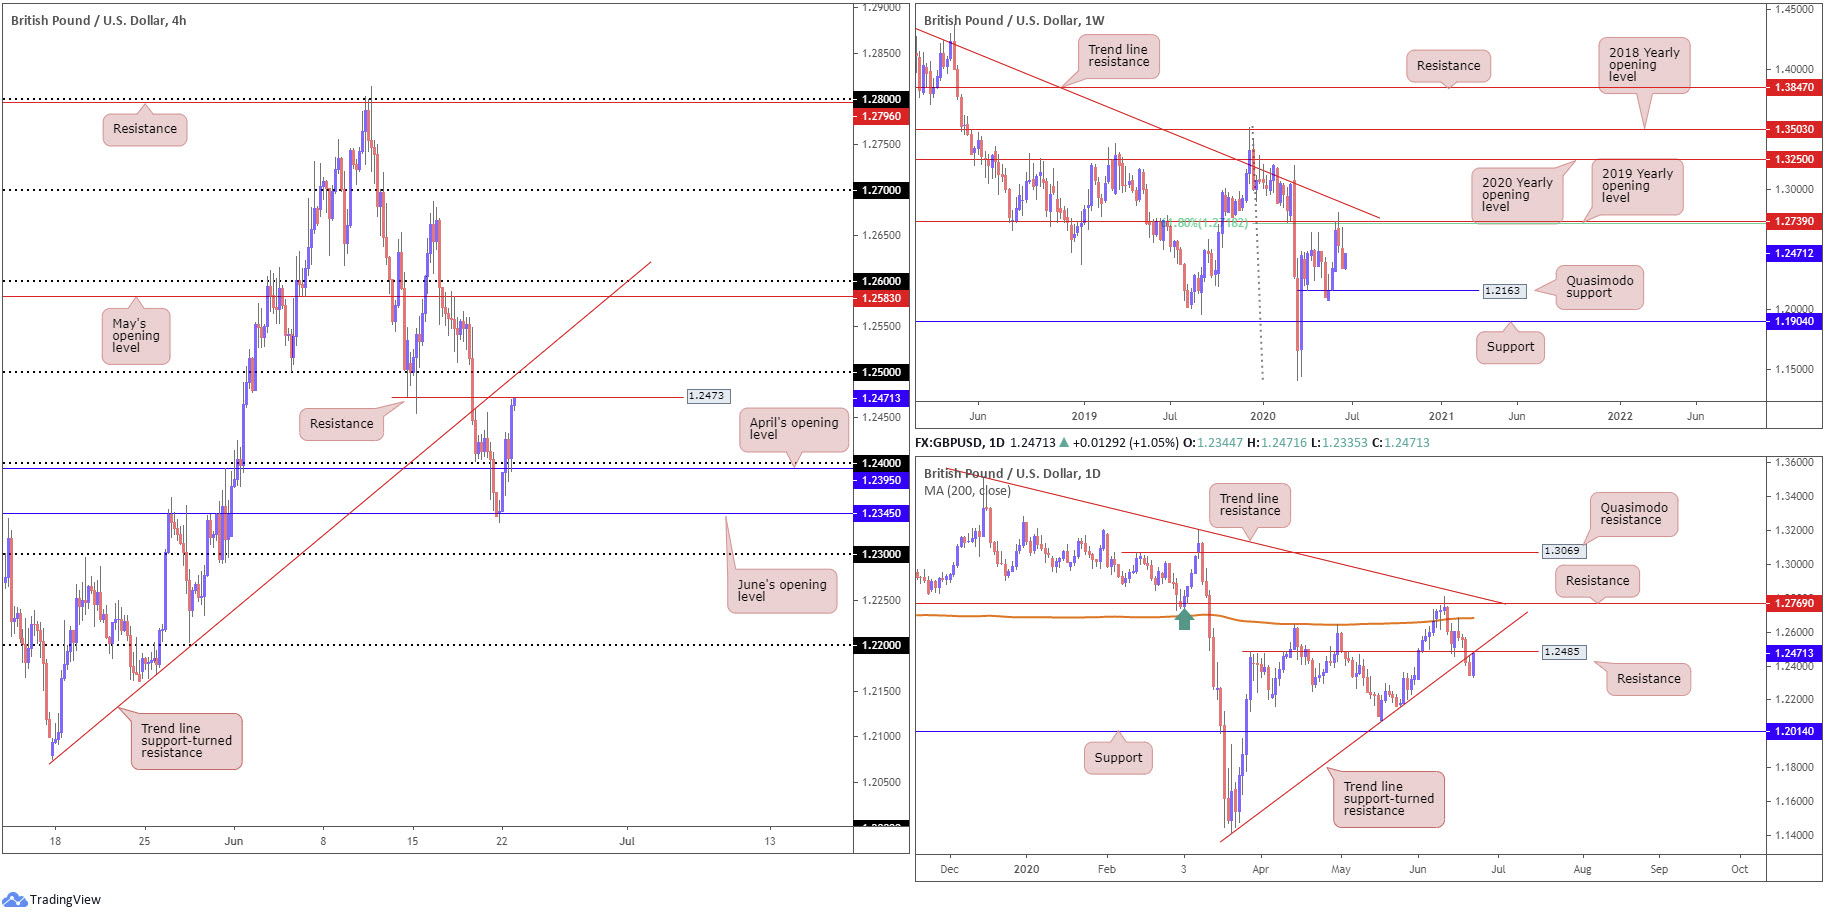
Monday had GBP/USD overthrow April’s opening level at 1.2395 on the H4 timeframe and the 1.24 handle. As you can see, the pair held onto the bulk of its gains into the close, following a swift retest of the 1.24 neighbourhood as support. Resistance at 1.2473 now calls for attention, a prior Quasimodo support level. A break here will likely see candles grapple with 1.25 and nearby trend line support-turned resistance, extended from the low 1.2075.
Against the backdrop of H4 flow, the daily timeframe, after candle action snapped a four-day bearish phase on DXY softness, is seen shaking hands with trend line support-turned resistance, taken from the low 1.1409. Weekly price, on the other hand, trades in no man’s land, with resistance not expected to make an appearance until reaching the 61.8% Fibonacci retracement ratio at 1.2718 and 2019 yearly opening level at 1.2739. With respect to support, a Quasimodo formation resides at 1.2163.
Areas of consideration:
Although the weekly timeframe presents little in terms of nearby support/resistance, H4 is close to crossing swords with resistance at 1.2473 and daily price is set within striking distance of resistance at 1.2485/trend line resistance. This combination could stir seller interest and force a dip back to the 1.24 region.
Conservative sellers may seek additional confirmation before pulling the trigger, as 1.25, a level that merges with H4 trend line resistance, is also likely to call for attention.
AUD/USD:
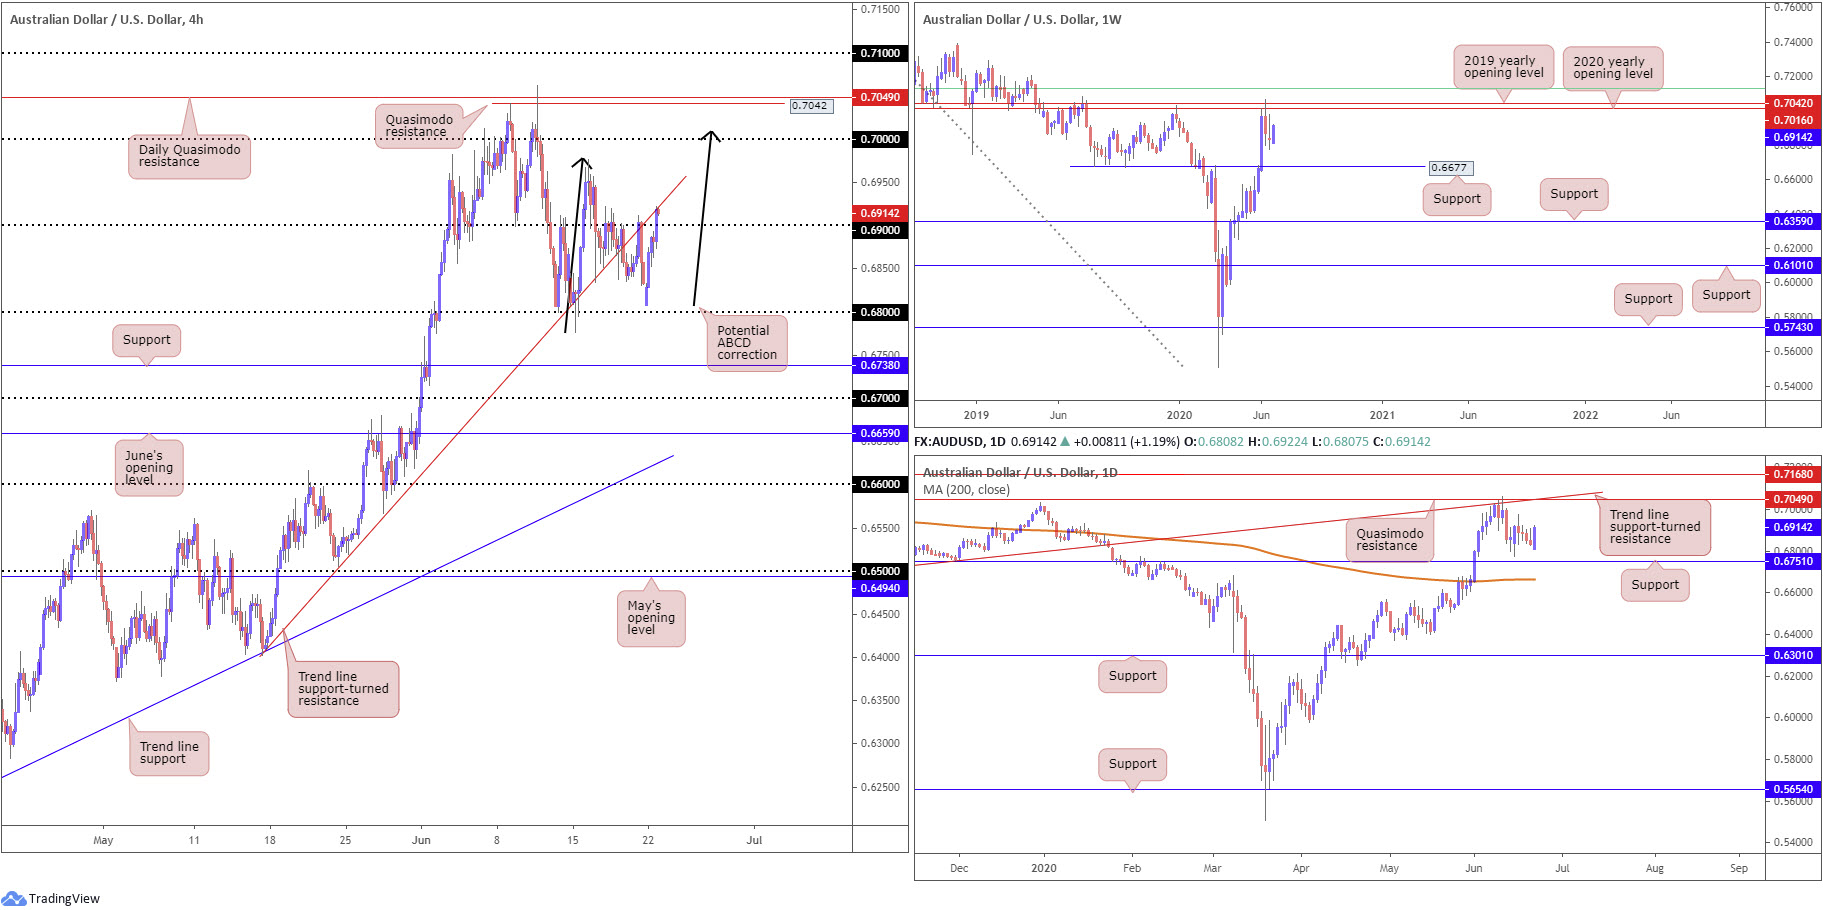
Antipodean currencies were major beneficiaries of broad USD weakness Monday, with the Australian dollar climbing 1.2% against the buck.
After bottoming just north of the 0.68 handle, recent hours witnessed 0.69 come under fire and H4 price shake hands with trend line support-turned resistance, extended from the low 0.6402. North of this angle, skies appear reasonably clear until reaching the 0.6976 June 16 high, closely followed by the key figure 0.70. Also worth bringing to the fore is the possibility of an ABCD bearish pattern (black arrows) at 0.7010.
Resistance, forged in the shape of a 2020 yearly opening level and a 2019 yearly opening level at 0.7016 and 0.7042, respectively, continues to offer a dominant presence on the weekly timeframe. It might also interest traders to note that just above the said resistances we have a 61.8% Fibonacci retracement ratio stationed at 0.7128 (green). In terms of support, crosshairs are perhaps fixed on 0.6677.
From the daily timeframe, Quasimodo resistance at 0.7049 is in sight, merging closely with trend line support-turned resistance, taken from the low 0.6670. Attention on this timeframe also remains at support coming in from 0.6751. Interestingly, lurking beneath here we have the 200-day SMA (orange – 0.6664), sited close by the weekly support at 0.6677.
Areas of consideration:
Breaking 0.69 likely has intraday buyers licking their lips in favour of a continuation move. H4 trend line resistance could put a stop to that, however. Therefore, breakout strategies are precarious right now. A retest at 0.69 as support that holds in the shape of a H4 bullish candlestick pattern, nevertheless, might entice further buying.
0.70 offers interesting resistance on the H4 timeframe, as price merges with ABCD confluence.
Dips back below 0.69 could imply a fakeout above the round number has come to pass, with sellers feeding on buy-stop liquidity, potentially taking aim at 0.68.
USD/JPY:
In light of Monday’s lacklustre performance, much of the following analysis will echo points put forward in Monday’s technical weekly briefing.
From the weekly timeframe:
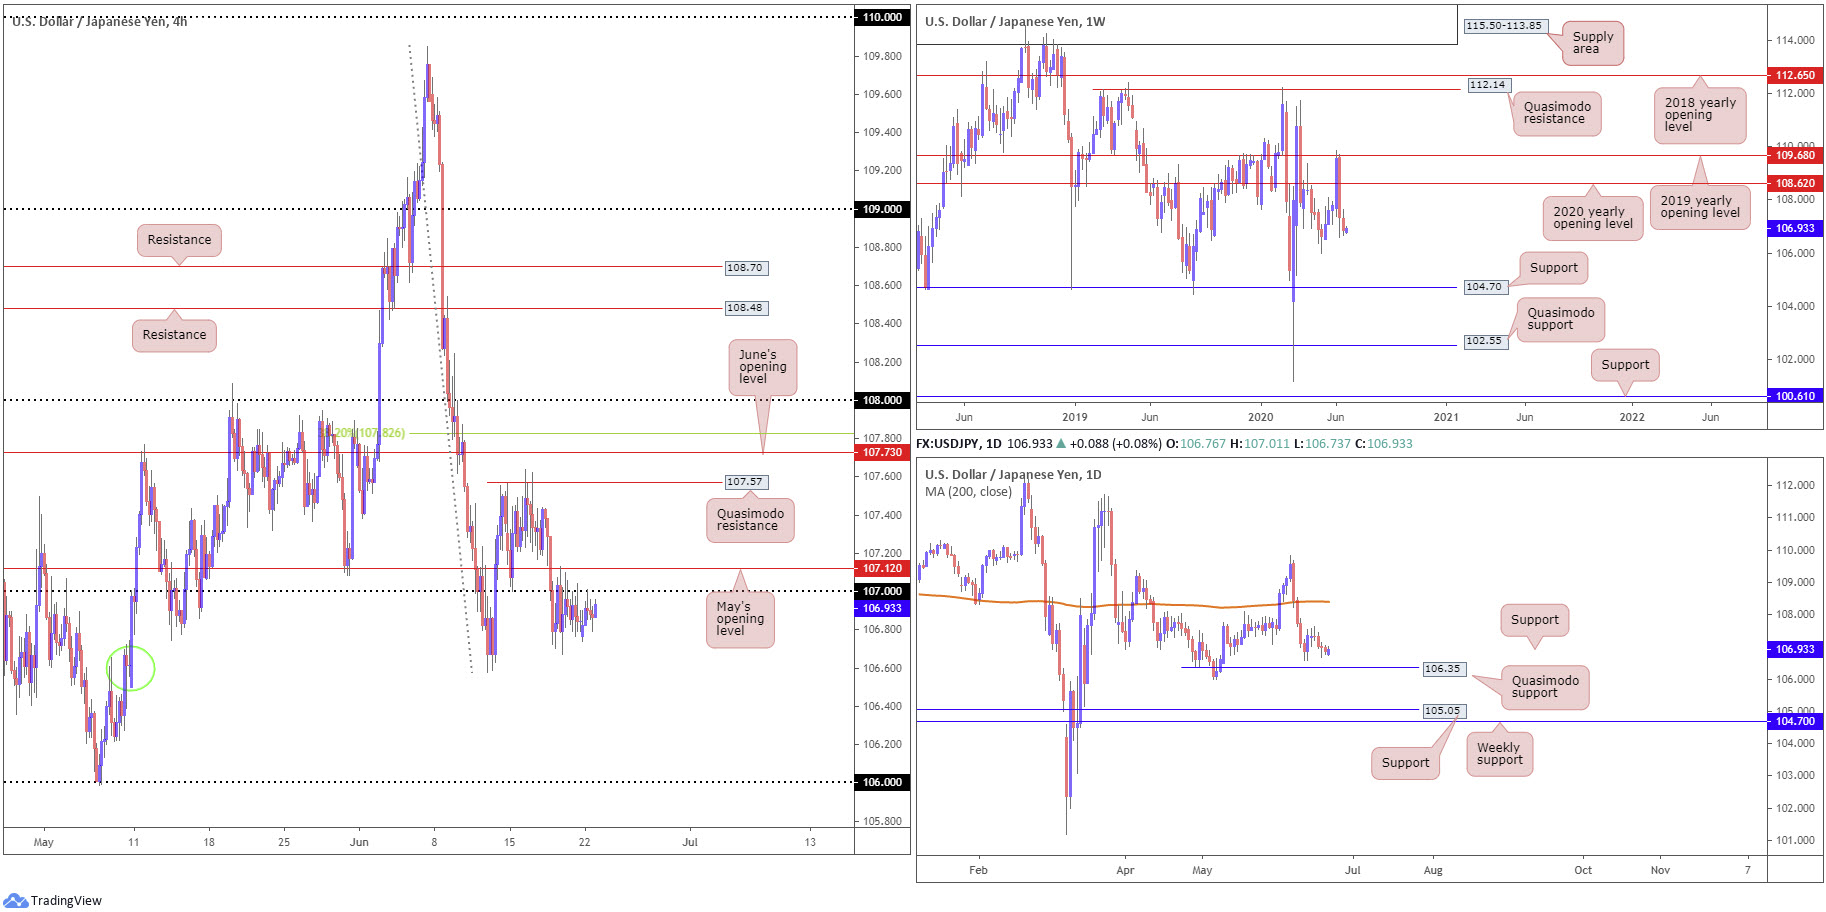
After rejecting the 2019 yearly opening level at 109.68 and voyaging through the 2020 yearly opening level at 108.62, this shifts focus to the 105.98 6th May low as the next downside target on this scale.
Daily timeframe:
A closer reading of price action on the daily timeframe reveals the candles are poised to connect with Quasimodo support at 106.35 – It might be worth pointing out the 105.98 6th May low underscored on the weekly timeframe forms the low to the aforementioned Quasimodo support. A break into territory south of the Quasimodo formation may eventually have price knocking on the door of support at 105.05.
H4 timeframe:
May’s opening level at 107.12 and the 107 handle continue to serve as resistance.
Slipping lower from this point has demand (green circle) to contend with around 106.60, with further selling underlining the 106 handle.
Areas of consideration:
H4 sellers still appear to be accumulating a position sub 107 at the moment, albeit gripping bids around 106.75.
Weekly price invites a move to 105.98 – essentially the 106 handle on the H4 timeframe, while daily price suggests a potential speed bump at 106.35. H4 demand around 106.60 may also cause problems.
As a result of the above, bearish themes may be something to consider under 107, noting 106.60 and 106.35 as possible hurdles to overcome before crossing swords with 106.
USD/CAD:
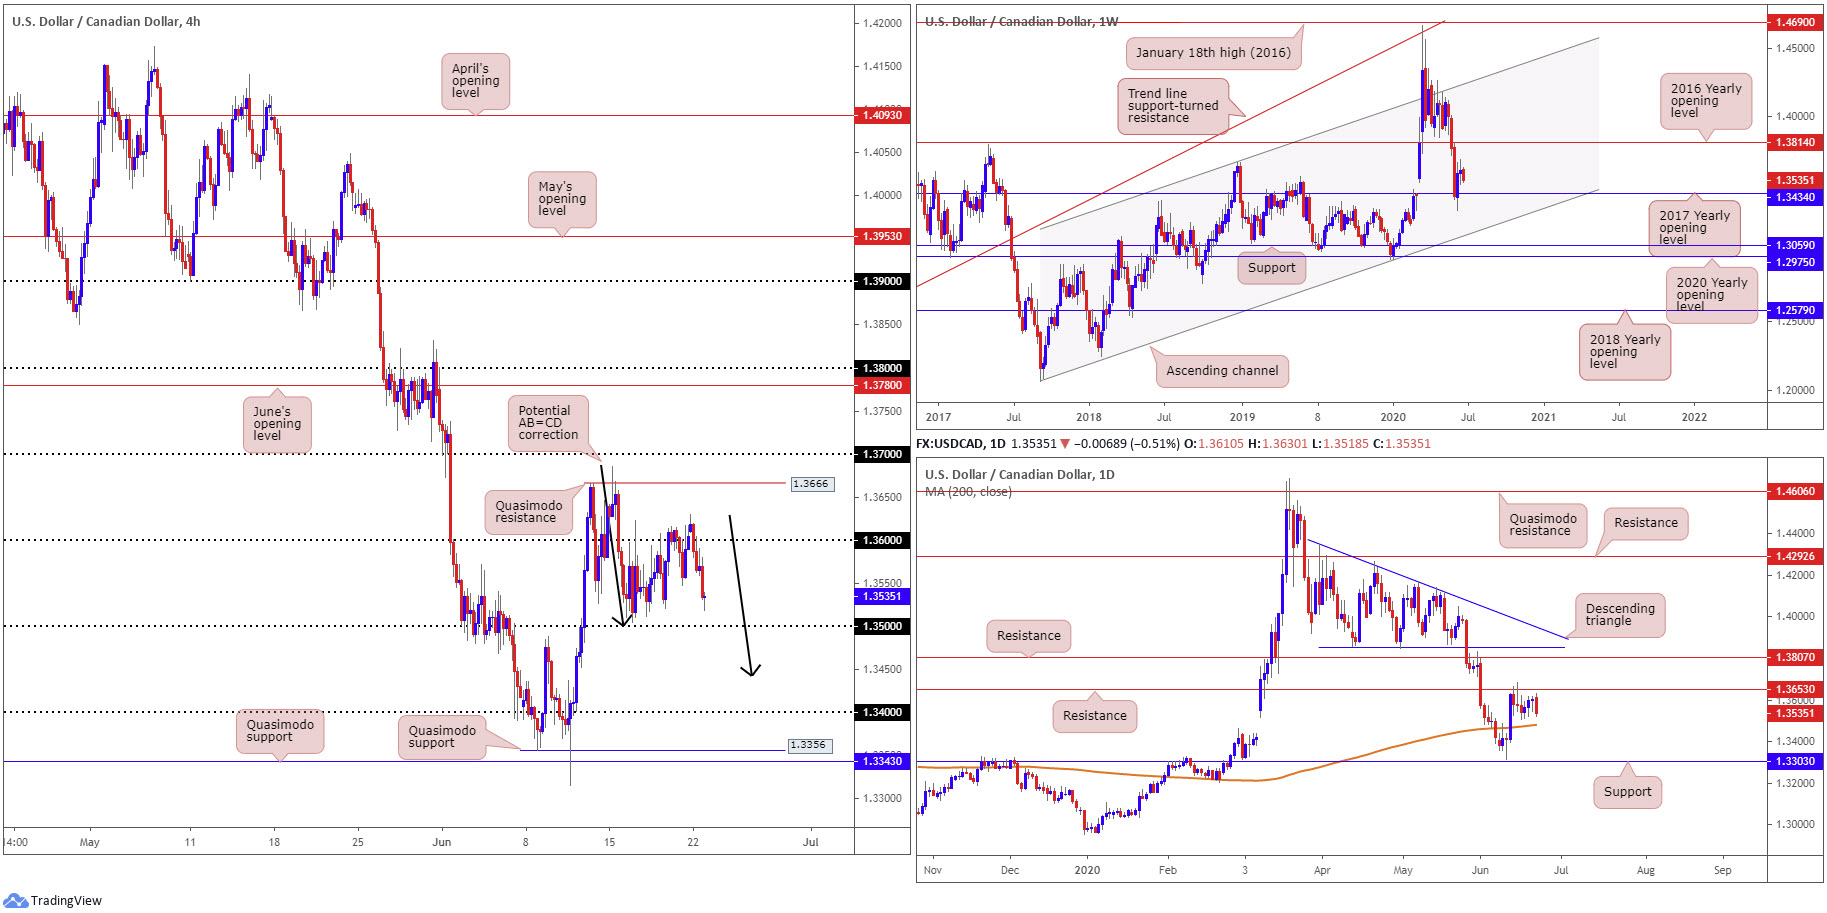
1.36 continues to prove a tough nut to crack as resistance on the H4 timeframe, with Monday fading session highs at 1.3629. H4 price now eyes 1.35 as feasible support, thanks to recent selling, with a break unmasking a possible AB=CD bullish pattern (black arrows) at 1.3440.
Recent selling has also thrown support back into the pot at 1.3434 on the weekly timeframe, the 2017 yearly opening level. In the event of a turn higher, a potential hurdle to be aware of falls in by way of the 2016 yearly opening level at 1.3814. Clearing 1.3434, on the other hand, places channel support, taken from the low 1.2061, in the limelight.
Price action on the daily timeframe continues to languish below resistance at 1.3653, with price heading in the direction of the 200-day SMA (orange – 1.3480). Above current resistance, another layer of resistance is visible at 1.3807, boasting a close connection to the underside of a recently completed descending triangle. Yet, a spin through the aforementioned SMA could have sellers aim at support coming in from 1.3303.
Areas of consideration:
As highlighted in previous analysis, higher-timeframe buyers are unlikely to commit to the weekly timeframe’s push off support at 1.3434 until daily resistance from 1.3653 gives way.
A potential scenario that may come about on the H4 timeframe today involves a fakeout through 1.35 into the 200-day SMA (1.3480). A H4 close back above 1.35 off the SMA will likely be a welcomed sight for buyers, feeding into sell-stop liquidity.
Another base to keep an eye on, also under 1.35, is the H4 AB=CD bullish pattern at 1.3440 as it shares space with the 2017 yearly opening level at 1.3434 on the weekly timeframe.
USD/CHF:
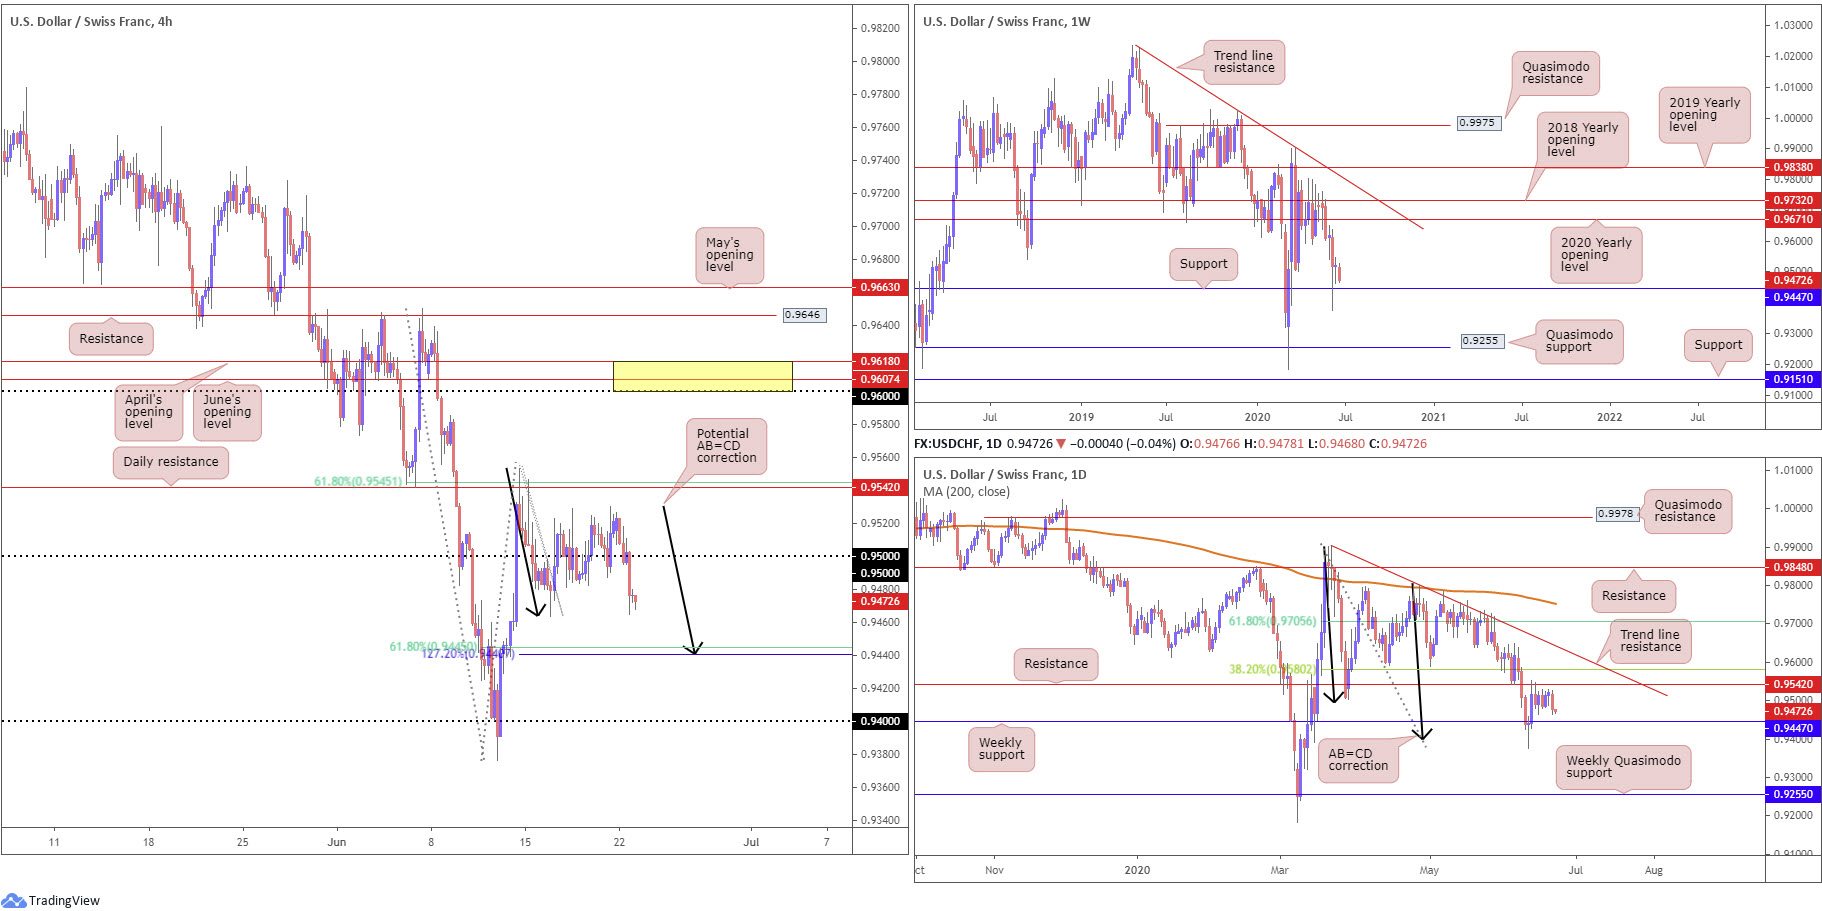
Broad USD softness weighed on USD/CHF Monday, shedding 0.5%.
H4 brushed aside orders at the 0.95 handle with relative ease, greeting last week’s session low around 0.9465. Further downside, meanwhile, realises potential support around 0.9440ish, comprised of an AB=CD correction (black arrows) at 0.9440, a 127.2% Fibonacci extension point at 0.9440 and a 61.8% Fibonacci retracement ratio at 0.9445.
Joining closely with our H4 AB=CD construction is weekly support coming in at 0.9447.
Areas of consideration:
In view of weekly support bolstering the H4 AB=CD pattern around 0.9440, this area could be enough to spark a USD revival today. As for upside targets north of the zone, AB=CD traders will watch the 38.2% and 61.8% Fibonacci retracement ratios of legs A-D (can only be applied once leg D completes).
Dow Jones Industrial Average:
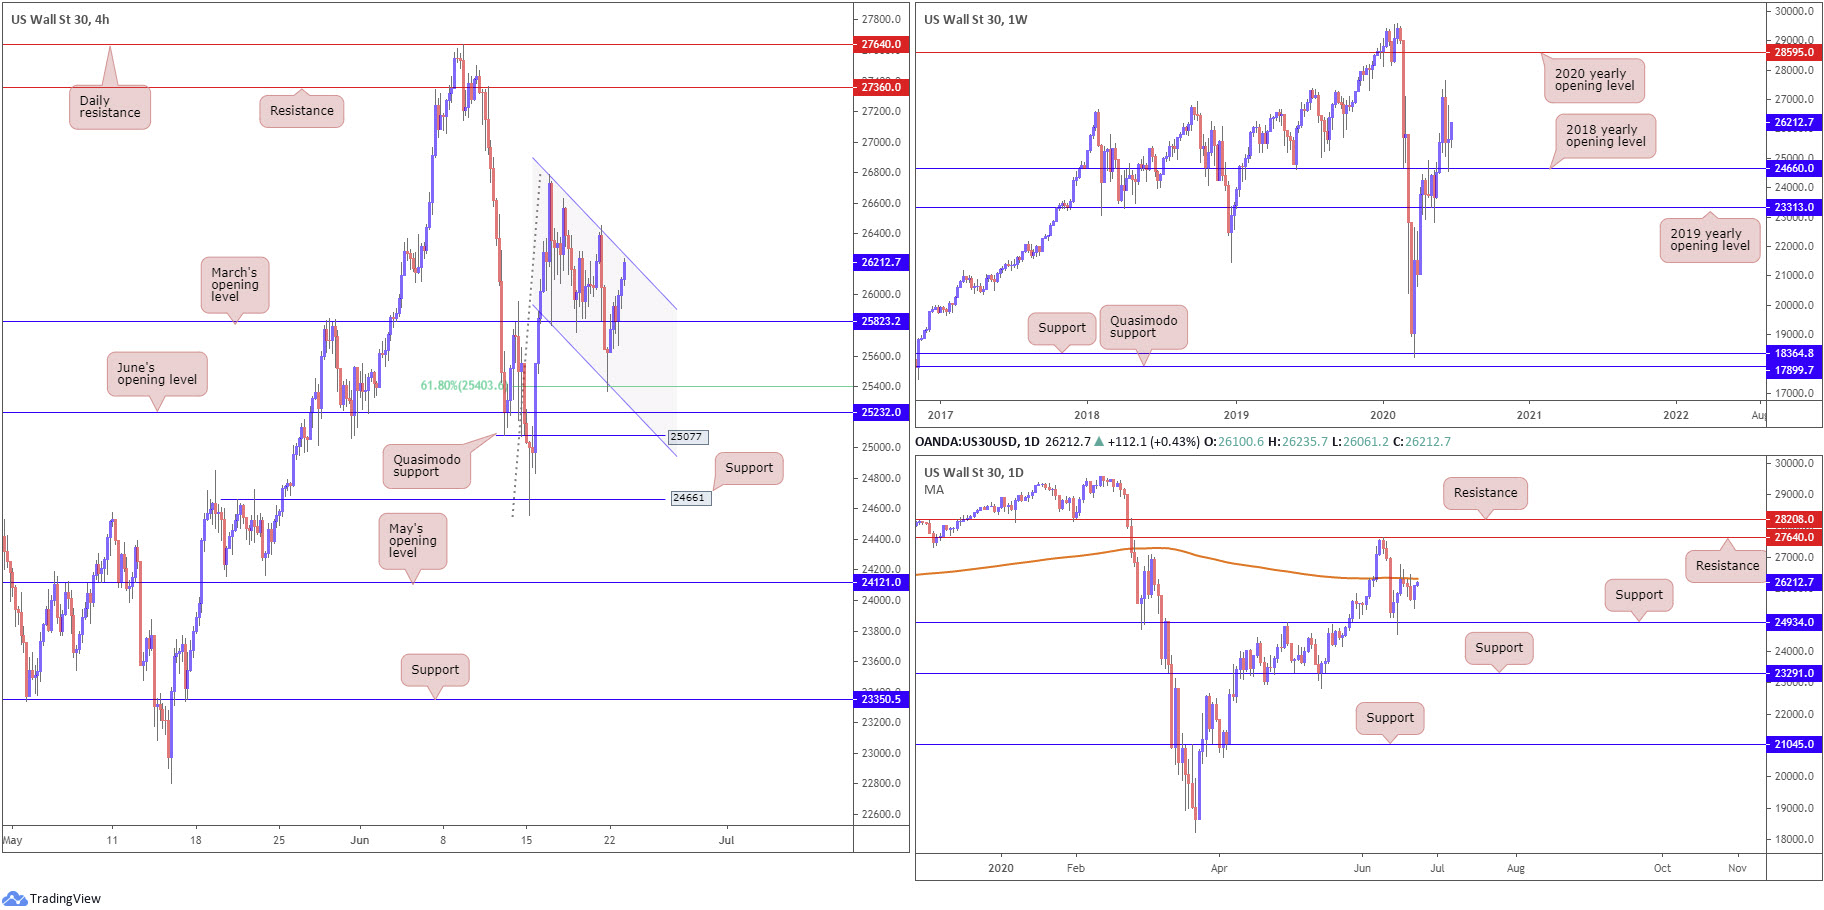
US equities advanced Monday amid anticipation of additional fiscal stimulus from central banks given the spike in COVID-19 infections. The Dow Jones Industrial Average rose 153.50 points, or 0.59%; the S&P 500 added 20.12 points, or 0.65%, and the tech-heavy Nasdaq 100 concluded higher by 121.69 points, or 1.22%.
From a technical standpoint, the 2018 yearly opening level at 24660 elbowed its way into the spotlight on the weekly timeframe last week. Despite concluding the week in the shape of a long-legged doji candlestick pattern, buyers appear in good spirit. Continued bidding will move the 27638 high into view, followed by the 2020 yearly opening level at 28595. Below 24660, however, traders’ crosshairs may be fixed on the 2019 yearly opening level at 23313.
Last week’s action on the daily timeframe shook hands with the underside of the 200-day SMA (orange – 26321), with Friday throwing across a bearish outside day formation. As we head into Asia Pac hours today, thanks to Monday’s advance, we trade at the underside of the said SMA. Engulfing here points the spotlight at resistance coming in from 27640.
A closer examination of price action on the H4 timeframe reveals we’re heading into channel resistance, extended from the high 26787, after engulfing March’s opening level at 25823. Traders may also wish to acknowledge the channel converges closely with the 200-day SMA.
Areas of consideration:
A rejection from H4 channel resistance is possible today, given the connection with the 200-day SMA, targeting March’s opening level at 25823 as an initial port of call. A break beyond the channel/SMA, however, is equally possible, having noted weekly price making headway north of support at 24660 (2018 yearly opening level).
XAU/USD (GOLD):
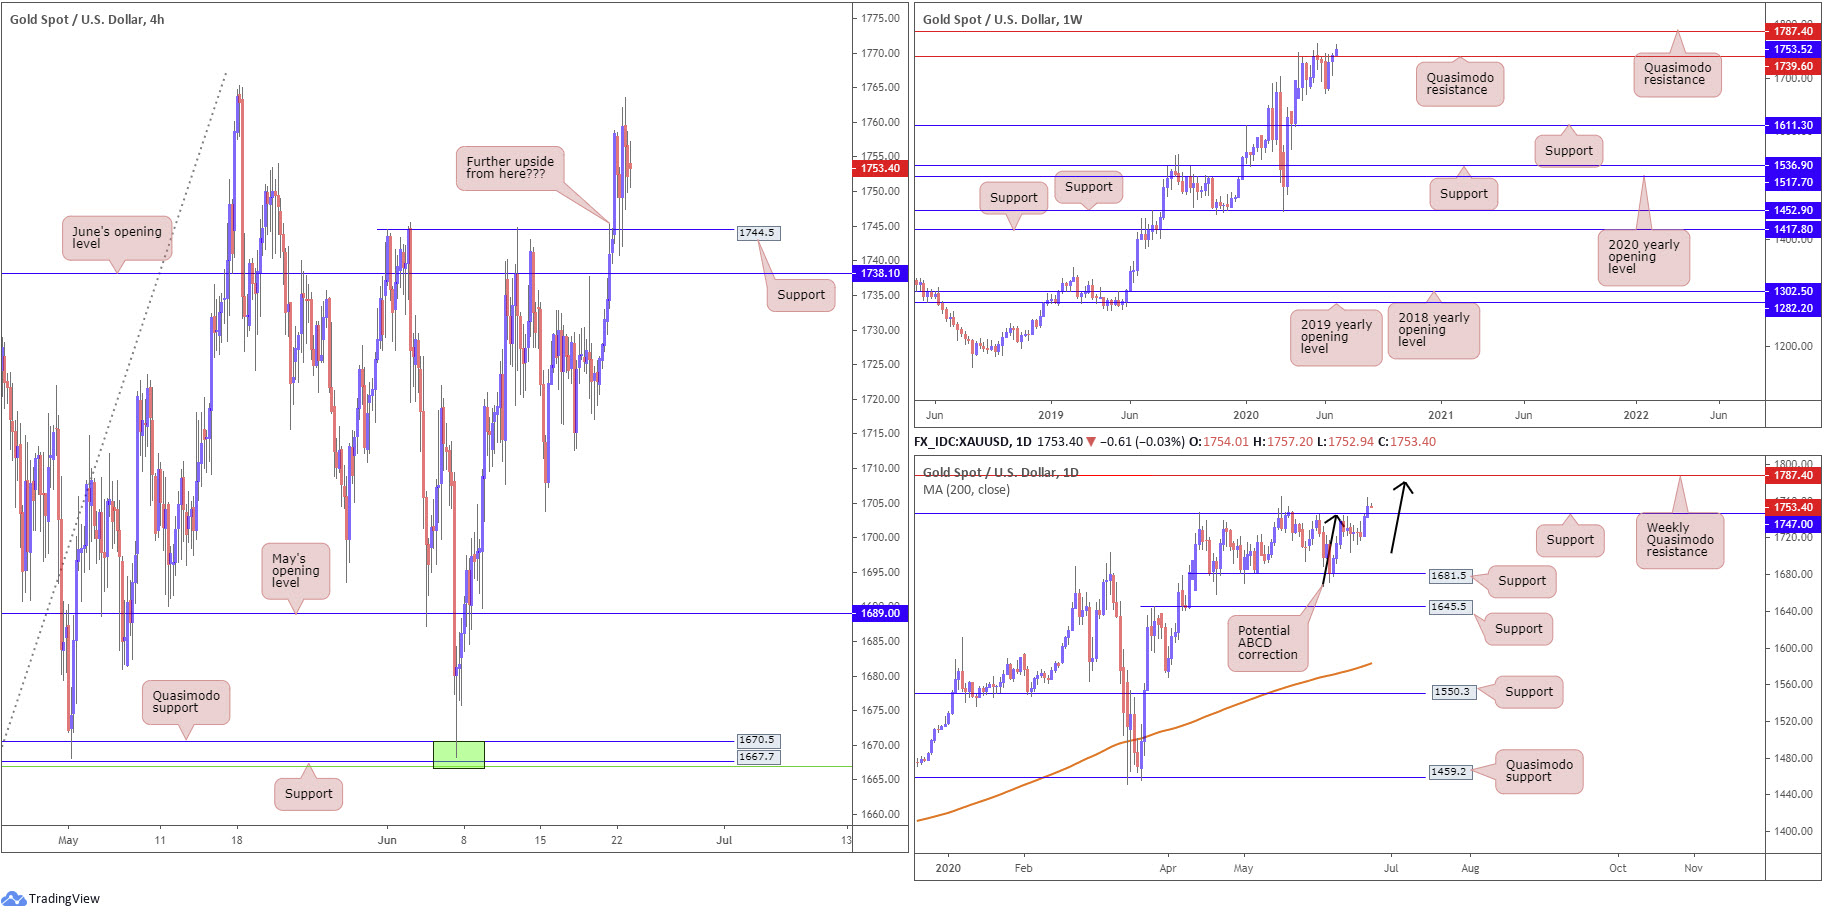
Kicking things off from the weekly timeframe this morning, recent upside has hauled price action above Quasimodo resistance at 1739.6, a level that’s capped upside since mid-April. In line with the long-term uptrend, the break higher has potentially set the stage for a run to Quasimodo resistance at 1787.4.
Elsewhere, daily price also violated a familiar resistance coming in at 1747.0, which also highlights the possibility of a run to weekly Quasimodo resistance mentioned above at 1787.4. Interestingly, we also see a possible daily ABCD bearish pattern completing just south of 1787.4 (black arrows).
From the H4 timeframe, price action is currently rebounding off 1744.5, a prior Quasimodo resistance level. Note this level also aligns closely with the recently broken daily resistance at 1747.0, now a serving support.
Areas of consideration:
With weekly buyers making an effort to conquer 1739.6, bullish scenarios off H4 support at 1744.5 and daily support from 1747.0 could be an option today. Upside targets from this point rest at the daily ABCD correction from 1780.0, closely followed by weekly Quasimodo resistance at 1787.4.
The accuracy, completeness and timeliness of the information contained on this site cannot be guaranteed. IC Markets does not warranty, guarantee or make any representations, or assume any liability regarding financial results based on the use of the information in the site.
News, views, opinions, recommendations and other information obtained from sources outside of www.icmarkets.com.au, used in this site are believed to be reliable, but we cannot guarantee their accuracy or completeness. All such information is subject to change at any time without notice. IC Markets assumes no responsibility for the content of any linked site.
The fact that such links may exist does not indicate approval or endorsement of any material contained on any linked site. IC Markets is not liable for any harm caused by the transmission, through accessing the services or information on this site, of a computer virus, or other computer code or programming device that might be used to access, delete, damage, disable, disrupt or otherwise impede in any manner, the operation of the site or of any user’s software, hardware, data or property.


