
EUR/USD:
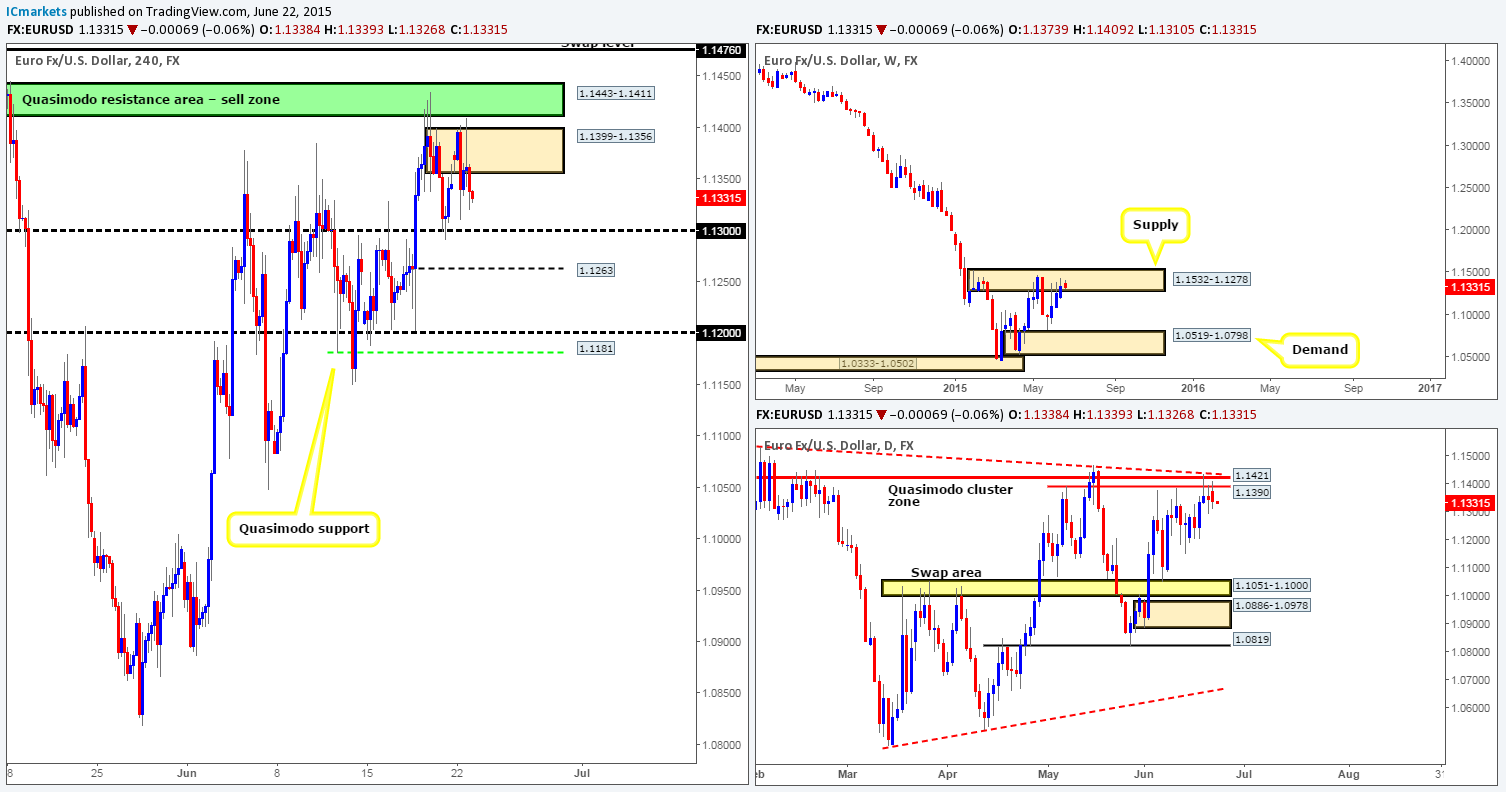
Weekly view: From the weekly timeframe, we can see that price is lingering within a weekly supply area at 1.1532-1.1278. This supply zone is a very significant hurdle in our opinion (held price lower since the 11th May) since if there’s a sustained break above this area, our long-term bias (currently short) on this pair will very likely shift north.
Daily view: Yesterday’s market action printed a bearish engulfing candle around the underside of a daily Quasimodo cluster zone at 1.1390/1.1421 (located relatively deep within the aforementioned weekly supply area), which, as you can see, converges beautifully with a daily trendline extended from the high 1.1532.
4hr view: The 4hr timeframe shows that the Euro remained in a volatile mood during the course of yesterday’s sessions as the market awaited the outcome of the EU leaders Summit. As far as we can tell, a deal has yet to be finalized regarding Greece, so the wait continues!
From a technical standpoint, however, the market did see a brief sell off from the 4hr supply area coming in at 1.1399-1.1356, which we did not trade due to there being little confirming price action seen on the lower timeframes. Following this, price aggressively spiked above this area and attacked the lower limits of the 4hr Quasimodo resistance base seen in green at 1.1443-1.1411. In normal market conditions, we would have likely had a pending sell order set here, but with the uncertainty brewing around the Euro currency at the moment, we have decided to play it safe.
Despite all of the above, the Euro is in a fantastic position (see higher timeframes in bold) to sell off. As such, we’re going to continue watching the two aforementioned 4hr areas for potential (confirmed) sell opportunities. In addition to this, we’re also keeping the 4hr swap level seen at 1.1476 on our watchlist as well, since this barrier has held nicely in the past.
Levels to watch/live orders:
- Buys: Flat (Stop loss: N/A).
- Sells: 1.1399-1.1356 [Tentative – confirmation required] (Stop loss: 1.1404) 1.1443-1.1411 [Tentative – confirmation required] (Stop loss: dependent on where one confirms this area, but would likely be around the 1.1469 mark) 1.1476 [Tentative – confirmation required] (Stop loss: dependent on where one confirms this level).
GBP/USD:
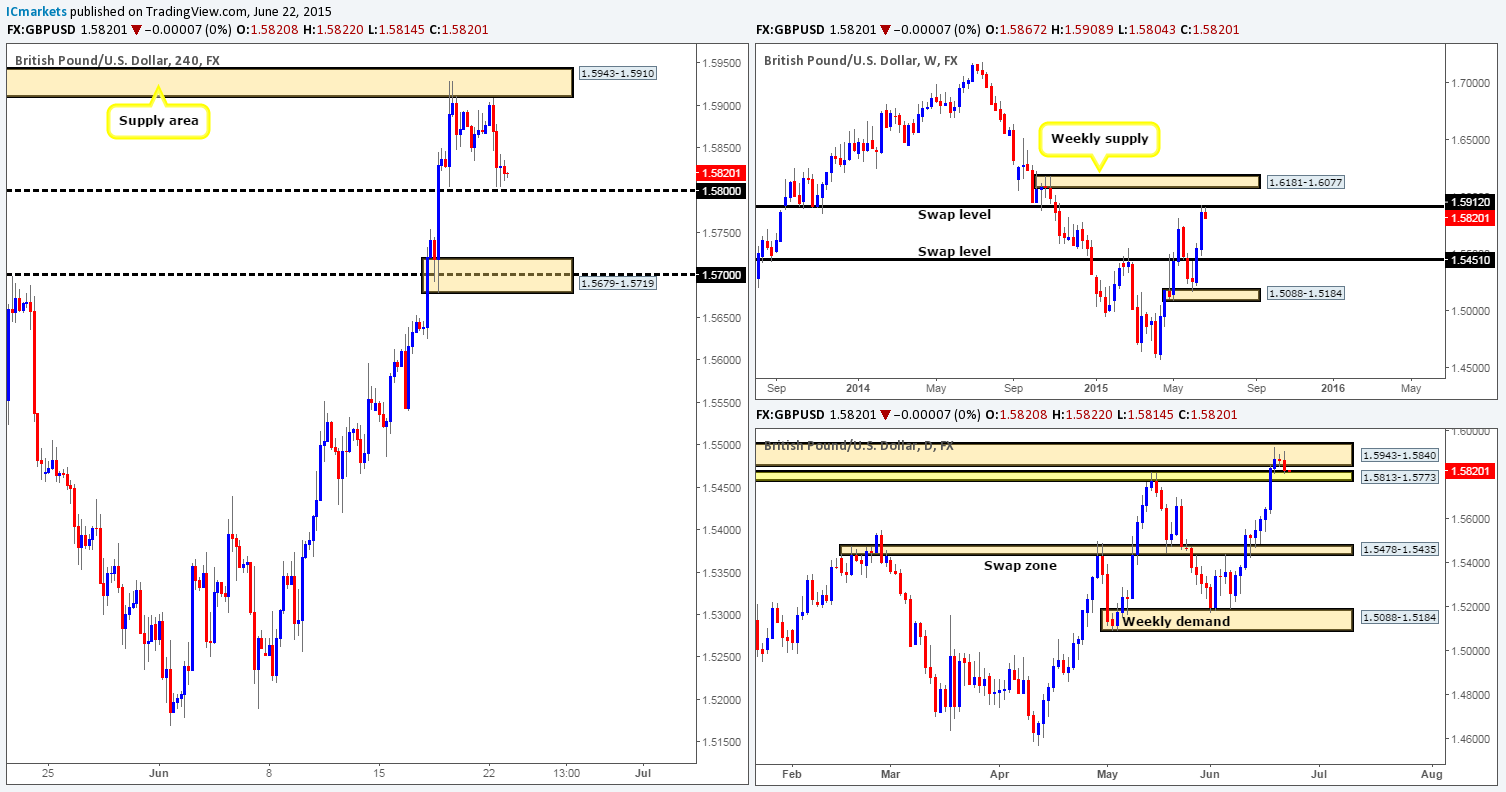
Weekly view – Following the two-week advance, selling interest is currently being seen around the underside of a very significant weekly swap level coming in at 1.5912.
Daily view: From this viewpoint, we can see that price formed a nice looking bearish engulfing candle within the confines of a daily supply area at 1.5943-1.5840 (encapsulates the aforementioned weekly swap level). Nonetheless, just below this zone sits potential support in the form of a daily swap zone marked in yellow at 1.5813-1.5773. If we can get below here, this market will likely sell off.
4hr view: Throughout the course of yesterday’s sessions, the GBP aggressively sold off from the 4hr supply area at 1.5943-1.5910 (located deep within the daily supply area mentioned above at 1.5943-1.5840) down towards the 1.5800 region. For those who read our previous report, you may recall us mentioning that this 4hr zone was the only place we’d consider shorting at the moment. Unfortunately, we did not see any suitable setup on the lower timeframes to condone risking capital on this idea.
Considering the fact that resistive pressure is being seen from the higher timeframe zones (see above in bold), our team is naturally favoring shorts over longs at this time. However, we have no plan to sell this market until 1.5800 is taken out. Should this level be consumed, and a retest is seen that shows lower timeframe selling strength, we’d likely short this market, targeting the 4hr demand area at 1.5679-1.5719.
We guess you could say this is a risky trade, as we would be effectively shorting into the aforementioned daily swap zone in yellow. However, with the historical significance the weekly swap level at 1.5912 (presently holding the market lower) brings to the table, we feel relatively confident price will push lower.
Levels to watch/ live orders:
- Buys: Flat (Stop loss: N/A).
- Sells: Flat (Stop loss: N/A).
AUD/USD:
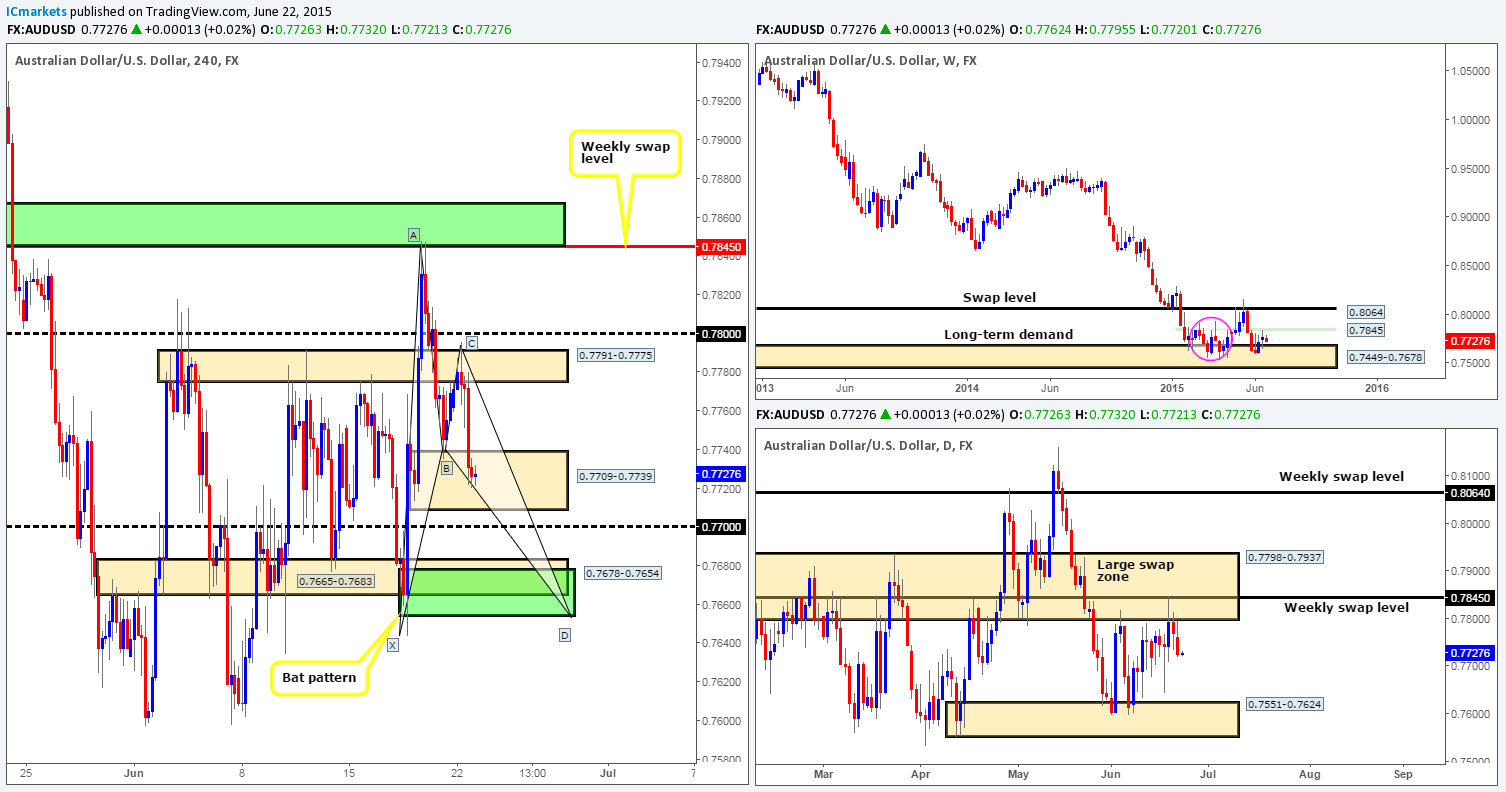
Weekly view – Following the rebound seen from the long-term weekly demand area at 0.7449-0.7678, price connected with a minor weekly swap level coming in at 0.7845 last week, consequently forming a weekly indecision candle. Judging by the sloppy reaction seen (pink circle – 02/02/15-06/04/15) between these two aforementioned weekly areas a few months ago, things could potentially get messy here again before we see any decisive move take place. From a long-term perspective, nonetheless, the trend direction on this pair is still very much south in our opinion, and will remain this way until we see a convincing break above 0.8064.
Daily view: From the pits of the daily scale, we can see that price has begun to consolidate (mid-range at the time of writing) between 0.7798-0.7937 (a large daily swap zone that surrounds the aforementioned weekly swap level), and 0.7551-0.7624 (a daily demand area that is located within the aforementioned weekly demand zone).
4hr view: After price shook hands with the 4hr swap area at 0.7791-0.7775, this market crashed down into the 4hr demand area at 0.7709-0.7739. We still have 30% of our existing position live in the market from the short we took back up at 0.7842 on Thursday. We are planning to try and let this trade run down to the 4hr Harmonic Bat reversal zone seen in green at 0.7678-0.7654, which converges beautifully with a 4hr swap area at 0.7665-0.7683.
Going into today’s sessions, however, we would personally not be comfortable entering long from the current 4hr demand zone at 0.7709-0.7739, or the round number 0.7700 seen below it for the following reasons:
- Buy-side liquidity was likely weakened at the 4hr demand on the first touch seen on Friday at 0.7735 (B point).
- Price is trading mid-range on the daily chart at the moment (see chart).
- Weekly timeframe is currently indecisive.
In the event that both the 4hr demand and round number 0.7700 gives way, it is likely price will reach our final take-profit target – the aforementioned 4hr Harmonic Bat reversal zone. For anyone that’s considering entering long at this zone, it is possible that this area could very well be ignored, simply because the daily timeframe shows there is room to move below this zone toward the lower limits of the daily range (see daily analysis). Therefore, waiting for lower timeframe buying confirmation is strongly advised here.
Levels to watch/ live orders:
- Buys: 0.7678-0.7654 [Tentative – confirmation required] (Stop loss: 0.7640).
- Sells: 0.7842 [Live] (Stop loss: breakeven).
USD/JPY:
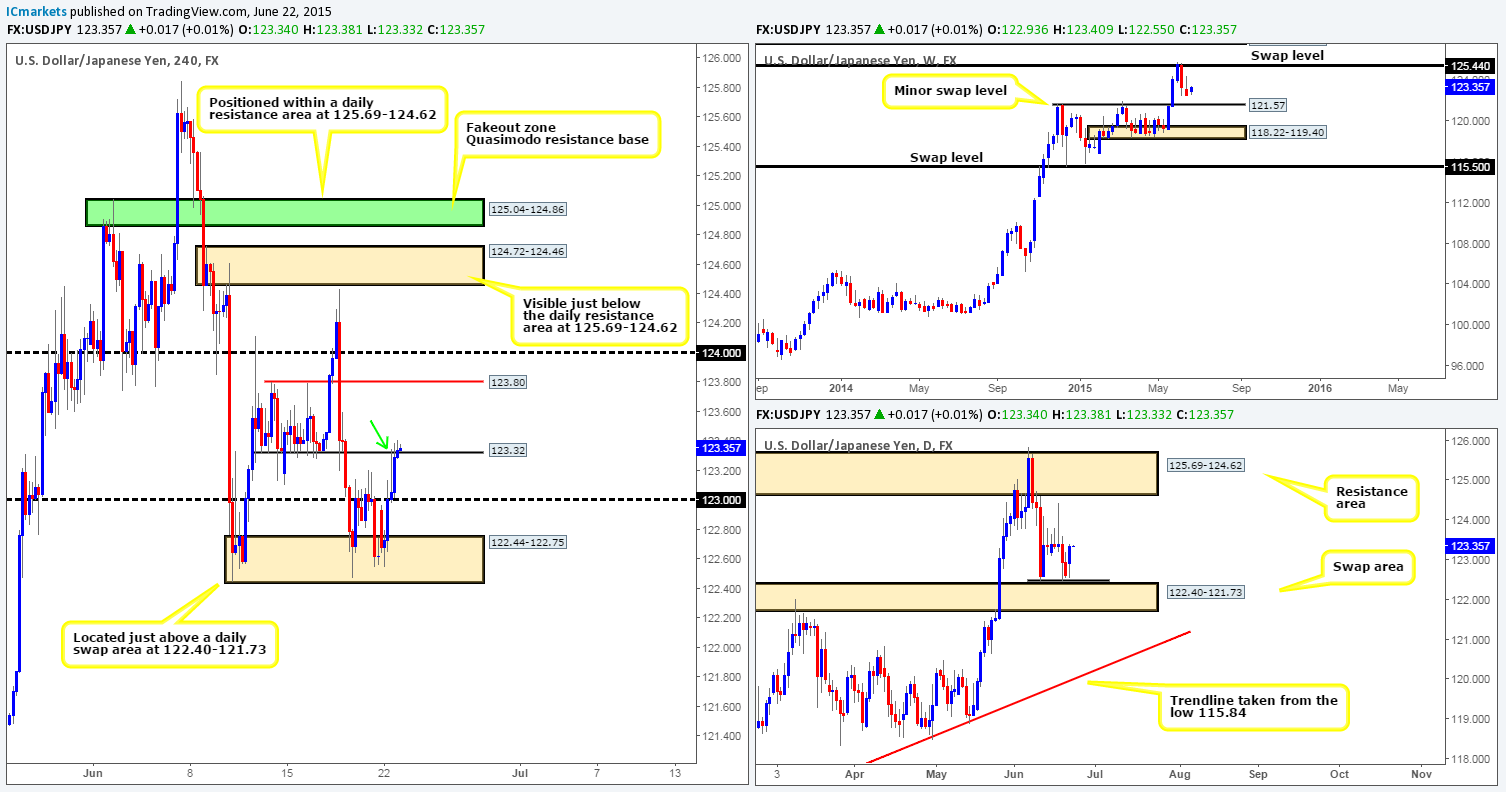
Weekly view – Following the rebound seen from the weekly swap level at 125.44, price extended lower last week. On the assumption that the sellers can continue holding this market lower this week, we believe there’s a very good chance that price will greet the minor weekly swap level seen at 121.57. Despite this recent decline in value, however, the long-term uptrend on this pair is still very much intact, and will remain that way in our opinion until the weekly swap level 115.50 is consumed.
Daily view: The daily timeframe shows that buying interest was seen during yesterday’s session from around the low 122.44 (10/06/2015), which has effectively created a double-bottom formation just above the daily swap area at 122.40-121.73.
4hr view: The recent advance on this pair saw price take out the round number 123.00, and jab itself into a minor 4hr swap level at 123.32. At the time of writing, it appears sell-side liquidity is severely weak around this hurdle, the spike higher (pin bar shape) seen marked with a green arrow at 123.34 likely filled the majority of sellers here, and the response was further buying which equates to weakness in our book.
Provided that the buyers can CONVINCINGLY close above 123.32 today, it is very likely that price will continue north towards the 4hr Quasimodo resistance level at 123.80, or even the round number seen just above it at 124.00. This equates to a possible 50-pip move at least, and as long as we see some sort of retest at 123.32 with supporting lower timeframe confirmation, we would likely take a long entry here. With that being said though, this trade will (at least for us anyway) require constant monitoring since let’s not forget that by buying here, we’re effectively going against current weekly direction (see above in bold).
Levels to watch/ live orders:
- Buys: Flat (Stop loss: N/A).
- Sells: Flat (Stop loss: N/A).


