
Key risk events today:
UK Public Sector Net Borrowing; BoE Governor Bailey Speaks; Fed Chair Jerome Powell Testifies.
(Previous analysis as well as outside sources – italics).
EUR/USD:
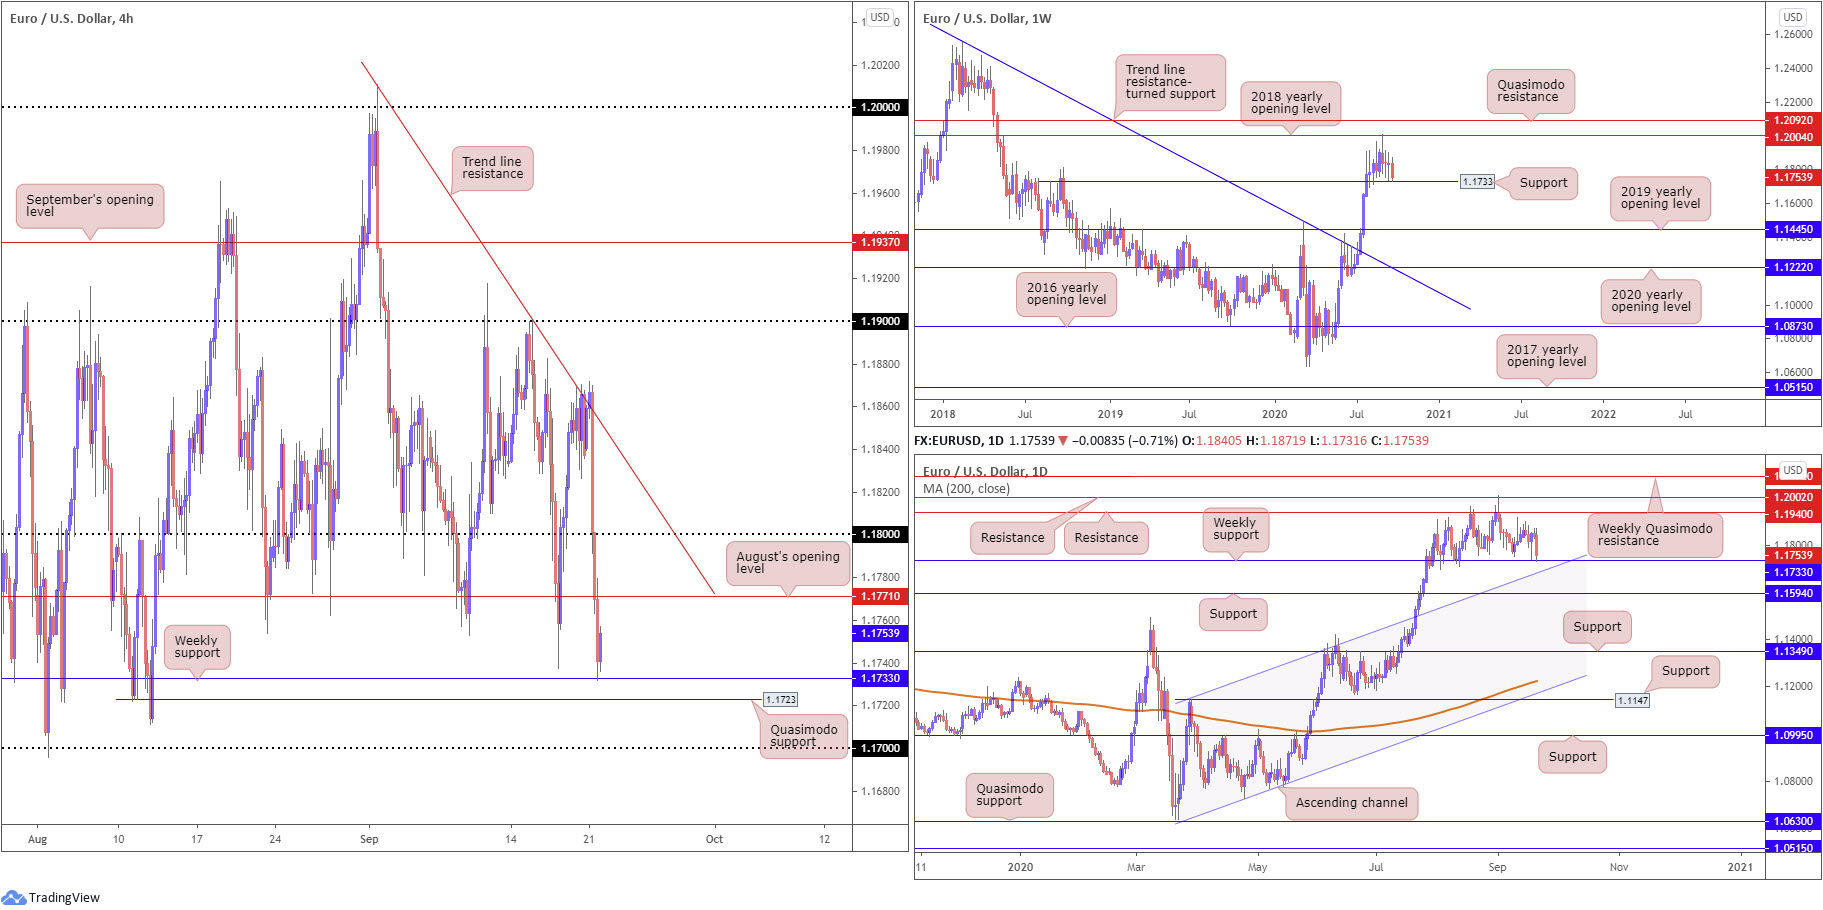
The US dollar rebounded strongly across the board Monday amid a sharp pick-up in risk aversion, consequently sending EUR/USD decisively south of H4 trend line resistance, extended from the high 1.2010. 1.18 and August’s opening level at 1.1771 on the H4 timeframe came under fire, leaving the path clear for a test of weekly support at 1.1733 (a prior Quasimodo resistance level). The latter, as you can see, has so far held ground, sited just north of Quasimodo support at 1.1723 and the 1.17 handle (H4).
On the weekly timeframe, support, as highlighted above, can be found at 1.1733, with resistance plotted at the 2018 yearly opening level at 1.2004, the 2018 yearly opening value sited just south of Quasimodo resistance priced in at 1.2092. Violating current support will likely shift focus back to the 2019 yearly opening level at 1.1445.
Since transitioning into the month of August, weekly support (1.1733) has proven effective on the daily timeframe, as has daily resistance coming in at 1.1940 and 1.2002. Passing 1.2002 shifts focus to the weekly Quasimodo resistance stated above at 1.2092, whereas dipping sub 1.1733 on the daily scale welcomes daily channel resistance-turned support, extended from the high 1.1147.
Areas of consideration:
We are at key support on the weekly timeframe and the pair has been trending higher since March (daily timeframe). On account of this, some traders will likely be targeting bullish scenarios today. H4, however, reveals a dip through weekly support could be seen to Quasimodo support at 1.1723. In addition to this, August’s opening level at 1.1771 might put forward some resistance, as could 1.18.
Should we sell-off to the 1.17 base on the H4, there’s a possibility a fakeout could be seen into the aforementioned channel resistance-turned support on the daily timeframe (currently positioned around 1.1688) before buyers make an appearance. A H4 bullish hammer pattern formed here, therefore, might appeal to buyers.
GBP/USD:
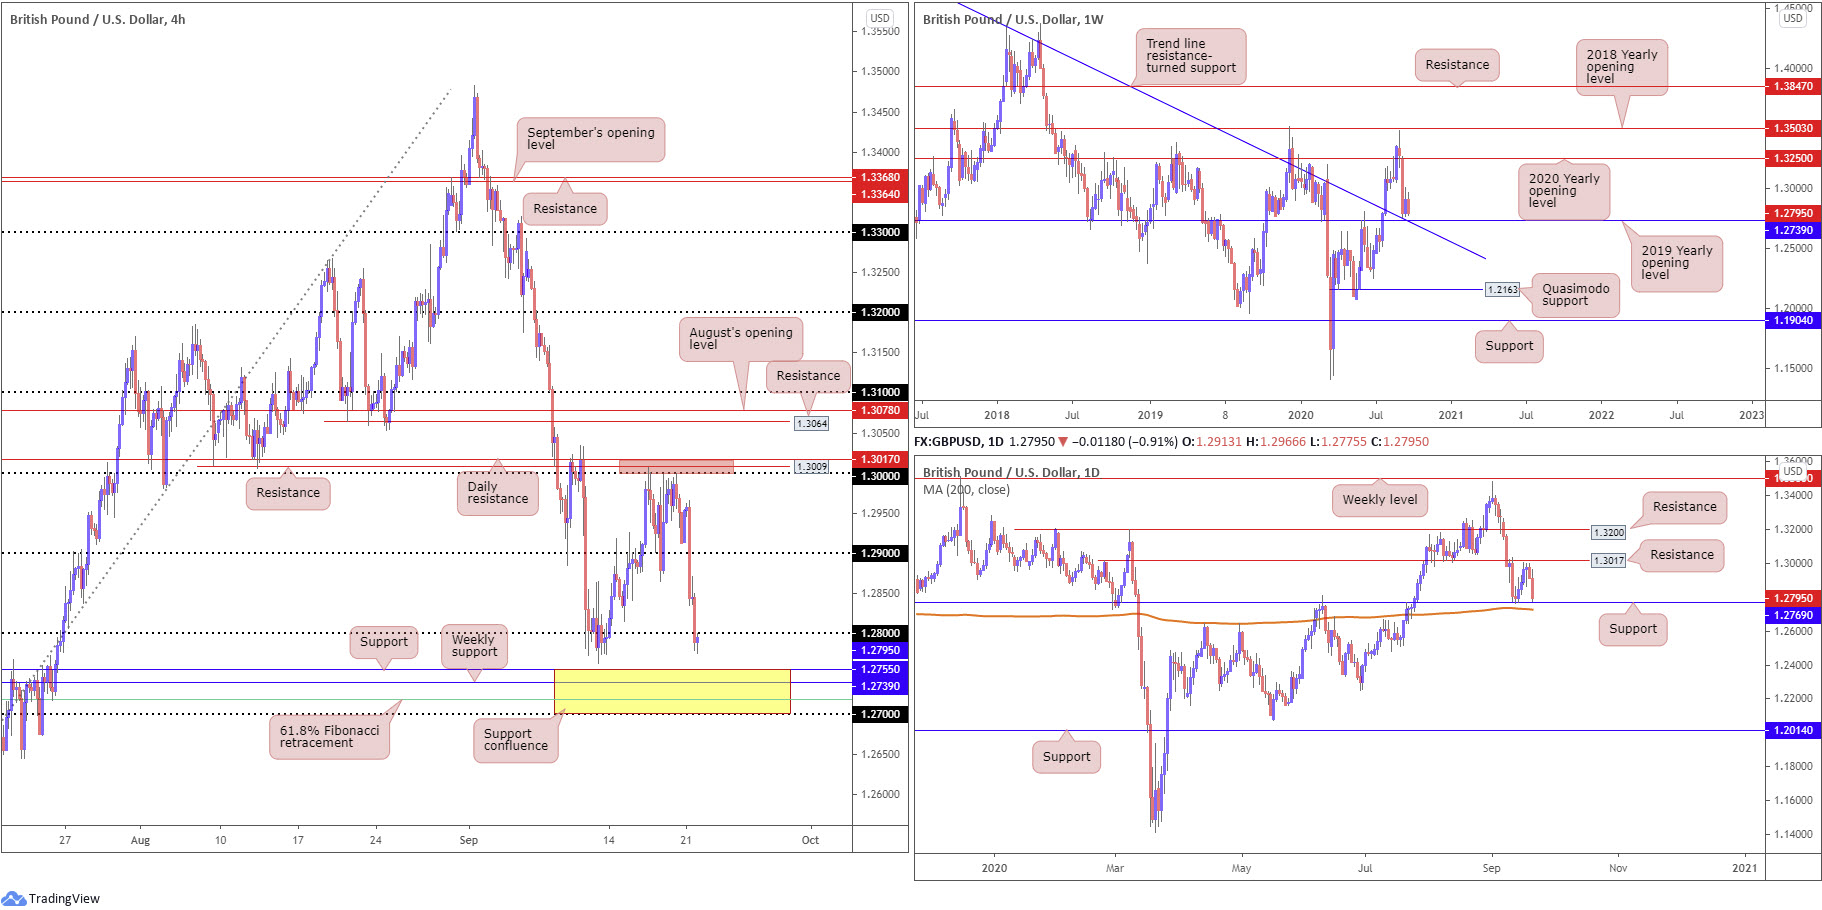
Unable to escape Monday’s risk rout and dollar recovery, sterling bobbed under 1.29 and 1.28 against the buck (H4). Technically, this has landed GBP/USD within striking distance of interesting support between 1.27/1.2755 ([yellow] made up of the 1.27 handle on the H4, a 61.8% H4 Fibonacci retracement ratio at 1.2718 [green], weekly support plotted at 1.2739 [the 2019 yearly opening level] and H4 support at 1.2755). In addition to this, traders may also wish to acknowledge the 200-day SMA (orange – 1.2727) resides within the support zone, as well as a weekly trend line resistance-turned support, taken from the high at 1.5930.
Areas of consideration:
While intraday bearish themes are likely present around the underside of 1.28, traders with a focus on multi-timeframe analysis will be conscious of the support mentioned above at 1.27/1.2755 as within it carries some heavyweight levels.
AUD/USD:
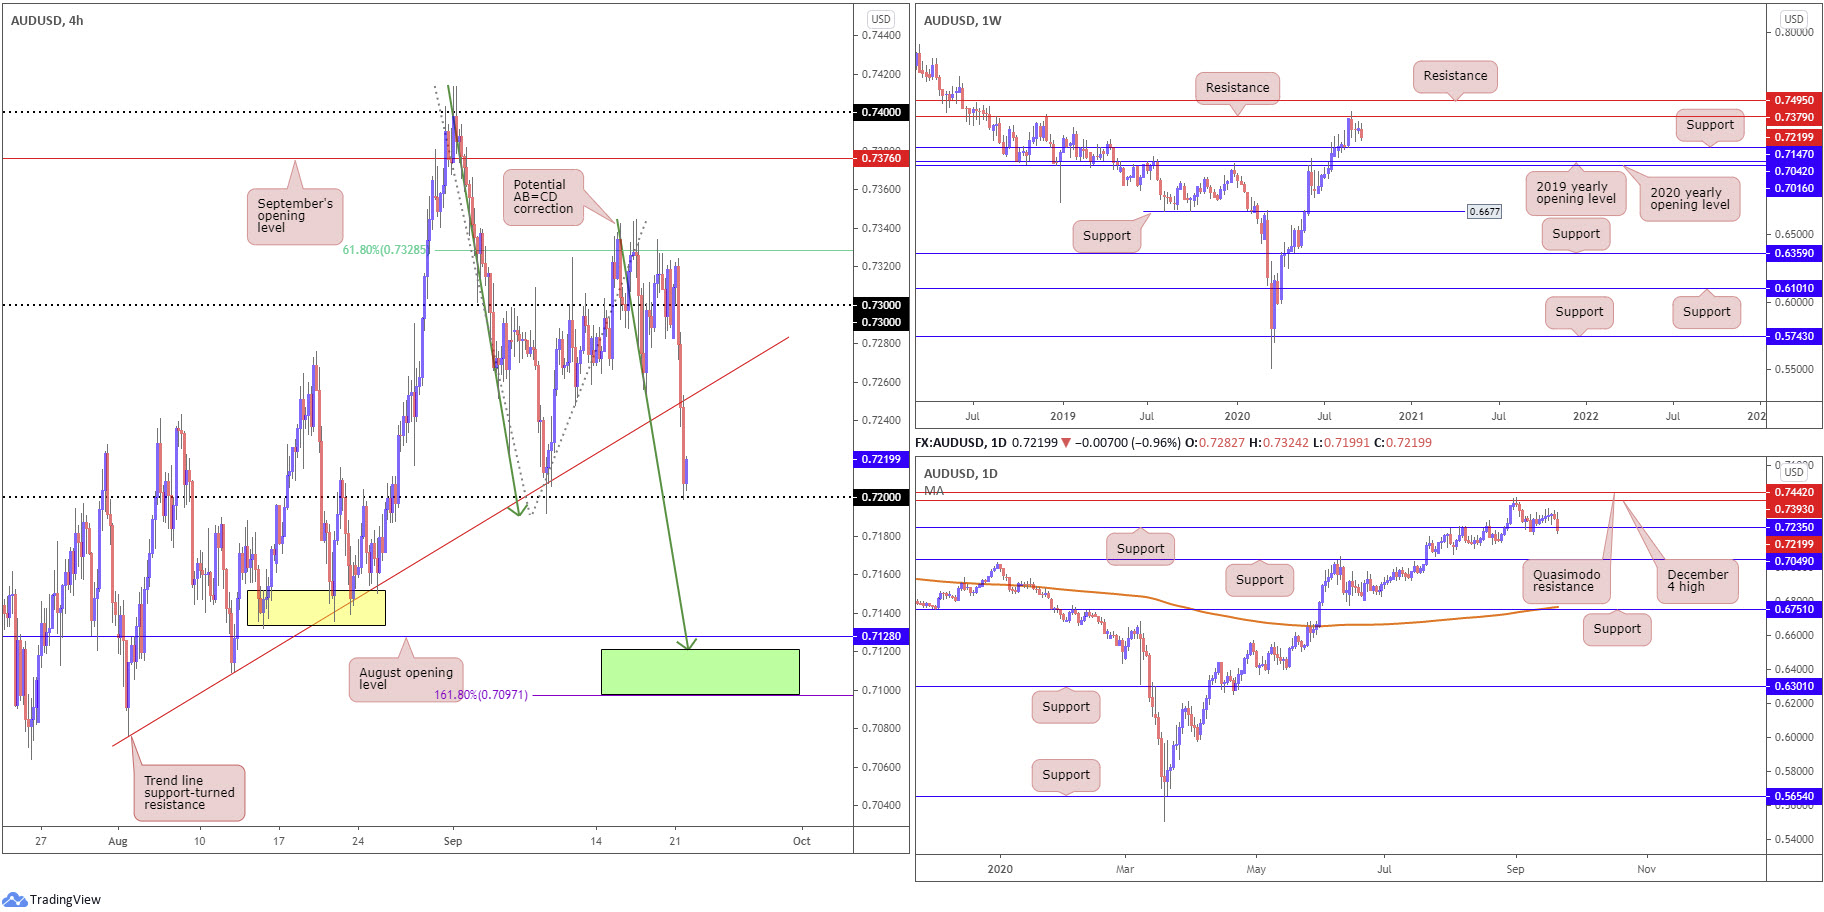
Risk aversion boosted demand for the US dollar on Wednesday, sending AUD/USD lower, taking out 0.73 and trend line support, etched from the low 0.7076, to test 0.72 on the H4. Beyond 0.72, lows around the 0.7138ish range could be next on the hit list, followed by August’s opening value at 0.7128. Also of interest is a potential AB=CD correction (green arrows) at 0.7120 and a 1.618 BC projection at 0.7097 (green).
Weekly sellers south of resistance at 0.7379 on the weekly timeframe appear poised to target support at 0.7147, with a break exposing the 2020 and 2019 yearly opening values at 0.7016 and 0.7042, respectively. On the daily timeframe, support at 0.7235 is under pressure, with continued downside likely to target another layer of support at 0.7049.
Areas of consideration:
Keeping things simple this morning, sellers appear to have the advantage on the higher timeframes. Weekly price shows room to drop towards support at 0.7147, and support at 0.7235 on the daily timeframe recently gave way, consequently placing 0.72 in a fragile position on the H4 scale.
As a result, a H4 close beneath 0.72 puts forward a bearish cue to approach weekly support at 0.7147, followed by 0.7140ish on the H4 timeframe.
USD/JPY:
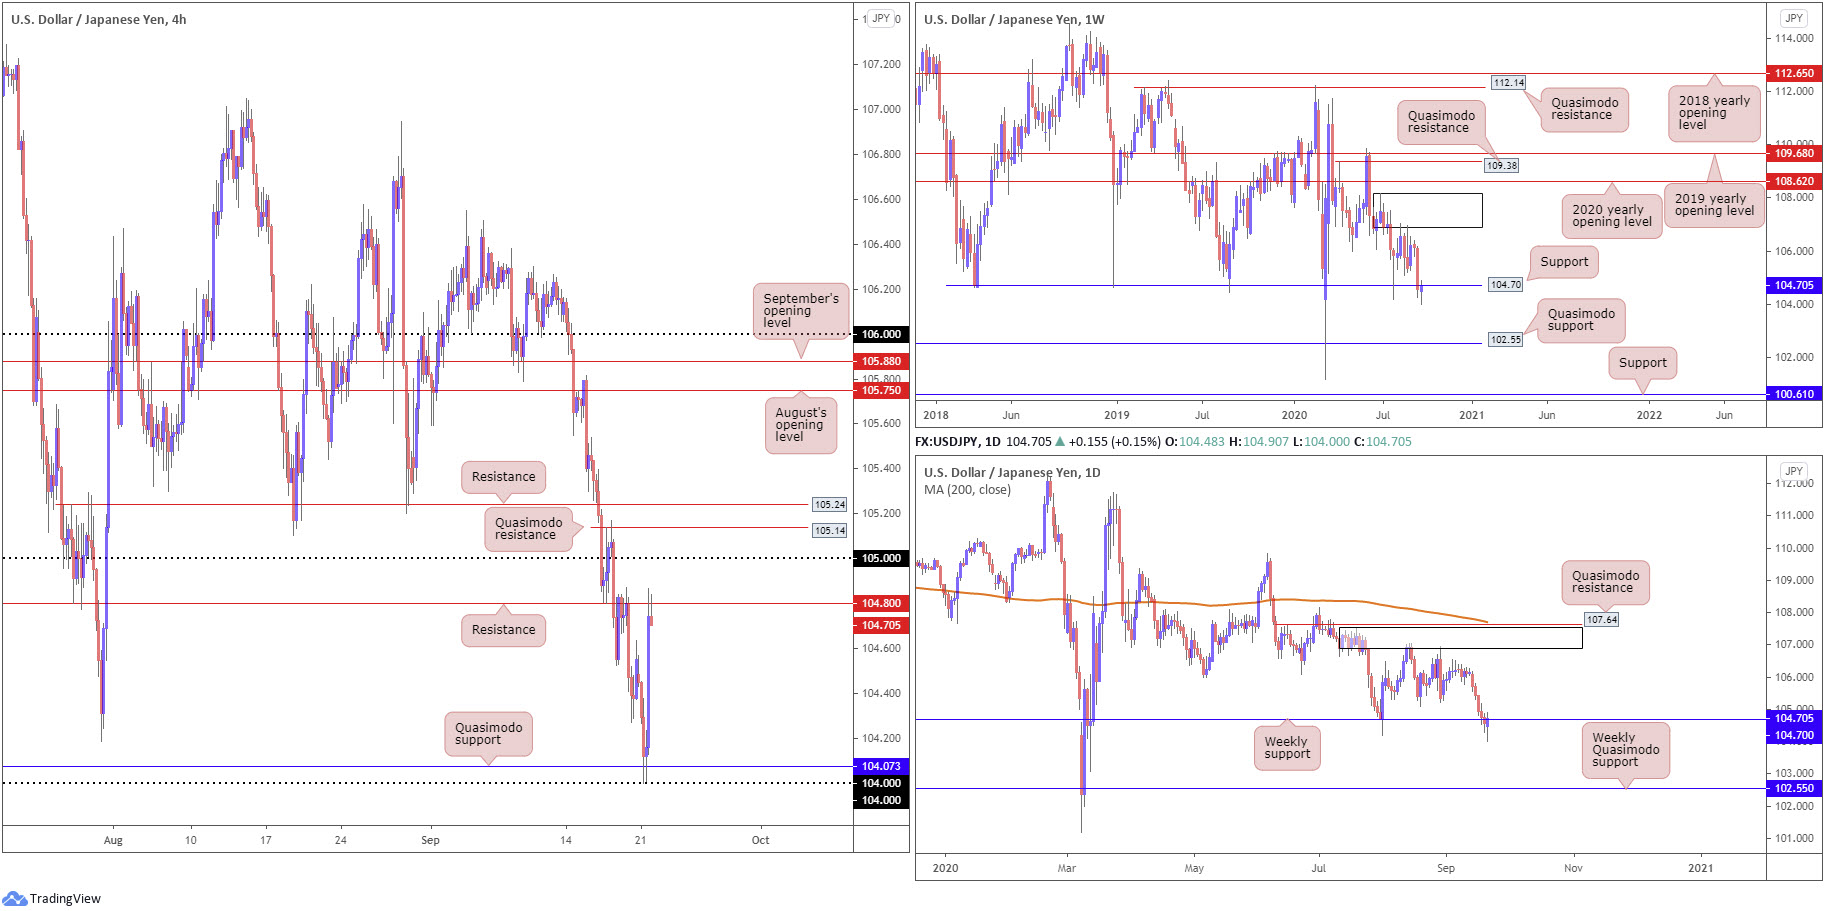
USD/JPY sunk to lows not seen since March on Monday as investors sought the perceived safety of the Japanese yen amidst risk-off flows.
USD strength, however, permitted a decisive rebound from 104 and H4 Quasimodo support at 104.07 in the second half of the US session. This led to H4 resistance at 104.80 entering the fight, which, as you can see, holds for the time being. North of here, 105 is visible psychological resistance, followed by Quasimodo resistance at 105.14 and another resistance close by at 105.24.
On the higher timeframes, we can see the unit attempting to regain footing above weekly support at 104.70.
Areas of consideration:
In order to climb above weekly support at 104.70 and make any progress, H4 resistances at 104.80, 105, 105.14 and 105.24 must be cleared.
Therefore, should we overthrow H4 resistance at 105.24, bullish themes could be found to take the currency pair up to at least August’s opening level at 105.75.
Should H4 hold resistance at 104.80, this is a sign weekly buyers unlikely have enough gas in the tank to take things higher. In this case, bearish scenarios could be found to drive price back to the 104ish region.
USD/CAD:
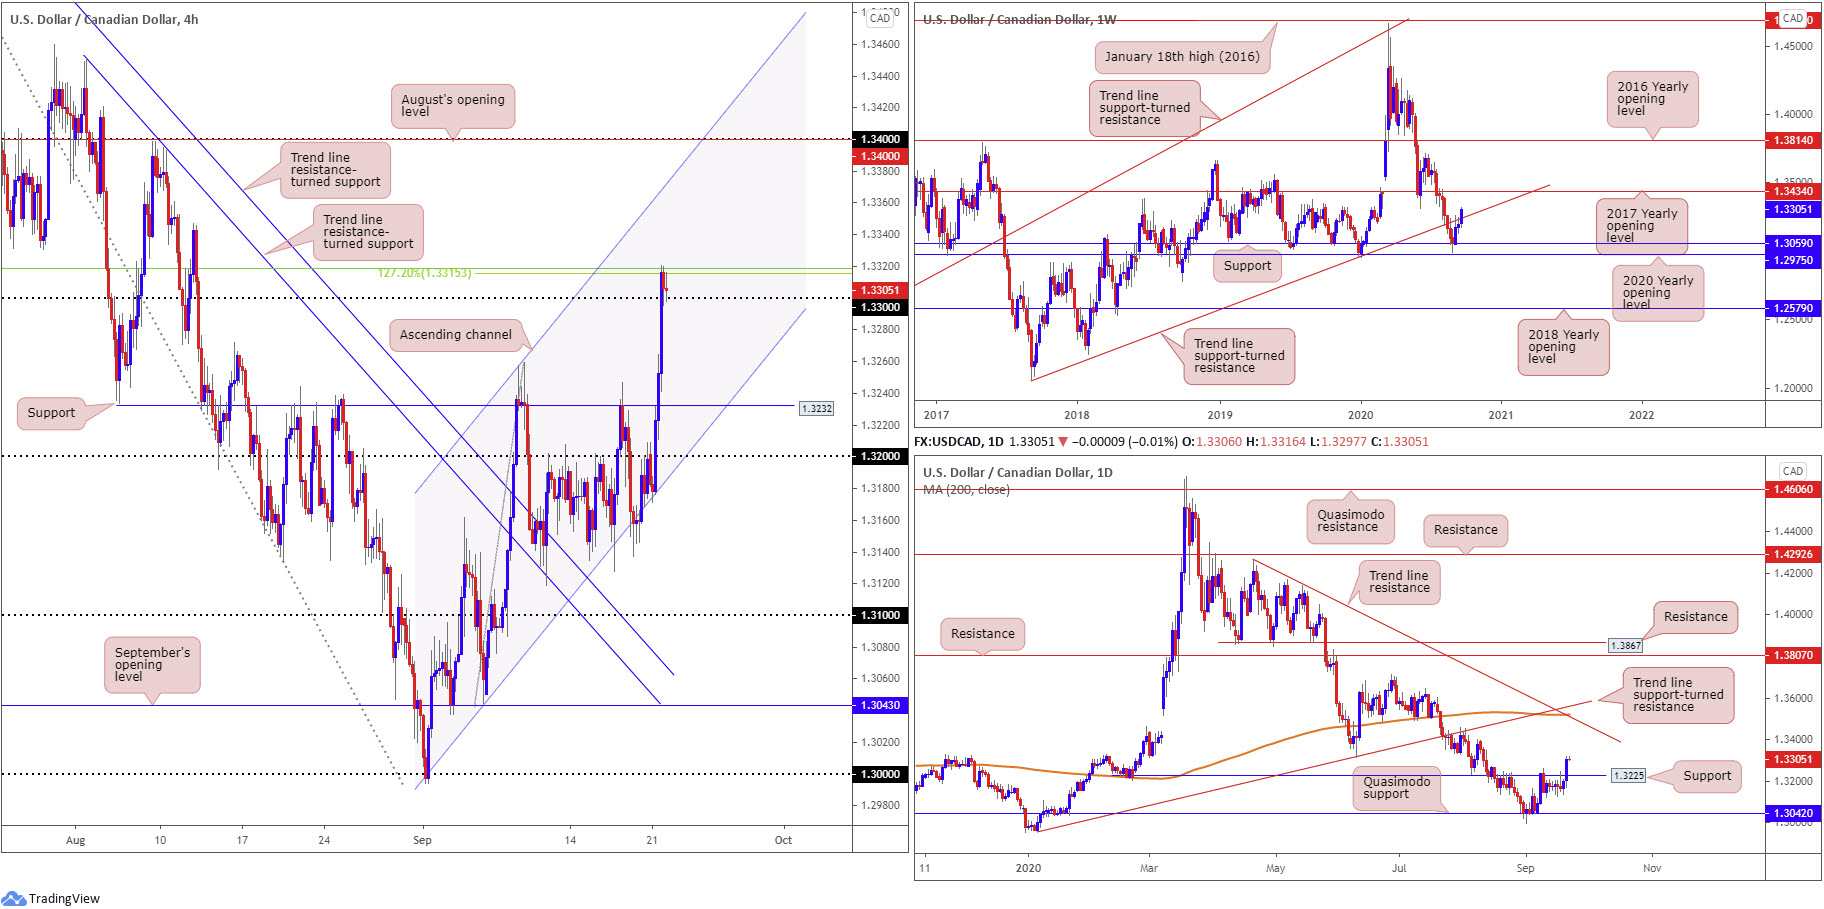
The US dollar rose sharply higher against its Canadian counterpart yesterday, kicking off the week registering a 0.8% gain. The US dollar gleaning fresh demand amid safe-haven flows, in addition to WTI prices collapsing to lows at $38.67 a barrel, lifted USD/CAD to fresh pinnacles at 1.3320.
H4 ran through 1.32 and resistance at 1.3232 Monday to surpass 1.33 and test a 127.2% Fibonacci extension point at 1.3315 and a 50.0% retracement ratio at 1.3318. Fuelled on buy-stop liquidity and selling pressure from the noted Fibs, a H4 close back under 1.33 could be seen today, followed by a sell-off.
Following a stronger-than-expected recovery off support at 1.3059, pinned just north of the 2020 yearly opening level at 1.2975 on the weekly timeframe, weekly price has taken on trend line support-turned resistance, taken from the low 1.2061. Continued upside highlights the 2017 yearly opening level at 1.3434 as possible resistance.
A closer reading of price action on the daily timeframe reveals resistance at 1.3225 gave way yesterday. In terms of resistance beyond 1.3225, we do not see much to hang our hat on until crossing swords with trend line resistance, etched from the high 1.4265, which happens to align closely with the 200-day SMA (orange – 1.3520). Also in close view is trend line support-turned resistance, taken from the low 1.2957. However, before reaching the said daily levels, we must contend with weekly resistance around 1.3434.
Areas of consideration:
Based on the current technical picture, it’s unlikely price will deliver much downside under 1.33, despite the H4 picture lining up well for a fakeout scenario. This is largely due to both the weekly and daily timeframes hinting at further upside.
As a result of the above findings, bullish themes found above the H4 Fib resistances could pull price as far north as the 1.34 handle on the H4, followed by weekly resistance placed at 1.3434 (the 2017 yearly opening level).
The accuracy, completeness and timeliness of the information contained on this site cannot be guaranteed. IC Markets does not warranty, guarantee or make any representations, or assume any liability regarding financial results based on the use of the information in the site.
News, views, opinions, recommendations and other information obtained from sources outside of www.icmarkets.com.au, used in this site are believed to be reliable, but we cannot guarantee their accuracy or completeness. All such information is subject to change at any time without notice. IC Markets assumes no responsibility for the content of any linked site.
The fact that such links may exist does not indicate approval or endorsement of any material contained on any linked site. IC Markets is not liable for any harm caused by the transmission, through accessing the services or information on this site, of a computer virus, or other computer code or programming device that might be used to access, delete, damage, disable, disrupt or otherwise impede in any manner, the operation of the site or of any user’s software, hardware, data or property.


