
EUR/USD:
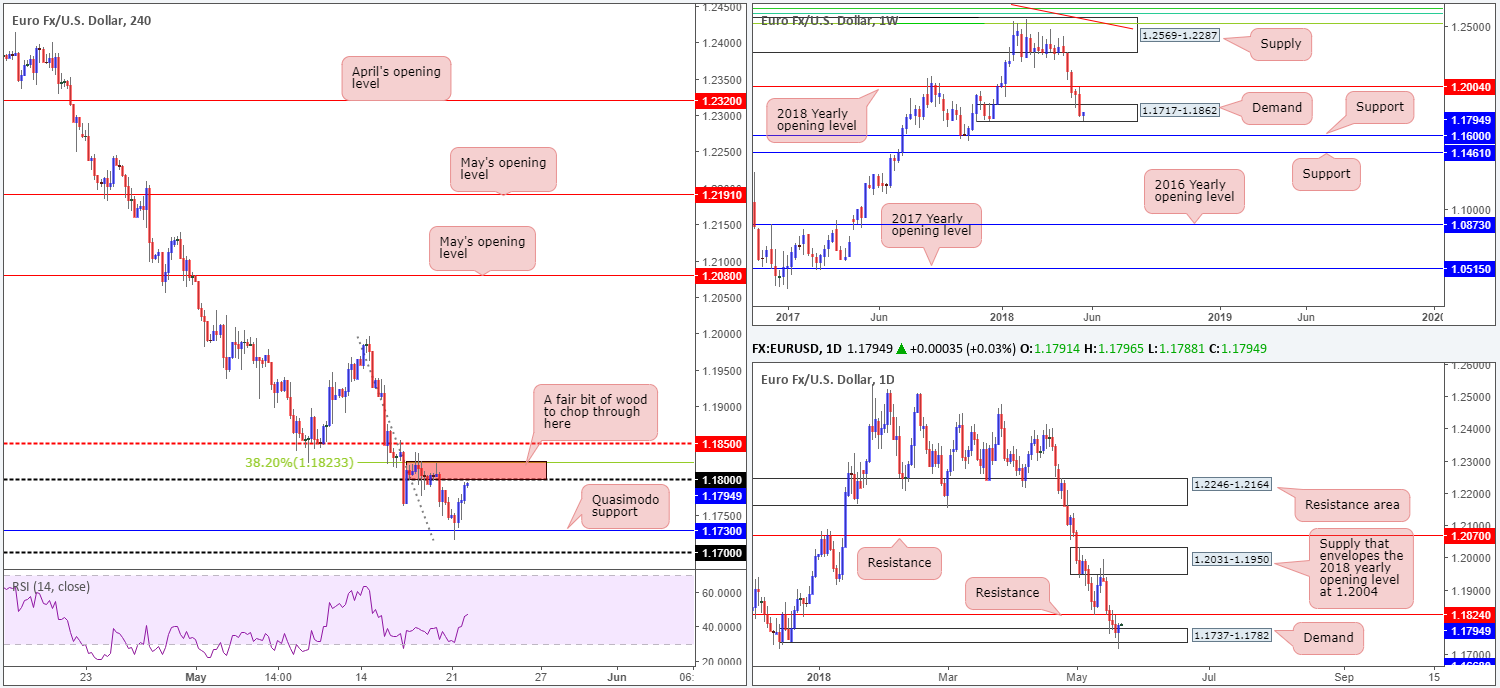
A reasonably impressive comeback took place in recent trade from fresh 2018 lows. A mildly fading USD helped bolster the euro off a H4 Quasimodo support level at 1.1730. As you can see, price rallied to highs of 1.1795 from this point, consequently breaking a five-day bearish phase. Despite this bullish vibe, though, do remain cognizant of the 1.1823/1.18 region marked in red on the H4 timeframe. Comprised of a round number and a 38.2% H4 Fib resistance, this base could potentially cap recovery gains today.
The story over on the bigger picture shows weekly price recovering from within the lower limit of a weekly demand base at 1.1717-1.1862. In the event that this area holds, the next port of call to the upside is seen at 1.2004: a 2018 yearly opening level. A violation of this zone, on the other hand, places the spotlight on weekly support at 1.1600.
A little lower on the curve, we can see that daily movement recently whipsawed through a demand base at 1.1737-1.1782, and chalked in a nice-looking bullish pin-bar formation. Further buying from this point will likely bring in nearby daily resistance at 1.1824.
Areas of consideration:
Although we’re seeing a flicker of activity within the depths of weekly demand right now, H4 sellers are likely to make an appearance between 1.1823/1.18. Not only is the zone comprised of a round number and a 38.2% H4 resistance value, there’s also nearby daily resistance plotted one pip above the base at 1.1824.
In response to the above, possible selling opportunities could be on the cards today between 1.1824/1.18. Conservative traders may wish to wait and see if H4 price can print a full or near-full-bodied bearish candle from the zone before pulling the trigger. This will, of course, not guarantee a winning trade, but it will show possible intent. The first take-profit target to the downside can be seen at the aforementioned H4 Quasimodo support, followed closely by the 1.17 handle.
Today’s data points: Limited.
GBP/USD:
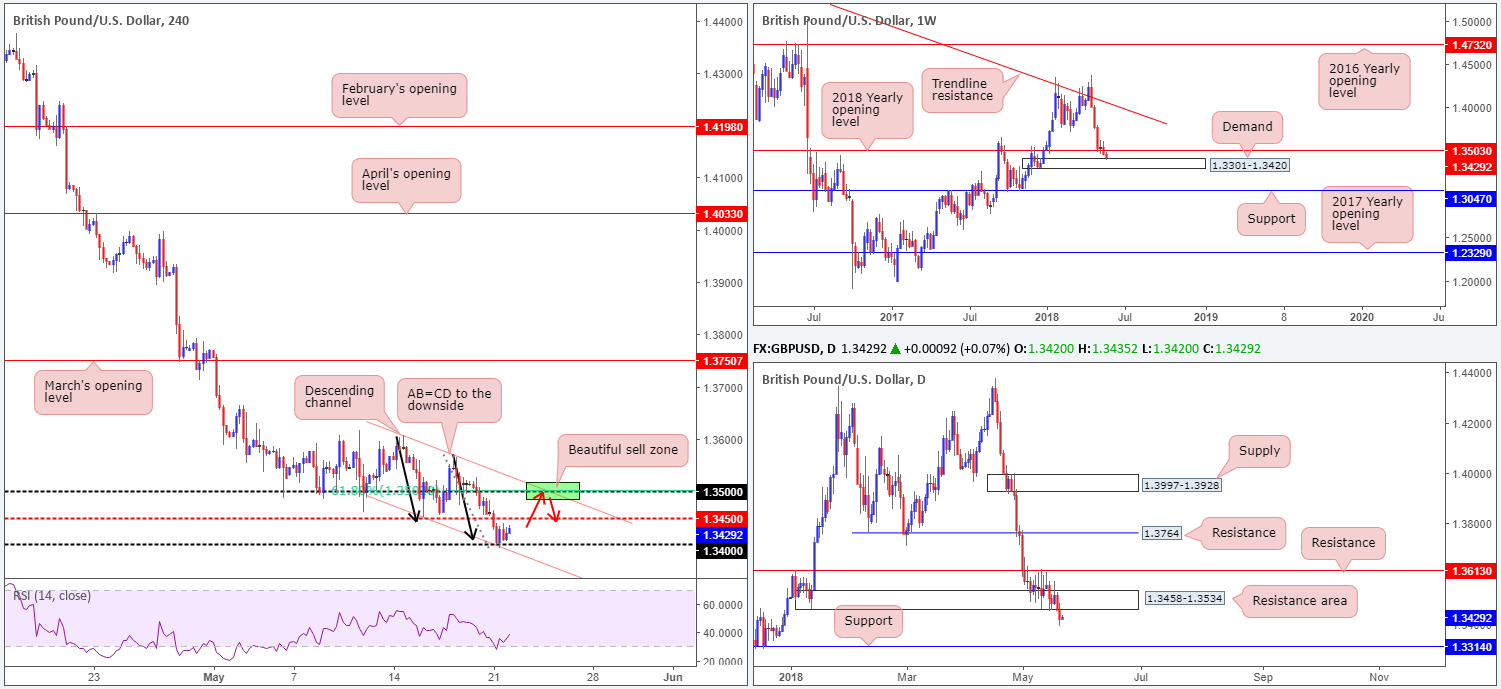
In recent dealings, the British pound fell to fresh YTD lows after breaching the H4 mid-level support at 1.3450 amidst yet more negative Brexit news. The 1.34 handle, as you can see, provided a floor for the buyers to regain themselves, accompanied by a H4 channel support taken from the low 1.3451 and a (see black arrows) H4 AB=CD to the downside extended from the high 1.3608.
Daily demand at 1.3458-1.3534 was recently engulfed in reasonably strong fashion, potentially prompting traders to target daily support pegged at 1.3314. Individually, this has likely brought in sellers.
While selling could very well continue, traders may want to note that weekly demand at 1.3301-1.3420 is currently in play, which could effectively rotate price and retest nearby weekly resistance at 1.3503: the 2018 yearly opening level.
Areas of consideration:
Ultimately, we’re looking for the GBP to extend its bounce off 1.34 toward 1.35 for possible shorts. Why we like this area can be boiled down to the following:
- 1.35 is a watched round number.
- 61.8% H4 Fib resistance value aligning with 1.35.
- H4 channel resistance taken from the high 1.3608 converges nicely with 1.35.
- Seen positioned within the walls of the daily resistance area at 1.3458-1.3534.
- Positioned just three pips beneath the 2018 yearly opening level mentioned above on the weekly timeframe.
In regard to stop-loss orders, above the top edge of the current daily resistance area appears to be the safest location (1.3534). As for the first take-profit target, eyes will likely be on 1.3450 on the H4 timeframe.
In addition to the above, traders may also want to note that the BoE will present its inflation report today with Gov. Carney testifying before the UK’s Parliament Treasury Committee. Traders will be looking for clues on whether an August rate hike is possible or not.
Today’s data points: MPC member Vlieghe speaks; UK public sector net borrowing; UK inflation report hearings.
AUD/USD:
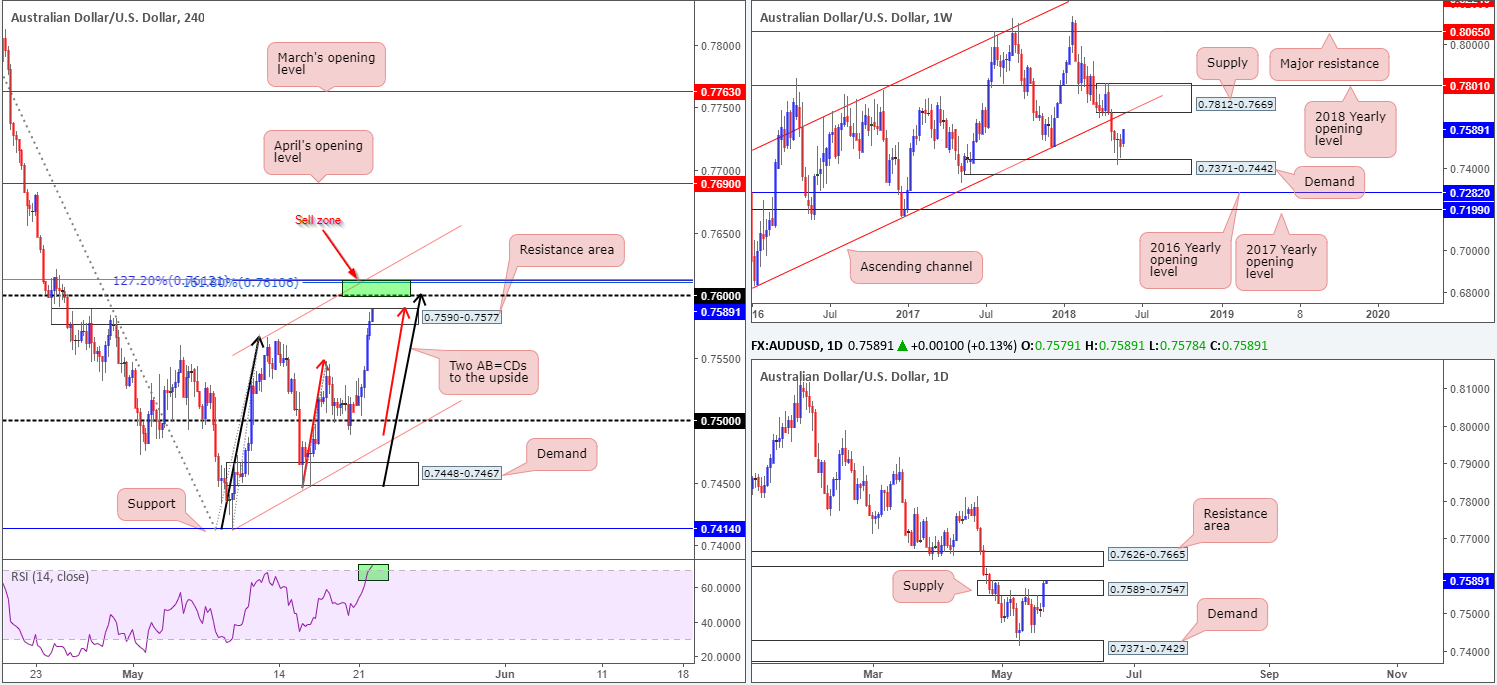
The Australian dollar kicked off the week on a high note, as broader FX markets saw a healthy resurgence of risk appetite. Up 0.91% on the day, the H4 candles are currently seen testing a H4 resistance area at 0.7590-0.7577, alongside daily price challenging the top edge of a daily supply at 0.7589. While the H4 resistance area may hold, the team have highlighted a particularly interesting base of resistance seen just above at 0.7613/0.76, comprised of the following structures:
- Round number 0.76.
- H4 50.0% resistance value at 0.7613.
- Two H4 AB=CD formations that complete nicely around the 0.7610 point (see red and black arrows).
- Nearby H4 channel resistance taken from the high 0.7566.
Despite the above, one also has to take into account that weekly price shows potential to continue advancing higher until we reach weekly supply penciled in at 0.7812-0.7669, which happens to intersect with a weekly channel support-turned resistance taken from the low 0.6827.
Areas of consideration:
0.7613/0.76 is likely to hold price action lower today. Whether this will attract sellers into the market is difficult to judge, though, given the position of price on the weekly timeframe. A H4 bearish close beneath 0.7590-0.7577 would be a good indication of seller strength and could mean an eventual revisit of 0.75.
Today’s data points: Limited.
USD/JPY:
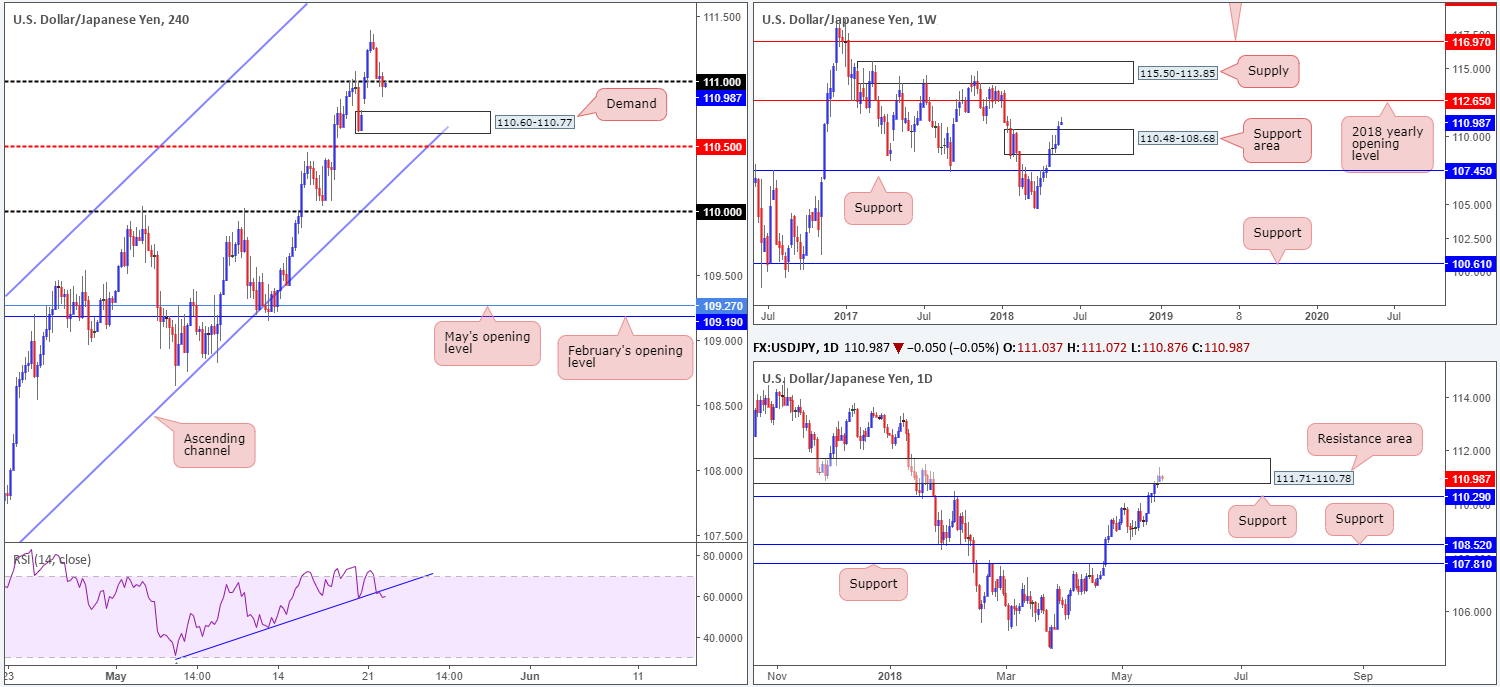
During the course of Monday’s movement, the USD/JPY clocked fresh highs of 111.39 before pulling back and reclaiming the 111 handle. H4 price, as you can see, remains bearish beneath 111 as we head into Asia today, which could lead to a move being seen down toward H4 demand at 110.60-110.77. Further adding to this, a H4 RSI trend line support was recently breached, supporting a possible move to the downside.
Looking over to the weekly picture, however, there’s room seen for the pair to rally as far north as the 2018 yearly opening level at 112.65. Before this occurs, though, a retest of the recently broken weekly supply (now acting support area) at 110.48-108.68 could be seen. On the other side of the spectrum, daily price is seen interacting with a resistance area formed at 111.71-110.78 in the shape of a daily bearish pin-bar formation. A move lower from here has the daily support at 110.29 to target.
Areas of consideration:
Intraday sellers could attempt to capture a move from beneath 111 down to H4 demand at 110.60-110.77, shadowed closely by the H4 mid-level support at 110.50. Those wishing to hold out for a test of the daily support mentioned above at 110.29 as a final take-profit target may want to consider taking a large portion of their position off the table at 110.50, seeing as how it fuses nicely with the top edge of the weekly support area noted above at 110.48.
Today’s data points: Limited.
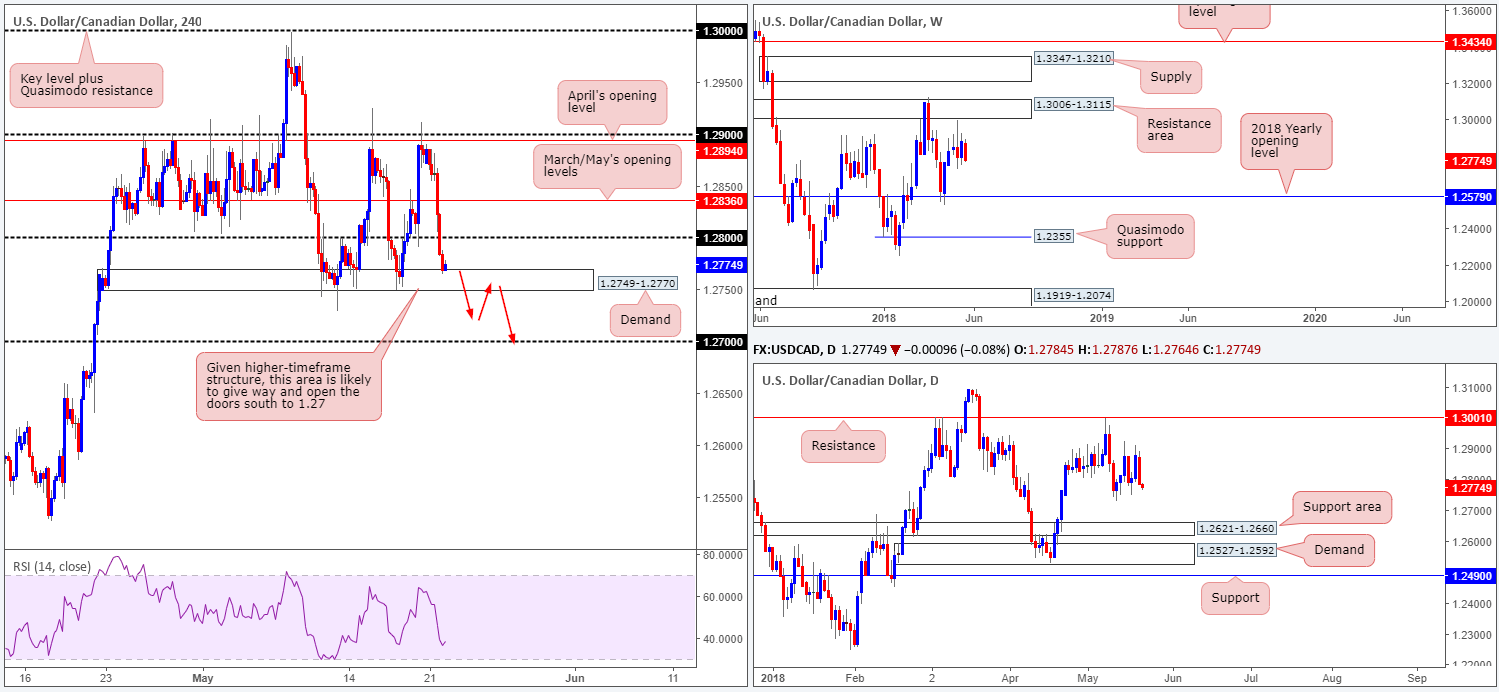
USD/CAD:
A strong Canadian dollar as well as a modest retreat in the USD market, pushed the USD/CAD pair aggressively lower amidst trade on Monday. March/May’s opening levels seen on the H4 timeframe at 1.2836, along with the 1.28 handle, was abruptly taken out, leaving the H4 demand at 1.2749-1.2770 in the offing.
After coming within inches of tapping the underside of a weekly resistance area at 1.3006-1.3115 two weeks ago, the pair continues to reflect a somewhat bearish vibe. According to the weekly scale, further selling could be seen as far south as the 2018 yearly opening level at 1.2579. In conjunction with weekly flow, daily movement also shows room to press lower, with the next downside target not coming into view until we reach a daily support area noted at 1.2621-1.2660. Also worthy of note is the STRONG near-full-bodied daily bearish close seen yesterday.
Areas of consideration:
Selling this market, according to the higher-timeframe structure, is possibly the best path to take at the moment. However, given the current H4 demand remains intact, we feel it’d be more prudent to wait for this area to be consumed before actively looking for shorting opportunities. Should H4 price close beneath this area and follow up with a successful retest as resistance, then shorts are high probability, targeting the 1.27 handle as the initial take-profit zone, followed by the daily support area at 1.2621-1.2660.
Today’s data points: Limited.
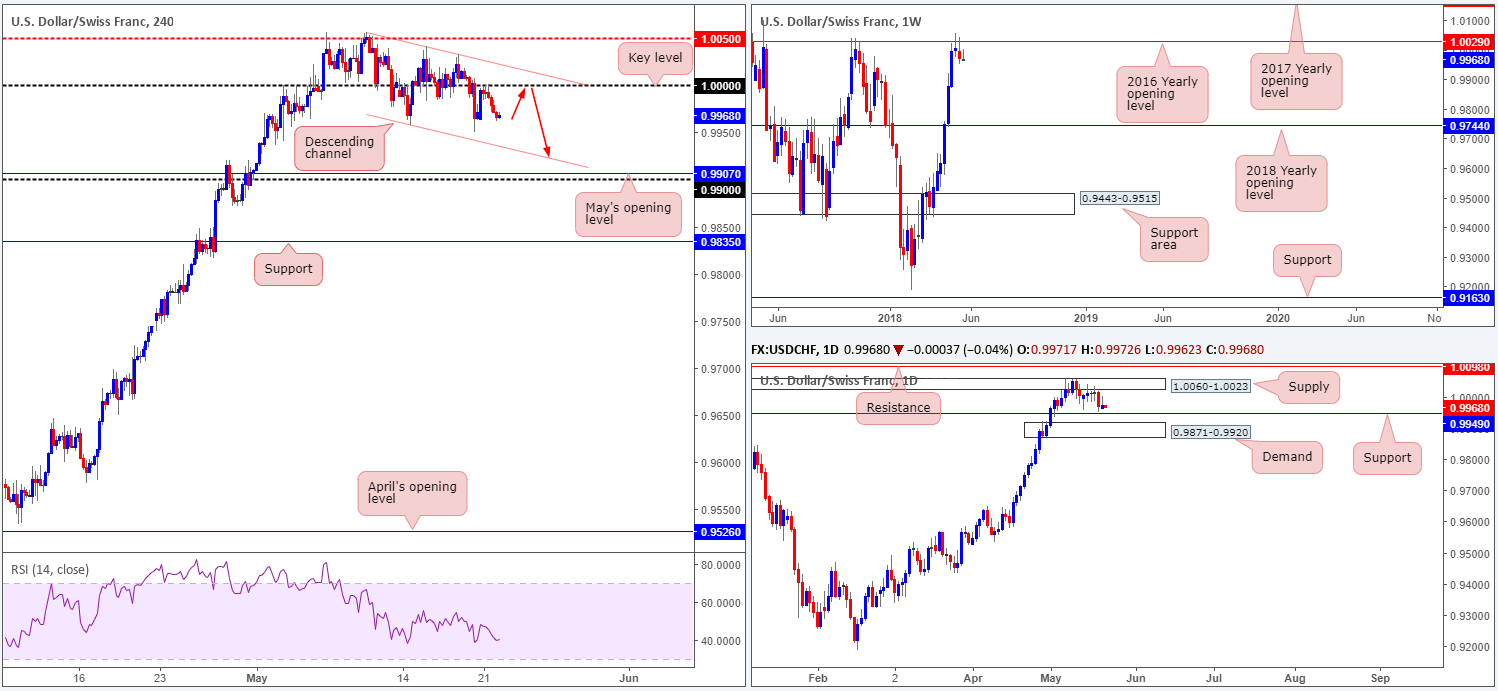
USD/CHF:
Kicking this morning’s report off with a look at the weekly timeframe, it’s clear to see that upward momentum is showing signs of waning off the underside of the 2016 yearly opening level at 1.0029. Continued selling from this point may eventually see the pair reconnect with the 2018 yearly opening level marked at 0.9744. A closer look at price action brings us to the daily timeframe, which highlights nearby daily support at 0.9949 and a daily supply noted at 1.0060-1.0023. A violation of the current support has the daily demand area at 0.9871-0.9920 to target, while a move above the said supply could see price shake hands with daily resistance at 1.0098.
Intraday movement on the H4 timeframe faded the underside of parity (1.0000) beautifully on Monday, after striking lows of 0.9950. You may have also noticed that the H4 candles are currently compressed within a descending channel formation (1.0056/0.9957). Therefore, assuming that the bears remain dominant, the channel support could be next in line for some action!
Areas of consideration:
Entering short at current price would be disastrous from a risk/reward standpoint. To take advantage of further downside in this market, the only option we see currently in play is to wait and see if H4 price can retest 1.0000 again. From here, one is able to position stops above the aforementioned H4 channel and target the opposite end of the channel.
Today’s data points: Limited.
The use of the site is agreement that the site is for informational and educational purposes only and does not constitute advice in any form in the furtherance of any trade or trading decisions.
The accuracy, completeness and timeliness of the information contained on this site cannot be guaranteed. IC Markets does not warranty, guarantee or make any representations, or assume any liability with regard to financial results based on the use of the information in the site.
News, views, opinions, recommendations and other information obtained from sources outside of www.icmarkets.com.au, used in this site are believed to be reliable, but we cannot guarantee their accuracy or completeness. All such information is subject to change at any time without notice. IC Markets assumes no responsibility for the content of any linked site. The fact that such links may exist does not indicate approval or endorsement of any material contained on any linked site.
IC Markets is not liable for any harm caused by the transmission, through accessing the services or information on this site, of a computer virus, or other computer code or programming device that might be used to access, delete, damage, disable, disrupt or otherwise impede in any manner, the operation of the site or of any user’s software, hardware, data or property.


