
Waiting for lower timeframe confirmation is our main tool to confirm strength within higher timeframe zones, and has really been the key to our trading success. It takes a little time to understand the subtle nuances, however, as each trade is never the same, but once you master the rhythm so to speak, you will be saved from countless unnecessary losing trades. The following is a list of what we look for:
- A break/retest of supply or demand dependent on which way you’re trading.
- A trendline break/retest.
- Buying/selling tails/wicks – essentially we look for a cluster of very obvious spikes off of lower timeframe support and resistance levels within the higher timeframe zone.
We typically search for lower-timeframe confirmation between the M15 and H1 timeframes, since most of our higher-timeframe areas begin with the H4. Stops are usually placed 1-3 pips beyond confirming structures.
US dollar index (USDX):
EUR/USD:
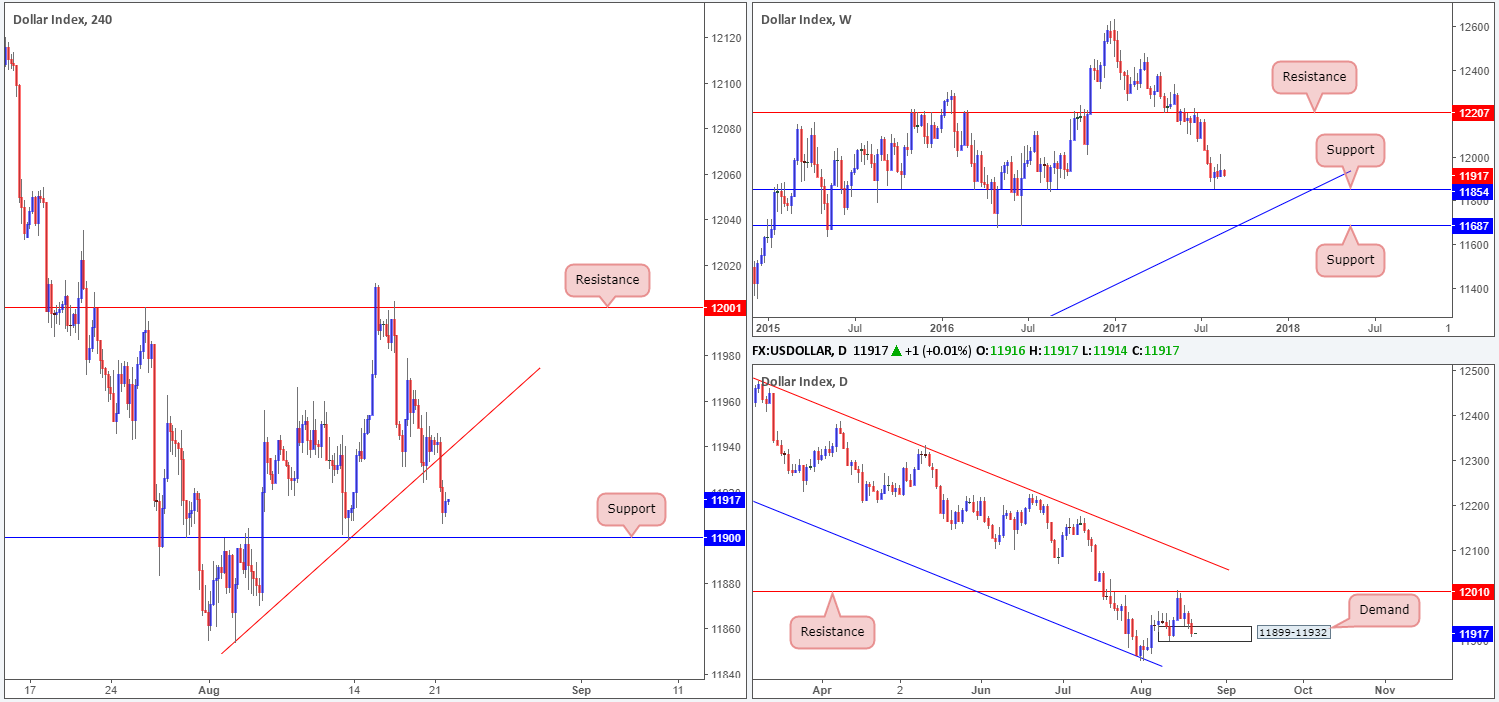
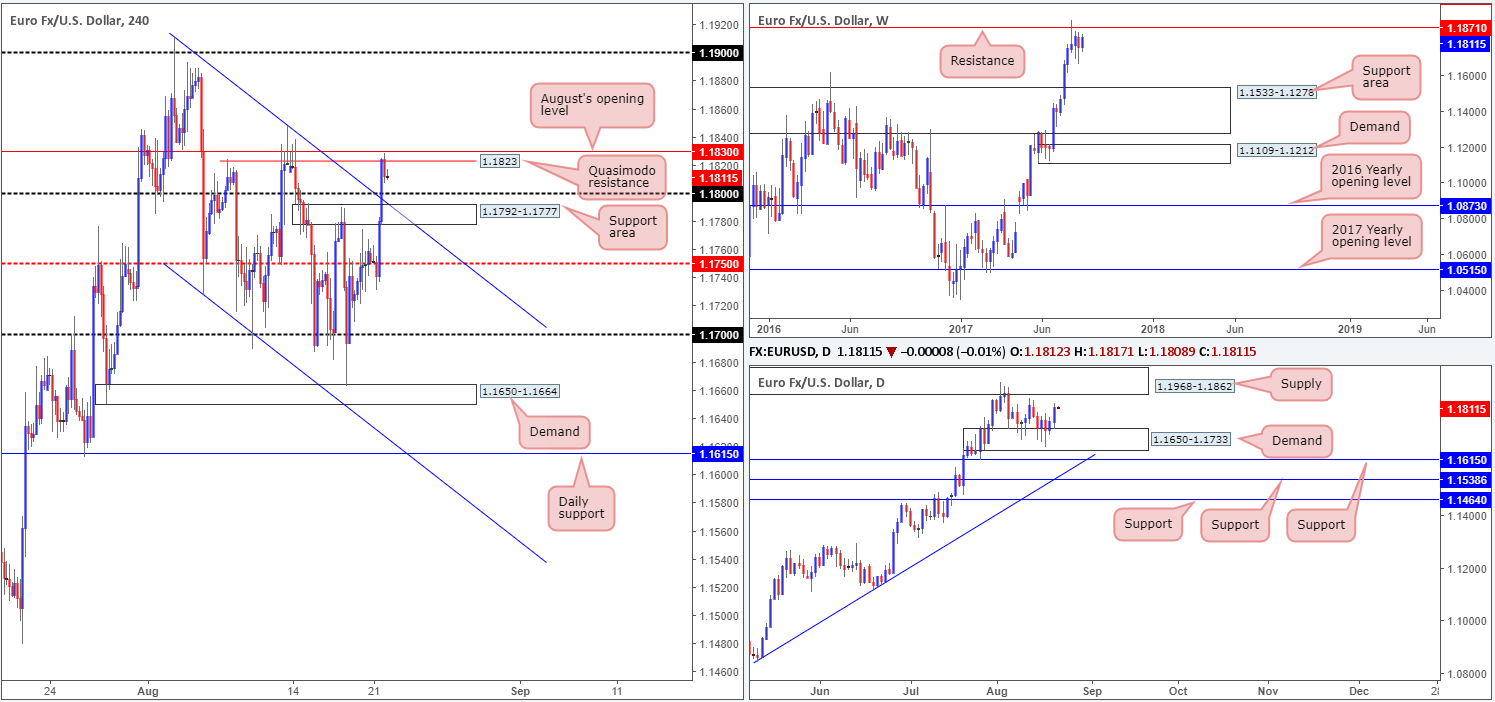
Across the board, we saw the US dollar decline on Monday against the majority of its trading peers. This drove the EUR/USD higher, consequently clearing multiple tech resistances on the H4 timeframe. The single currency settled for the day challenging a H4 Quasimodo resistance pegged at 1.1823, which, as you can see, is shadowed closely by August’s opening level at 1.1830. According to the H4 candles on the US dollar index (USDX), there’s room for the dollar to stretch a little lower before we reach support at 11900. For that reason, there’s a chance the EUR may breach the two current resistances today.
Despite weekly action seen trading from resistance at 1.1871, price has yet to generate anything noteworthy to the downside. A similar picture can be seen on the US dollar index (USDX), only inverse from a weekly support drawn in at 11854. Down on the daily timeframe, demand at 1.1650-1.1733 elbowed its way back into the picture early last week and held firm. Yesterday’s rally from this zone has placed the market within touching distance of supply coming in at 1.1968-1.1862 (encapsulates the current weekly resistance line).
Suggestions: Selling this market is fraught with danger, in our humble view. Not only do we have buying pressure from the aforesaid daily demand zone, we also have a collection of nearby H4 supports lurking below (the 1.18 handle, the support area at 1.1792-1.1777 and a trendline support etched from the high 1.1910). Buying beyond the 1.1830 mark on the other hand looks interesting on the H4 timeframe, but unfortunately somewhat precarious on the daily timeframe given the supply zone positioned above!
Based on these points, opting to stand on the sidelines here may very well be the better path to take today.
Data points to consider: German ZEW economic sentiment at 10am GMT+1.
Levels to watch/live orders:
- Buys: Flat (stop loss: N/A).
- Sells: Flat (stop loss: N/A).
GBP/USD:
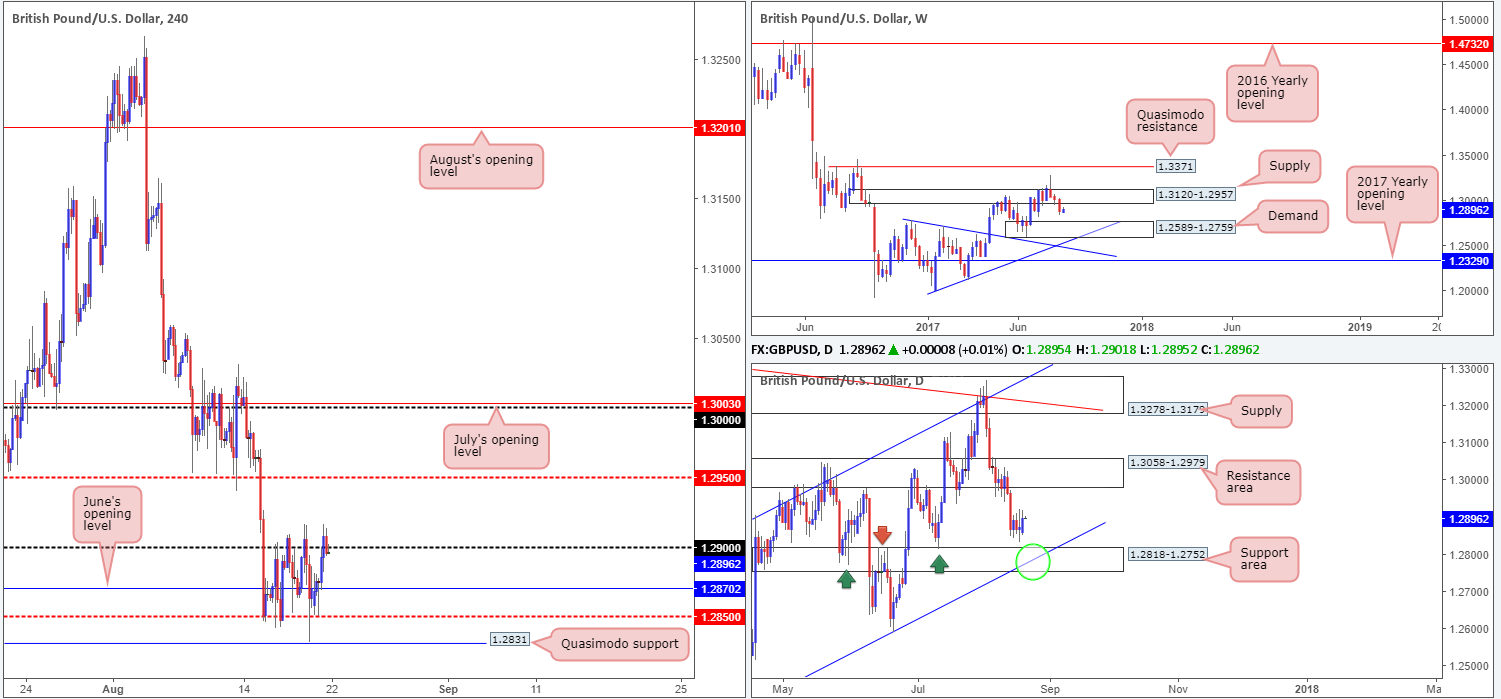
In recent trade, the GBP/USD gathered momentum on greenback weakness. For a week now, the H4 candles have been consolidating between the 1.29 handle and the mid-level support at 1.2850 (encased within this range is June’s opening level at 1.2870). Despite yesterday’s advance, the pair remains confined within this consolidation. With that being said though, the H4 candles on the US dollar index (USDX) show room for the dollar to stretch a little lower before we reach support at 11900. Thus, in a similar fashion to the EUR, we may see the GBP attempt to breach 1.29 again today.
Over on the weekly timeframe, the unit is seen trading beneath supply at 1.3120-1.2957. To the downside, the next notable area to keep an eye on is the demand base coming in at 1.2589-1.2759. What’s also notable from a technical perspective on this chart is the two intersecting trendline supports positioned just beneath the demand zone (1.2774/1.1986). Meanwhile, on the daily timeframe there’s a nearby support area marked at 1.2818-1.2752, seen intersecting nicely with a channel support line etched from the low 1.2365 (green circle). Also of particular interest is this area happens to be glued to the top edge of the aforementioned weekly demand.
Suggestions: In view of the unit’s close proximity to the said daily support area, we’re reluctant to take on any medium/long-term shorts at this time. We know there’s a lot of ground to cover, but we still have our eye on the 1.28 handle for possible longs. Given the support and resistance delivered from this psychological band in the past, and its connection with the converging daily support area and channel support, we feel a trade from here is high probability.
Still, round numbers are prone to fakeouts, and therefore, we would not feel comfortable placing pending orders here. Instead, we’ll wait for a H4 bull candle to form in the shape of a full, or near-full-bodied candle, before pulling the trigger. As for take-profit targets, we’ll be looking to the 1.2850 neighborhood as the initial area of concern.
Data points to consider: No high-impacting events scheduled to be released today.
Levels to watch/live orders:
- Buys: 1.28 region ([waiting for a reasonably sized H4 bullish candle to form – in the shape of either a full, or near-full-bodied candle – is advised] stop loss: ideally beyond the candle’s tail).
- Sells: Flat (stop loss: N/A).
AUD/USD:
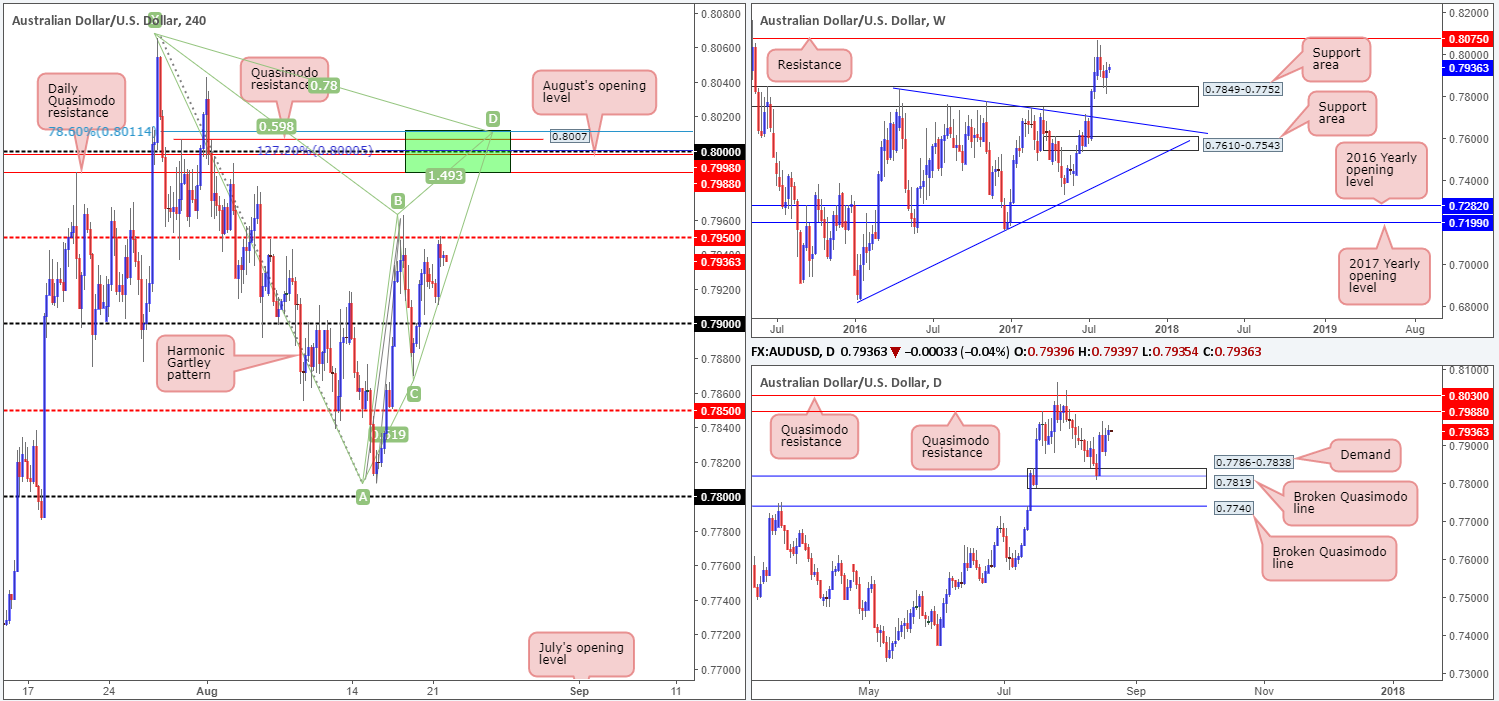
During the course of Monday’s sessions, dollar losses nudged the commodity currency higher. Try as it might though, the H4 candles were unable to muster enough strength to breach the mid-level resistance at 0.7950. A break above this number would likely lead to price challenging the large psychological 0.80 level. This is largely due to there being little to no active supply seen beyond 0.7950. Apart from 0.80 being a watched round number, there are several nearby structures that deserve mention:
- The daily Quasimodo resistance level at 0.7988.
- A H4 Quasimodo resistance level at 0.8007.
- A H4 127.2% Fib ext. point at 0.80 taken from the low 0.7807.
- August’s opening level at 0.7998.
- A H4 Harmonic Gartley reversal point at the 78.6% Fib resistance line drawn from 0.8011.
Suggestions: With weekly price seen trading from a support area coming in at 0.7849-0.7752, and daily action showing room to rally up to the Quasimodo resistance level at 0.7988, a break above 0.7950 is likely.
While the above structures on the H4 timeframe (green sell zone) boast attractive confluence, one must take into account that a fakeout may be seen up to the daily Quasimodo resistance level at 0.8030 sited just above the green zone. Traditionally, when trading Gartley patterns, the stop-loss order should go beyond the X point (0.8065). If you were to follow this, a fakeout up to the daily Quasimodo resistance is not a concern. It is more for the aggressive traders who will likely look to position stops just beyond the green zone. Should you be one of those traders, you may want to consider waiting for the H4 candles to prove seller intent (in the form of either a full, or near-full-bodied candle), before pressing the sell button. This will help avoid a fakeout should it occur.
Data points to consider: No high-impacting events scheduled to be released today.
Levels to watch/live orders:
- Buys: Flat (stop loss: N/A).
- Sells: 0.8011/0.7988 (stop loss: either wait for a H4 bearish candle to form in the shape of a full, or near-full-bodied candle, and place stops above the candle’s wick. Another option is to enter at 0.80 and place stops above the H4 Harmonic X point at 0.8067).
USD/JPY:
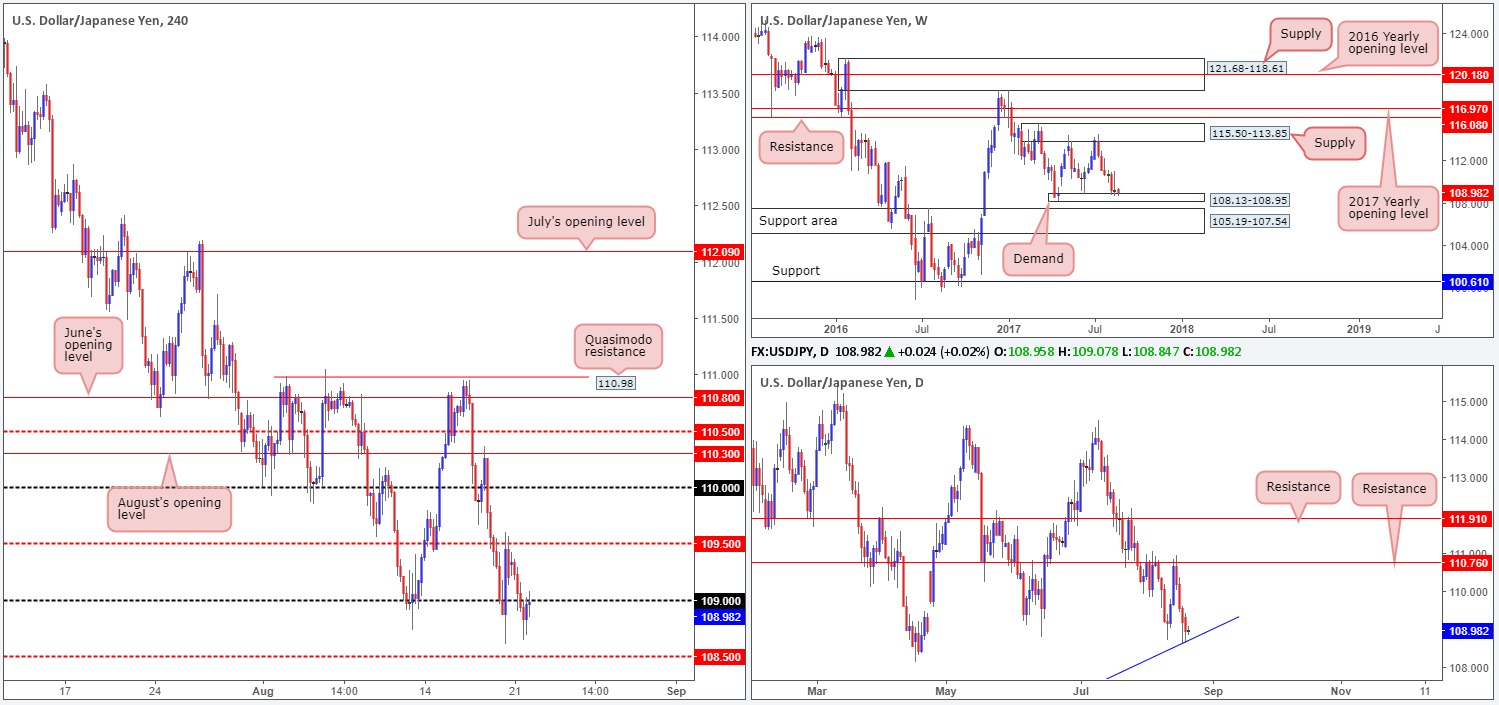
Despite the pair recording its fourth consecutive bearish close, weekly price remains hovering just above a demand base marked at 108.13-108.95. The same can be said for the daily trendline support etched from the low 100.08.
Having recently seen the H4 candles run through bids at the 109 handle, will a retest of this level (which is happening as we write) be enough to push the unit down to the mid-level support at 108.50? Technically speaking, we would not want to be a seller right now. Yes, the market has been declining in value since striking the daily resistance level at 110.76, but shorting into both weekly demand and a daily trendline support is not something we’d label a high-probability move. In that case, would a buy above the 109 neighborhood be something to consider? A close above 109, followed by a retest and a lower-timeframe buy signal (see the top of this report) would, in our humble opinion, be enough to suggest a long.
Suggestions: Essentially, we’re going to be watching for the H4 candles to close above 109 for a potential long opportunity. As far as targets go, the daily resistance at 110.76 is of interest, but it’d be great if we could trail this beauty as far north as the weekly supply coming in at 115.50-113.85.
Data points to consider: No high-impacting events scheduled to be released today.
Levels to watch/live orders:
- Buys: Watch for H4 price to engulf 109 and then look to trade any retest seen thereafter ([waiting for a lower-timeframe buy signal to form following the retest is advised] stop loss: dependent on where one confirms this number).
- Sells: Flat (stop loss: N/A).
USD/CAD:
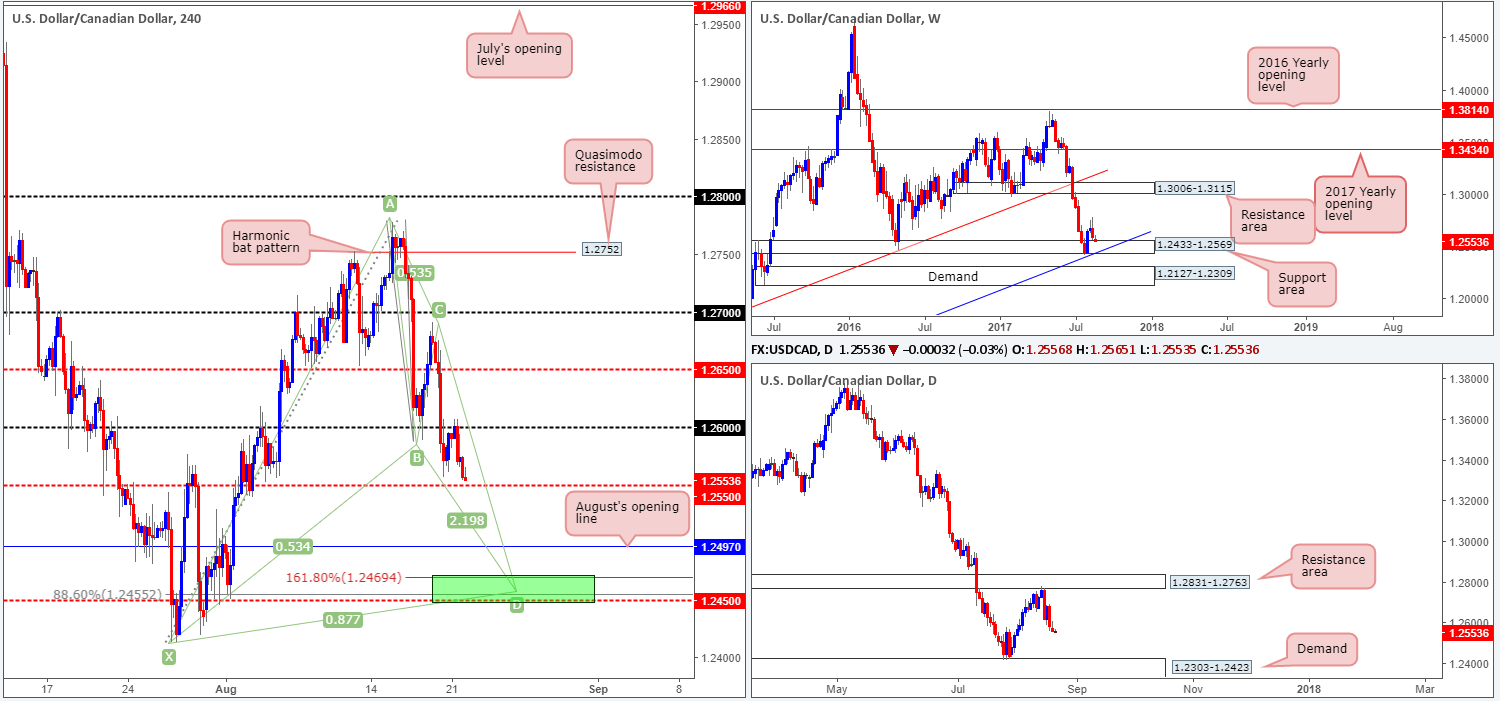
Following a retest of the 1.26 handle yesterday, the pair spent the London and US sessions declining lower, concluding trade just ahead of the H4 mid-level support at 1.2550. A violation of this level would place August’s opening level at 1.2497, followed closely by a H4 Harmonic bat completion point at 1.2455, in the firing range.
Despite the stronger-than-expected rebound seen from the weekly support area given at 1.2433-1.2569 three weeks ago, weekly action recently pulled back and is now retesting the top edge of this zone. Technically speaking, the selloff was likely due to the daily resistance area coming in at 1.2831-1.2763. Should the bears continue to dominate from this zone, the next area on the hit list is the demand penciled in at 1.2303-1.2423 (positioned just below the aforementioned weekly support area).
The H4 Harmonic bat pattern boasts a powerful XA retracement (88.6% Fib retracement at 1.2455) located just ahead of the H4 mid-level support 1.2450. It is also positioned within the noted weekly support area and its converging weekly trendline support taken from the low 0.9633.
Suggestions: In the event that the Harmonic pattern completes, we will be interested buyers here. Additional confirmation, in our opinion, is not required since we can comfortably place stops beyond the X point (1.2413) and still achieve adequate risk/reward.
Data points to consider: Canadian core retail sales figures at 1.30pm GMT+1.
Levels to watch/live orders:
- Buys: 1.2450 (stop loss: 1.2411).
- Sells: Flat (stop loss: N/A).
USD/CHF:
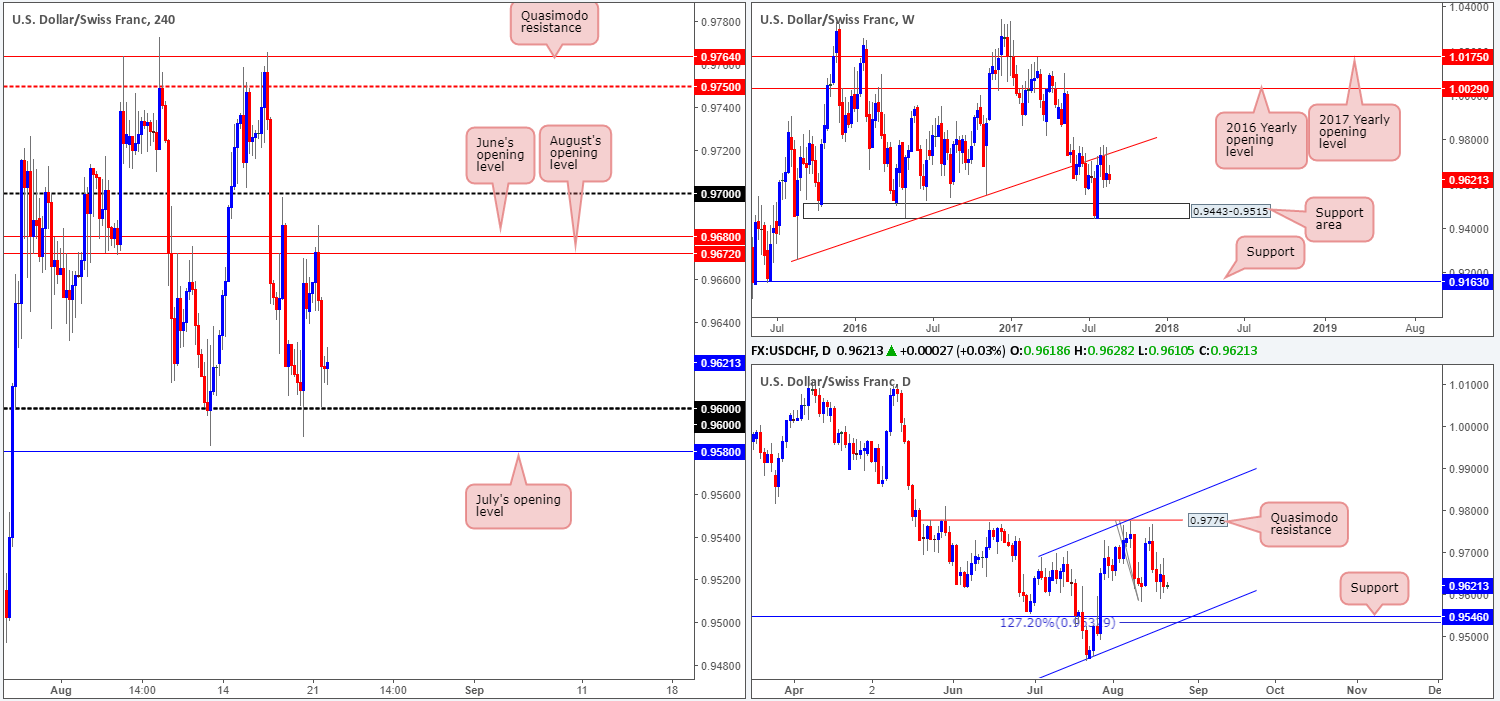
Kicking this morning’s report off with a look at the weekly timeframe, we can see that the trendline resistance extended from the low 0.9257 remains in play. The bearish selling wick recently printed from this line has, in our opinion, firmly placed the weekly support area at 0.9443-0.9515 back on the hit list. Also noteworthy is the daily timeframe. The chart shows room for the pair to trade as far down as support coming in at 0.9546, which happens to unite with a channel support etched from the low 0.9438 and a AB=CD 127.2% Fib ext. at 0.9532. A closer look at price action on the H4 timeframe shows June and August’s opening levels at 0.9680/0.9672 held price lower on Monday, consequently forcing price to challenge the 0.96 handle.
Suggestions: Despite both weekly and daily structure indicating further selling could be on the cards, the 0.96 handle and July’s opening level at 0.9580 are not levels we’d feel comfortable selling into. Usually, in cases such as this, we would simply wait for these levels to be consumed and then look to trade the retest. However, given the distance between 0.9580 and 0.9546 (the daily support) is only 34 pips, we’re unfortunately left with little room to maneuver for a short.
Data points to consider: No high-impacting events scheduled to be released today.
Levels to watch/live orders:
- Buys: Flat (stop loss: N/A).
- Sells: Flat (stop loss: N/A).
DOW 30:
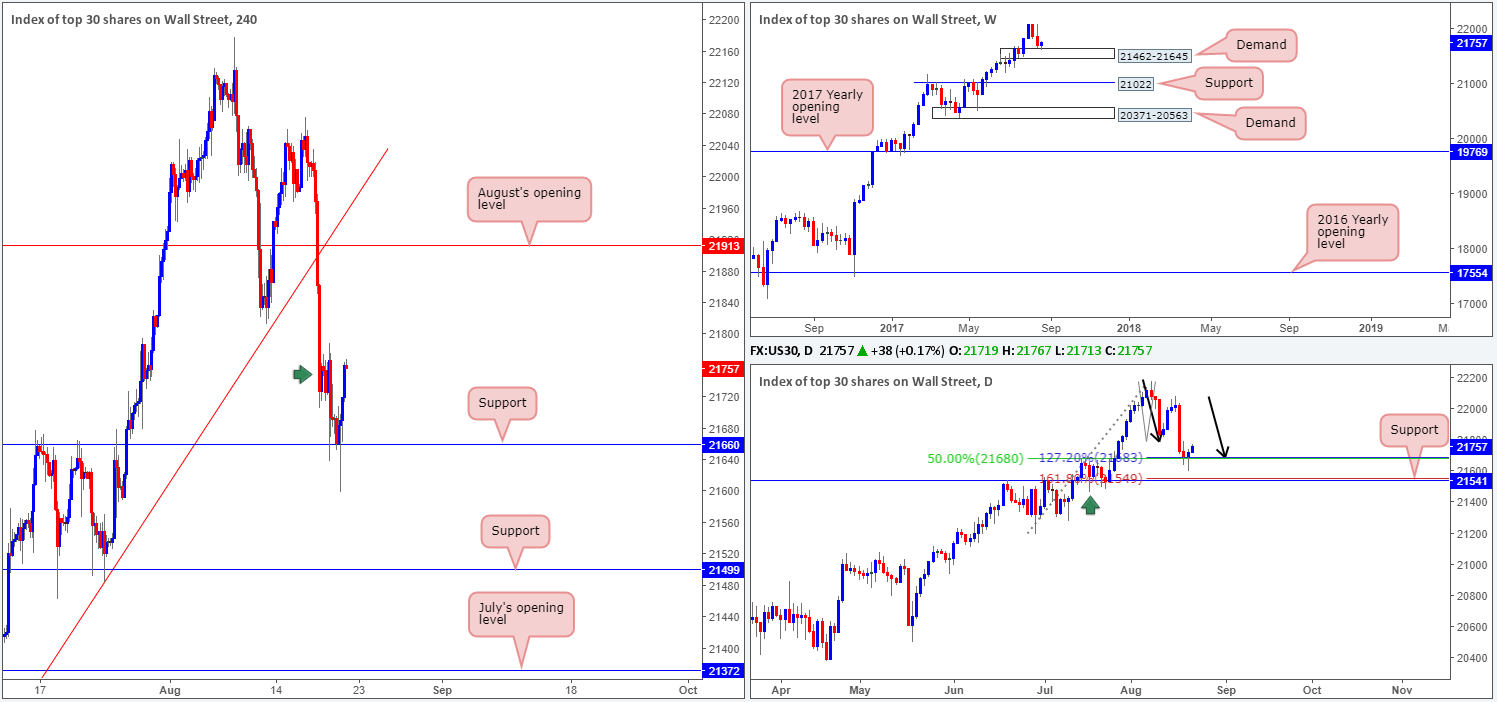
Fresh trading shows weekly price rebounding from a weekly demand base penciled in at 21462-21645. What gives this area extra credibility is the fact that it was formed within an incredibly strong uptrend. A little lower on the curve, we can see that a daily buying tail printed yesterday that pierced through a daily AB=CD (black arrows) 127.2% Fib ext. point at 21683, and a daily 50% support line at 21680 drawn from the low 21192. This, we believe, is going to attract buyers into the market today!
Zooming in for a closer look on the H4 timeframe, support at 21660 remained firm and rallied price higher yesterday. Should the candles manage to clear supply at 21788-21726 marked with a green arrow, the index will likely advance up to August’s opening level at 21913.
Our suggestions: We would only trade 21788-21726 should a H4 bull candle present itself in the shape of a full, or near-full-bodied candle following the retest. This is largely due to the possibility that the area may fail as support and force price action back down to the support it originally came from.
Data points to consider: No high-impacting events scheduled to be released today.
Levels to watch/live orders:
- Buys: Watch for H4 price to clear supply at 21788-21726 marked with a green arrow and then look to trade any retest seen thereafter ([waiting for a reasonably sized H4 bullish candle to form following the retest – in the shape of either a full, or near-full-bodied candle – is advised] stop loss: ideally beyond the candle’s tail).
- Sells: Flat (stop loss: N/A).
GOLD:
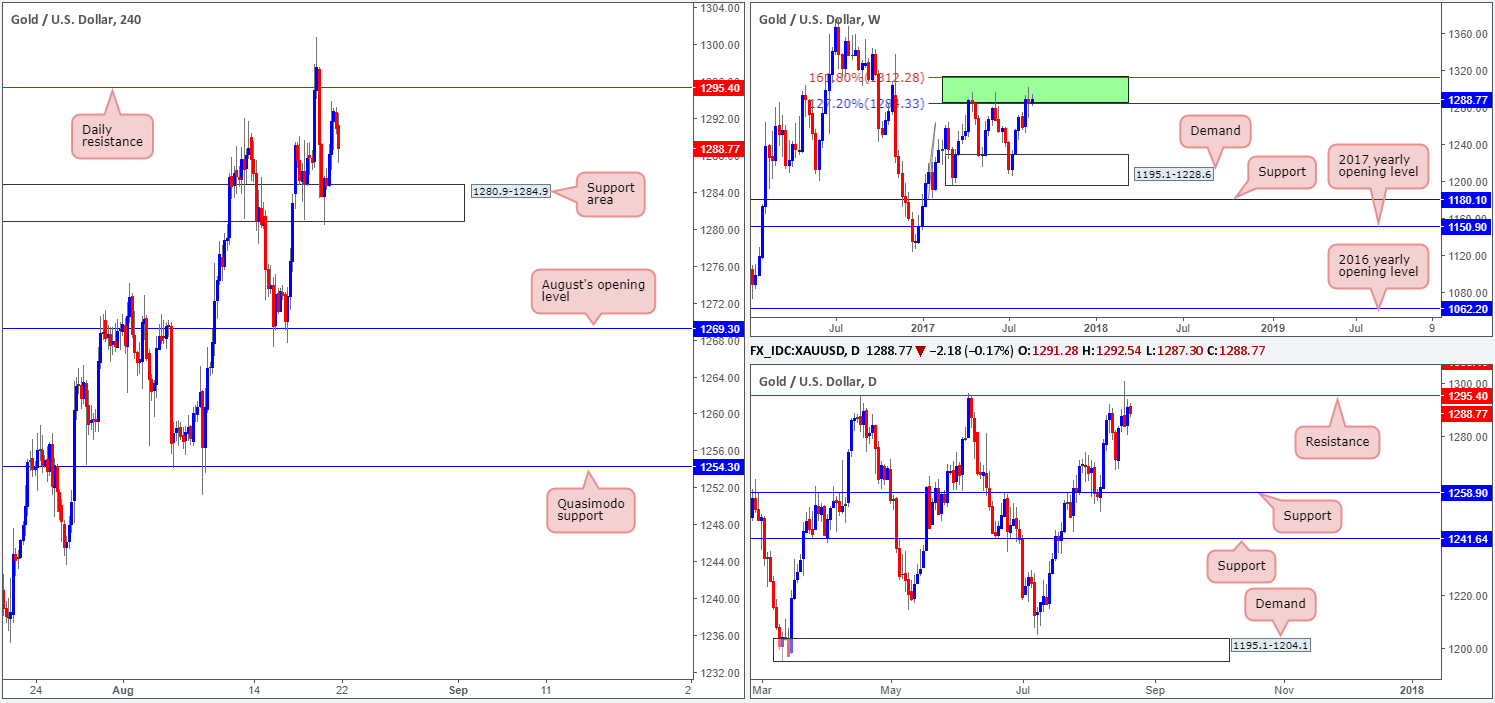
From the weekly timeframe, we can see that the bears are struggling to hold ground. Of course, it’s far too early to judge just yet since the green weekly resistance area (comprised of two weekly Fibonacci extensions 161.8/127.2% at 1312.2/1284.3 taken from the low 1188.1) has managed to successfully hold the metal lower on two separate occasions in the past.
The story on the daily chart, nevertheless, shows price trading from a resistance level at 1295.4. Apart from the two instances on 17/04/2017 and 06/06/2017, there’s little history registered with this number! For that reason, we may see price break above this line and head to the resistance carved from 1308.4 (not seen on the screen), which boasts very attractive history dating back to early 2011.
Bouncing across to the H4 chart, the support area at 1280.9-1284.9 held prices higher yesterday. Therefore, for those who are looking to short based on the weekly and daily structures in play right now, we would advise waiting for the current support area to be engulfed. This would not only confirm seller strength from the higher-timeframe structures, but also open the path south down to August’s opening level at 1269.3.
Our suggestions: Based on the above, our desk will not be looking for (medium/long-term) shorts until the daily resistance line plotted at 1308.4 is in play. This is due to the history surrounding this number and its position within the current weekly resistance area (allowing us to place stops tightly above this zone). Regarding intraday opportunities, a close below the current H4 support area is needed before we’d consider becoming sellers in this market.
Levels to watch/live orders:
- Buys: Flat (stop loss: N/A).
- Sells: Flat (stop loss: N/A).


