
A note on lower-timeframe confirming price action…
Waiting for lower timeframe confirmation is our main tool to confirm strength within higher timeframe zones, and has really been the key to our trading success. It takes a little time to understand the subtle nuances, however, as each trade is never the same, but once you master the rhythm so to speak, you will be saved from countless unnecessary losing trades. The following is a list of what we look for:
- A break/retest of supply or demand dependent on which way you’re trading.
- A trendline break/retest.
- Buying/selling tails/wicks – essentially we look for a cluster of very obvious spikes off of lower timeframe support and resistance levels within the higher timeframe zone.
- Candlestick patterns. We tend to stick with pin bars and engulfing bars as these have proven to be the most effective.
We typically search for lower-timeframe confirmation between the M15 and H1 timeframes, since most of our higher-timeframe areas begin with the H4. Stops are usually placed 3-5 pips beyond confirming structures.
EUR/USD:
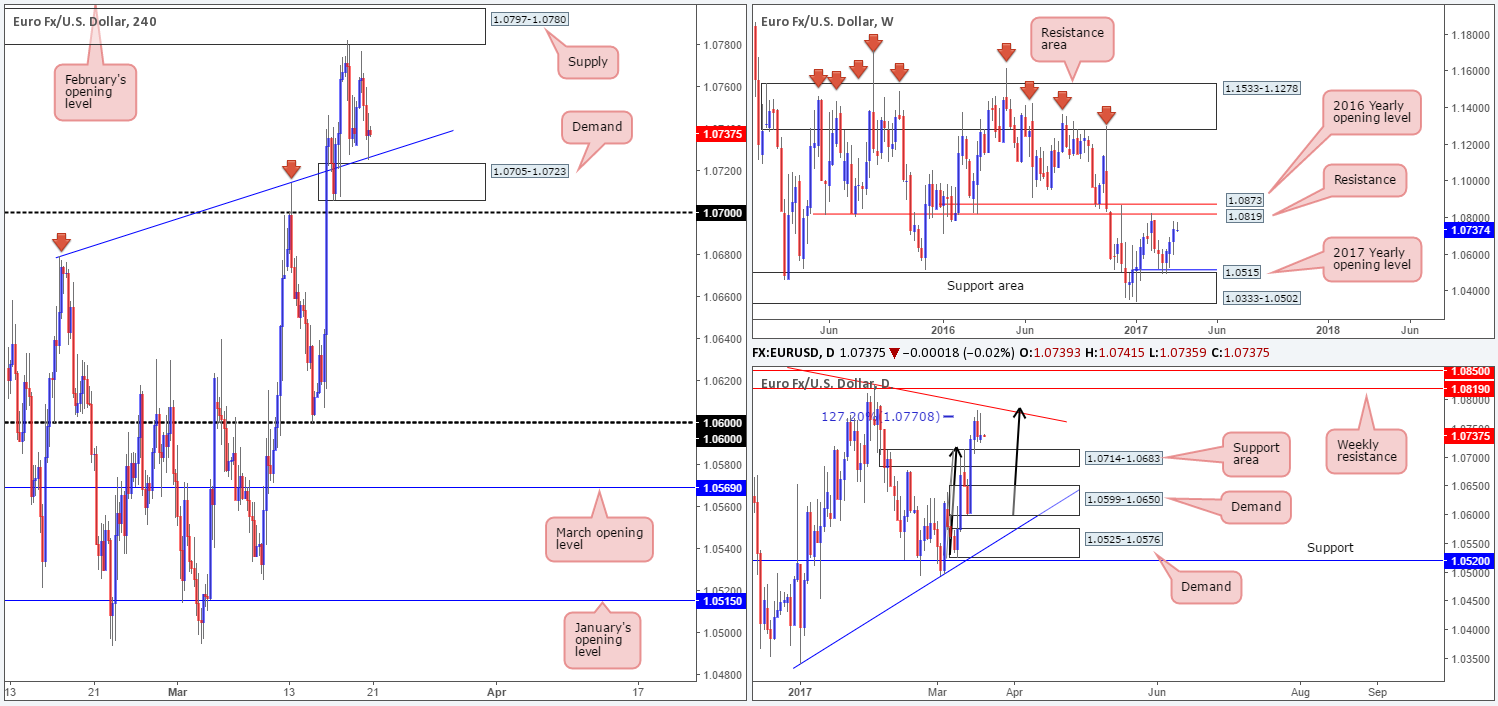
Shortly after the open, EUR bulls rose up and took charge, lifting the major to a high of 1.0777 going into the London open. This is where things began to turn sour for the bulls. The pair fell from here, broke Friday’s low at 1.0727 and clipped the H4 trendline support extended from the high 1.0679. Although a buy from this angle is tempting, given that the approach to this line was in the form of a symmetrical H4 AB=CD bullish pattern, we’d still prefer to see price connect with the H4 demand sitting just below it at 1.0705-1.0723 before considering a position here.
Over on the weekly chart, the candles are seen hovering just ahead of a weekly resistance level pegged at 1.0819, shadowed closely by the 2016 yearly opening base line drawn from 1.0873. Looking down to the daily chart, nevertheless, we can see that the unit came into contact with a daily bearish AB=CD (black arrows) 127.2% Fib ext. at 1.0770 on Friday. As you can probably see though, there’s not much room left for the bears to stretch their legs from here owing to the daily support area positioned just below at 1.0714-1.0683.
Our suggestions: In view of the current H4 demand area being seen around the top edge of the aforementioned daily support area, and room seen to advance north on the weekly chart, there’s still a healthy chance of a bounce being seen from the H4 base.
However, as we mentioned in Monday’s report, it is obviously down to the individual trader as to whether or not this zone requires additional price confirmation. For us personally, we believe it’s best to wait for a reasonably sized H4 bullish rotation candle to take shape before a long trade is executed for the simple reason that we do not favor being stopped out on a fakeout down to the nearby 1.07 handle.
Data points to consider: FOMC member Dudley speaks at 10am GMT.
Levels to watch/live orders:
- Buys: 1.0705-1.0723 ([waiting for a reasonably sized H4 bull candle to form is advised before pulling the trigger] stop loss: ideally beyond the confirming candle).
- Sells: Flat (stop loss: N/A).
GBP/USD:
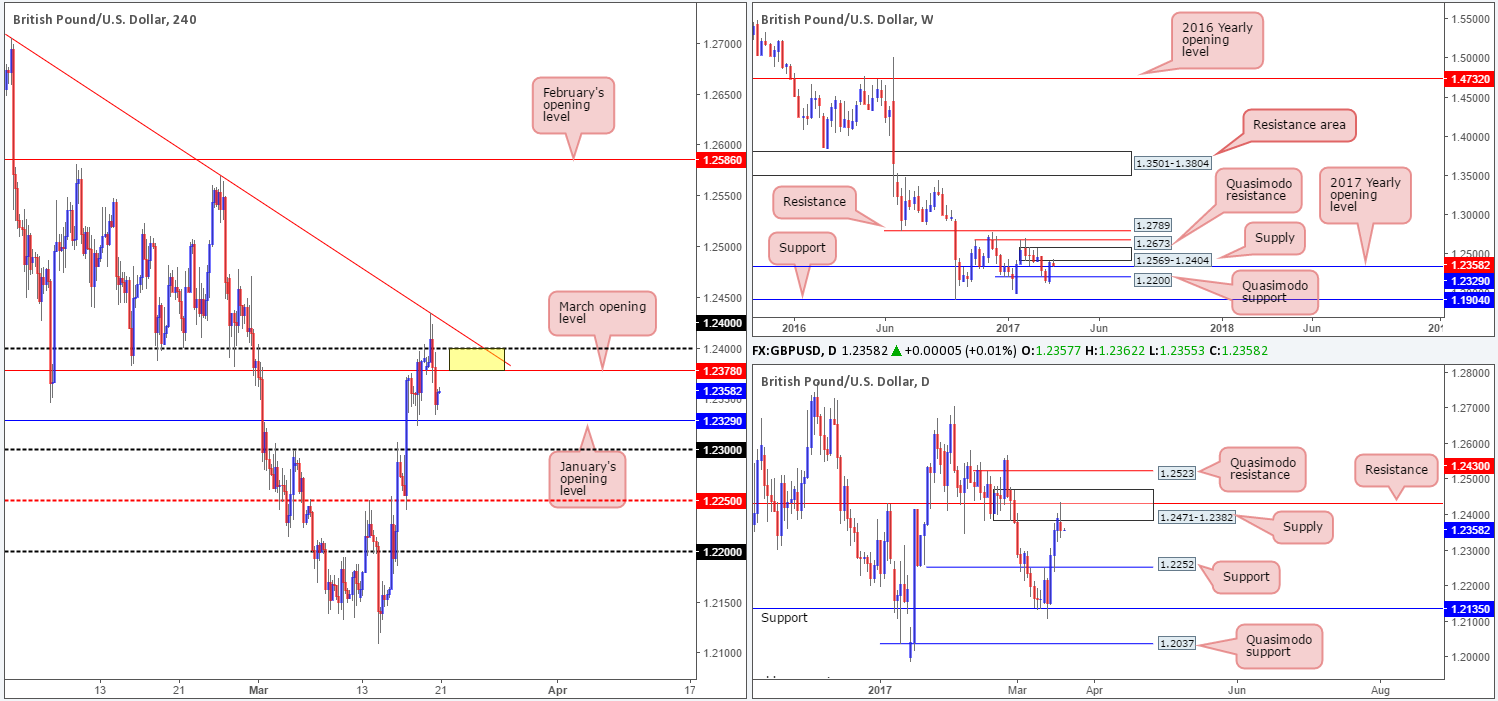
In recent sessions, H4 price briefly whipsawed through the 1.24 handle and tagged in offers around a nearby H4 trendline resistance stretched from a high of 1.2706. From here, cable dove lower and ended the day on its back foot; closing just ahead of January’s opening base line drawn from 1.2329. Yesterday’s bearish assault likely has something to do with the fact that both the weekly and daily charts show this market to be trading from supply (weekly supply: 1.2569-1.2404/daily supply: 1.2471-1.2382).
Should the H4 candles retest the 1.24/1.2378 neighborhood today (psychological handle/March opening level – yellow zone) before testing January’s open level, our desk has noted that they would be interested in shorting from here.
Our suggestions: Assuming that the above comes to fruition, and we see rejection printed from the H4 sell zone, a short trade will be initiated, targeting 1.2329 followed closely by the 1.23 handle.
Data points to consider: UK inflation data at 9.30am. FOMC member Dudley speaks at 10am GMT.
Levels to watch/live orders:
- Buys: Flat (stop loss: N/A).
- Sells: 1.24/1.2378 (stop loss: ideally placed beyond the rejection wick).
AUD/USD:
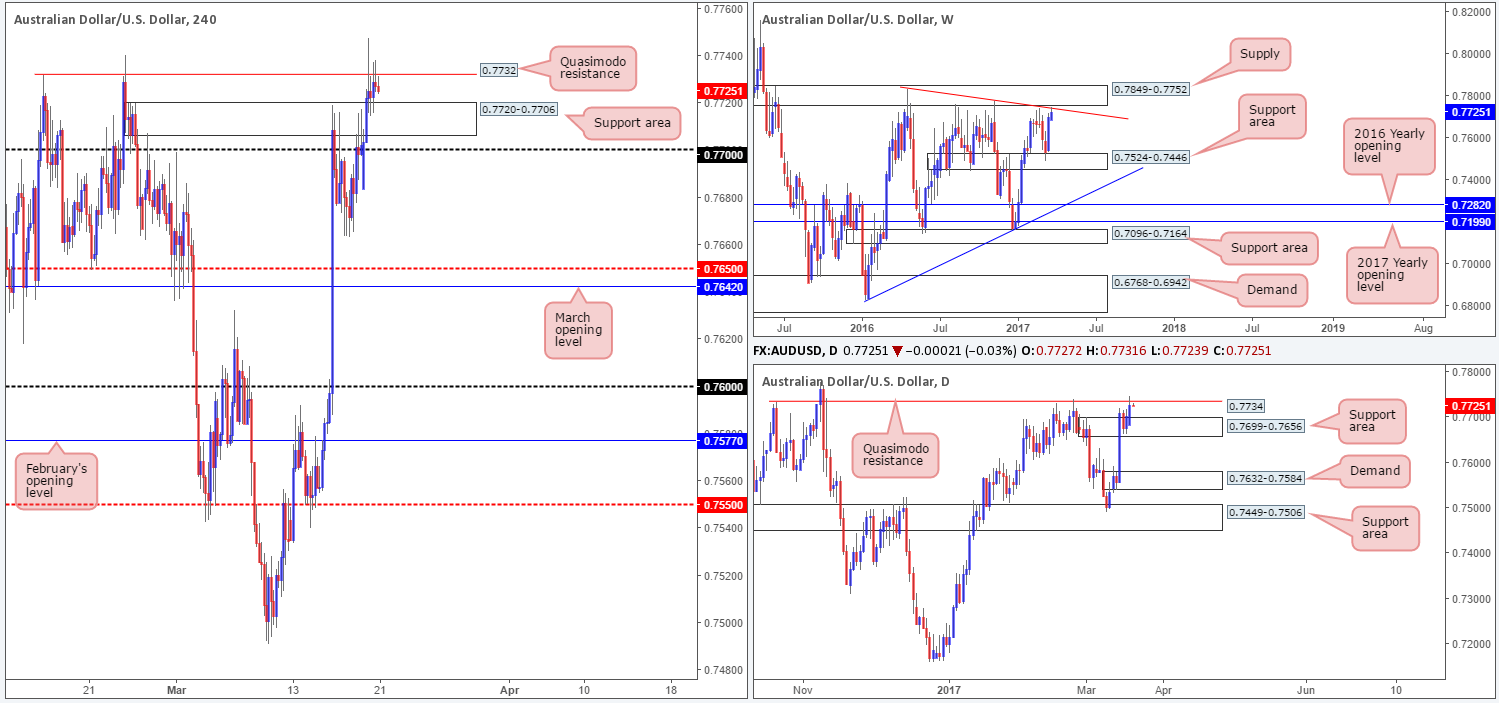
Trade update: stopped out at 0.7742 on the short taken from 0.7732).
Beginning with a look at the weekly chart this morning, weekly action is currently seen testing a weekly trendline resistance taken from the high 0.7835, which is positioned nearby the underside of a weekly supply penciled in at 0.7849-0.7752. Turning our attention to the daily chart, the Aussie gravitated north from the daily support area at 0.7699-0.7656 yesterday and shook hands with a daily Quasimodo resistance level drawn in at 0.7734.
Jumping across to the H4 chart, we can see that upside is presently capped by a H4 Quasimodo resistance level pegged at 0.7732. However, with the close-at-hand H4 support area lurking at 0.7720-0.7706 (seen positioned directly above the current daily support area), the bears equally have little room to stretch their legs!
Our suggestions: While weekly, daily and H4 charts do indicate that bearish structure is in play, we cannot justify a short at this time. It would just be too risky given that there is not only a H4 support area sitting nearby, but just beneath this there’s also a daily support area (see above). Therefore, opting to stand on the sidelines here may very well be the better path to take today.
Data points to consider: Australian monetary policy meeting minutes at 12.30am. FOMC member Dudley speaks at 10am GMT.
Levels to watch/live orders:
- Buys: Flat (stop loss: N/A).
- Sells: Flat (stop loss: N/A).
USD/JPY:
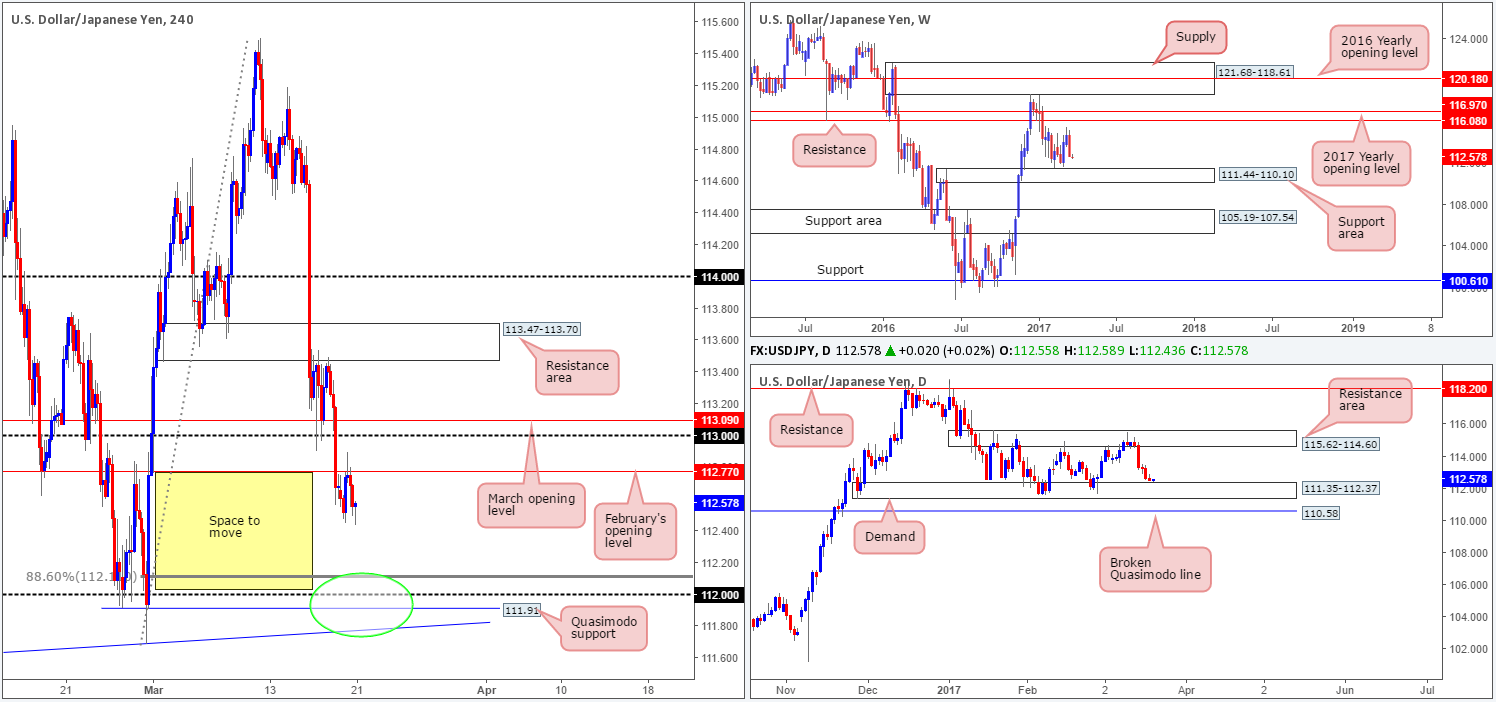
February’s opening level at 112.77 managed to elbow its way into the spotlight as a resistance during the early hours of yesterday’s London morning segment. Our reason for not choosing to take part in selling from this line was simply due to the daily demand zone lurking within touching distance at 111.35-112.37.
As can be seen from the daily chart this morning, daily price is in fact now trading close by the top edge of the above said daily demand. Be that as it may, we do not plan on buying from here. Instead we have our eye on the 112 handle (green circle). There are a number of technical aspects that support a buy from this angle:
- The H4 88.6 retracement value seen at 112.11.
- The H4 Quasimodo support at 111.91.
- A H4 trendline support taken from the low 111.59.
- All of the above is positioned within the current daily demand, which happens to be located around the top edge of a weekly support area at 111.44-110.10.
Our suggestions: Given the above points, a long from 112 is far more appealing to us. Nevertheless, seeing as how the H4 buy zone (111.75/112.11) is rather large, a reasonably sized H4 bullish candle is required to be seen before we pull the trigger. This will not only show buyer intent but it will also help in avoiding any aggressive fakeout seen through our pre-determined zone.
Data points to consider: FOMC member Dudley speaks at 10am GMT.
Levels to watch/live orders:
- Buys: 111.75/112.11 ([waiting for a reasonably sized H4 bull candle to form is advised before pulling the trigger] stop loss: ideally beyond the confirming candle).
- Sells: Flat (stop loss: N/A).
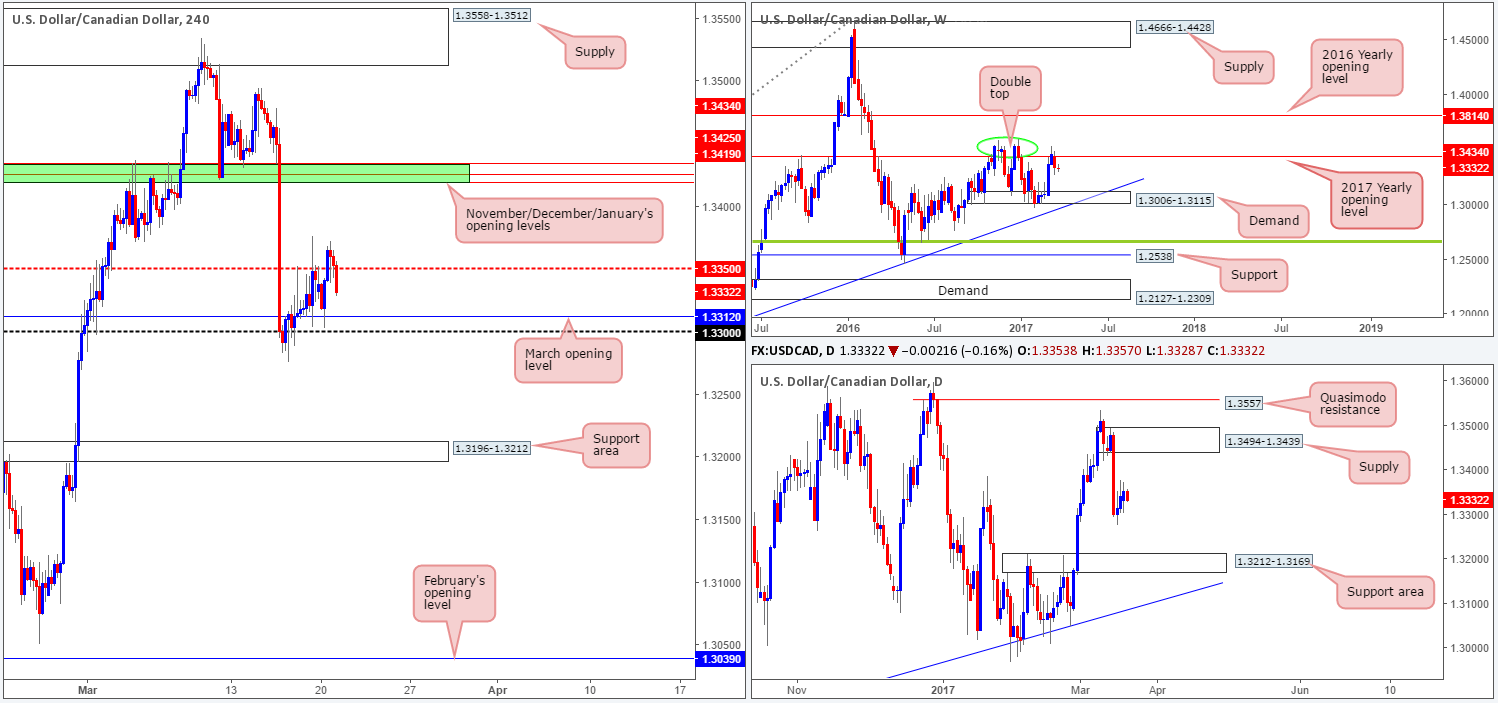
USD/CAD:
Working our way from the top this morning, we can see that weekly action sold off. Price whipsawed through the 2017 yearly opening level at 1.3434 and came so very close to tapping the weekly double-top formation seen around the 1.3588 region (green circle). The next downside area to have an eyeball from here is the weekly demand pegged at 1.3006-1.3115. The story on the daily chart, however, shows that price is loitering mid-range between a daily supply seen at 1.3494-1.3439 and a daily support area at 1.3212-1.3169.
Looking over to the H4 candles, price looks to be on course to cross swords with March’s opening level at 1.3312, following a rather deep fakeout above the H4 mid-way resistance level at 1.3350. Would we consider a buy from 1.3312? Although this number is bolstered by a nearby psychological handle at 1.33, we would still probably not buy from here. Our reason for why simply comes down to there being no higher-timeframe convergence.
Our suggestions: With the above points in mind, we feel that even though a bounce MAY be seen from the 1.33 region today, it’s just not worth the risk, in our opinion. As a result, we will be placing this pair on the back burner today and revisiting it going into tomorrow’s open.
Data points to consider: FOMC member Dudley speaks at 10am. Canadian core retail sales at 12.30pm GMT.
Levels to watch/live orders:
- Buys: Flat (stop loss: N/A).
- Sells: Flat (stop loss: N/A).
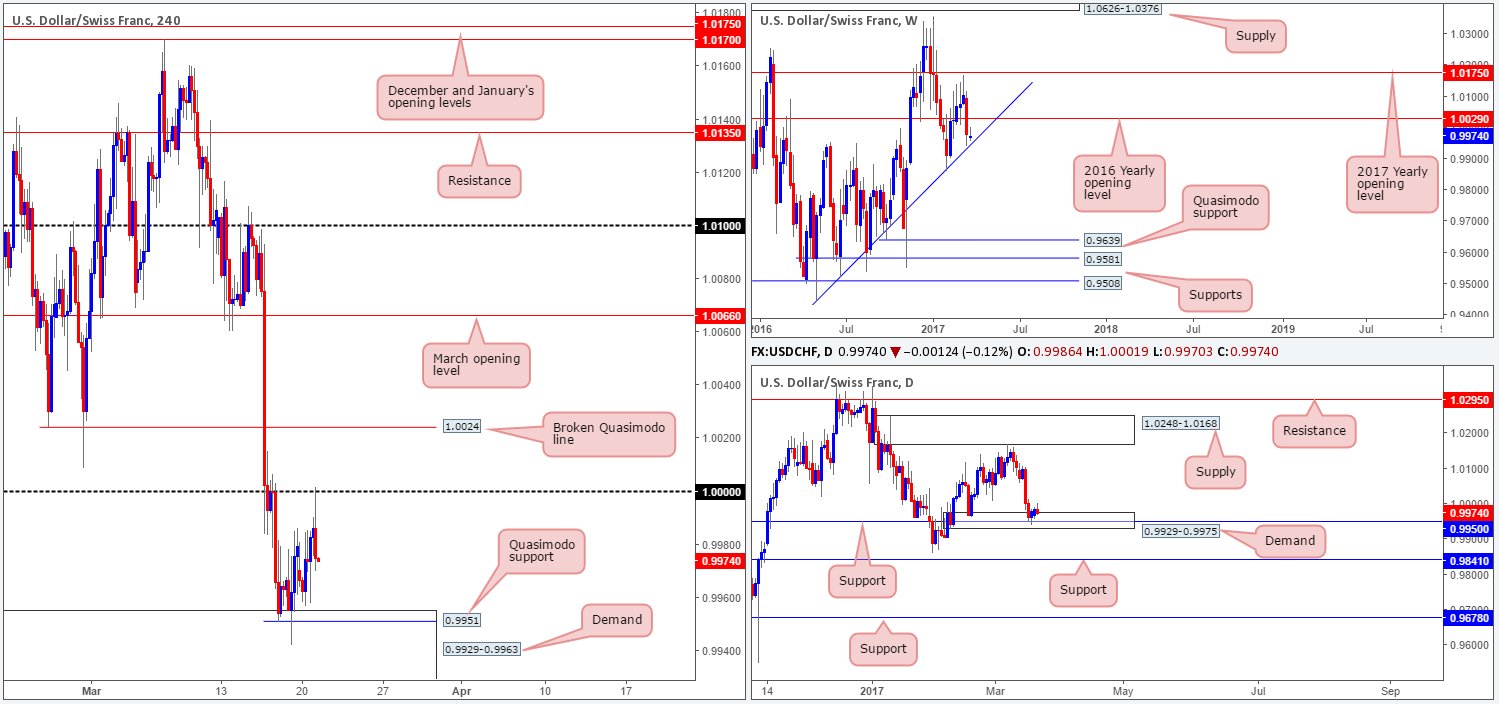
USD/CHF:
Recent action shows that the Swissy extended Friday’s bounce from the H4 demand at 0.9929-0.9963 up to parity (1.0000), which, as you can see, is currently proving to be a stable line of resistance. Given the velocity of the rebound from 1.0000, could further selling be seen? While it’s possible the market may continue to pump lower, we would advise caution here! Not only is there a daily demand base currently in play right now at 0.9929-0.9975 (houses the current H4 demand), there’s also a weekly trendline support intersecting with this zone! Therefore, the bears certainly have their work cut out for them if they intend on pushing this market lower.
Our suggestions: Owing to the above, our team has absolutely no interest in selling today. Instead, we’re actually looking at buying from the H4 Quasimodo support at 0.9951 that’s lodged within the aforementioned H4 demand. Usually, we’d look to place stops below the apex of the Quasimodo formation, but given where it’s positioned, we feel stops would be best placed beyond the H4 demand base at 0.9927.
Data points to consider: FOMC member Dudley speaks at 10am GMT.
Levels to watch/live orders:
- Buys: 0.9951 (stop loss: 0.9927).
- Sells: Flat (stop loss: N/A).
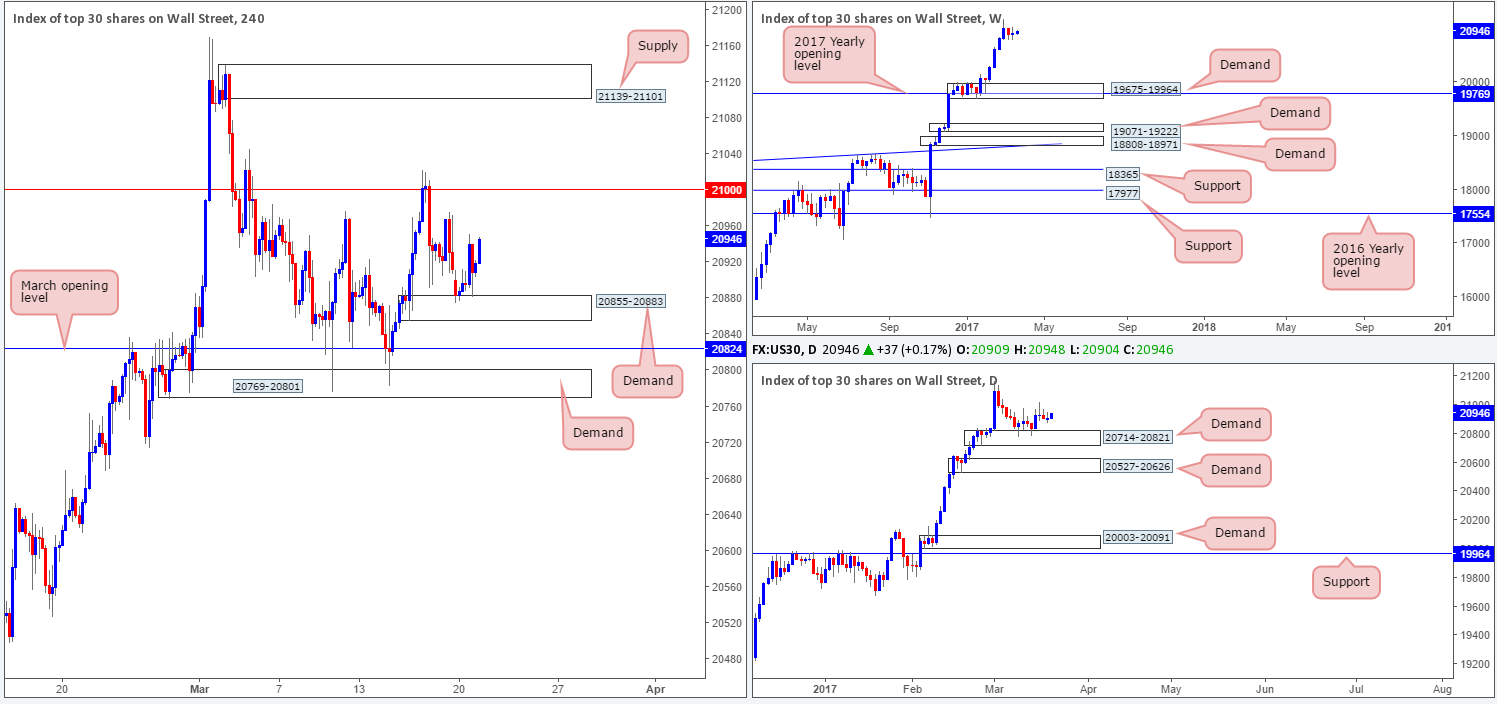
DOW 30:
US equities bounced nicely from the H4 demand base fixed at 20855-20883 during the course of yesterday’s sessions. Assuming that the bulls remain in control here, the next area of interest can be seen at the 21000 mark: a level that capped upside beautifully on Thursday. With the daily demand zone at 20714-20821 currently holding ground, and the weekly chart showing absolutely no weekly resistance ahead, we feel further buying is likely going to transpire today/this week.
Our suggestions: However, before our team can become buyers, we will need to see the H4 candles engulf the 21000 mark. In the event that this comes to fruition, and the H4 candles retest 21000 as support, we will look to buy the rejection candle off this number and target the H4 supply seen overhead at 21139-21101.
Data points to consider: FOMC member Dudley speaks at 10am GMT.
Levels to watch/live orders:
- Buys: Watch for price to engulf 21000 and then look to trade any retest seen thereafter (stop loss: dependent on the rejection candle, but ideally beyond the rejection candle’s tail).
- Sells: Flat (stop loss: N/A).
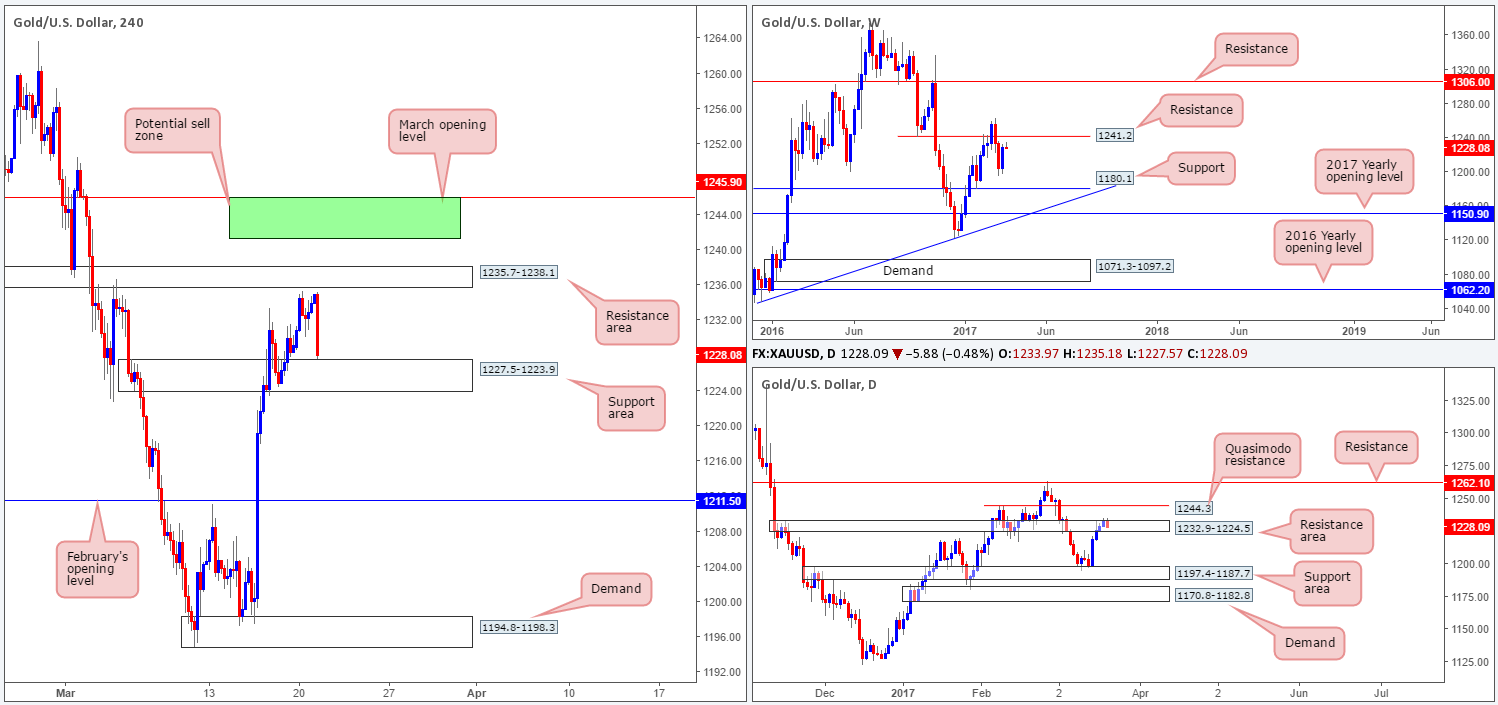
GOLD:
As can be seen from the H4 chart this morning, bullion is heavily selling off and has brought the unit to within touching distance of the H4 support area drawn from 1227.5-1223.9. While it is true that price bounced beautifully from this H4 zone on Thursday last week, it might be worth noting that the daily candles are currently housed within a daily resistance area at 1232.9-1224.5. Therefore, although history could repeat itself here, we would not feel comfortable buying from this barrier today.
Our suggestions: Should price engulf the current H4 support zone on the other hand, then we feel taking a short on any retest to the underside of this zone is attractive (assuming a reasonably sized H4 bear candle is seen following the retest), since the next area of support does not come into view until we connect with February’s opening base line at 1211.5.
Levels to watch/live orders:
- Buys: Flat (stop loss: N/A).
- Sells: Watch for price to engulf the H4 support area at 1227.5-1223.9 and then look to trade any retest seen thereafter (stop loss: dependent on the rejection candle, but ideally beyond the rejection candle’s wick).


