
Key risk events today:
RBA Monetary Policy Meeting Minutes; RBA Gov Lowe Speaks; Canada core Retail Sales m/m and Retail Sales m/m.
(Previous analysis as well as outside sources – italics).
EUR/USD:
The US dollar index, or more commonly referred to as the DXY, established some ground south of the 96.00 handle Monday.
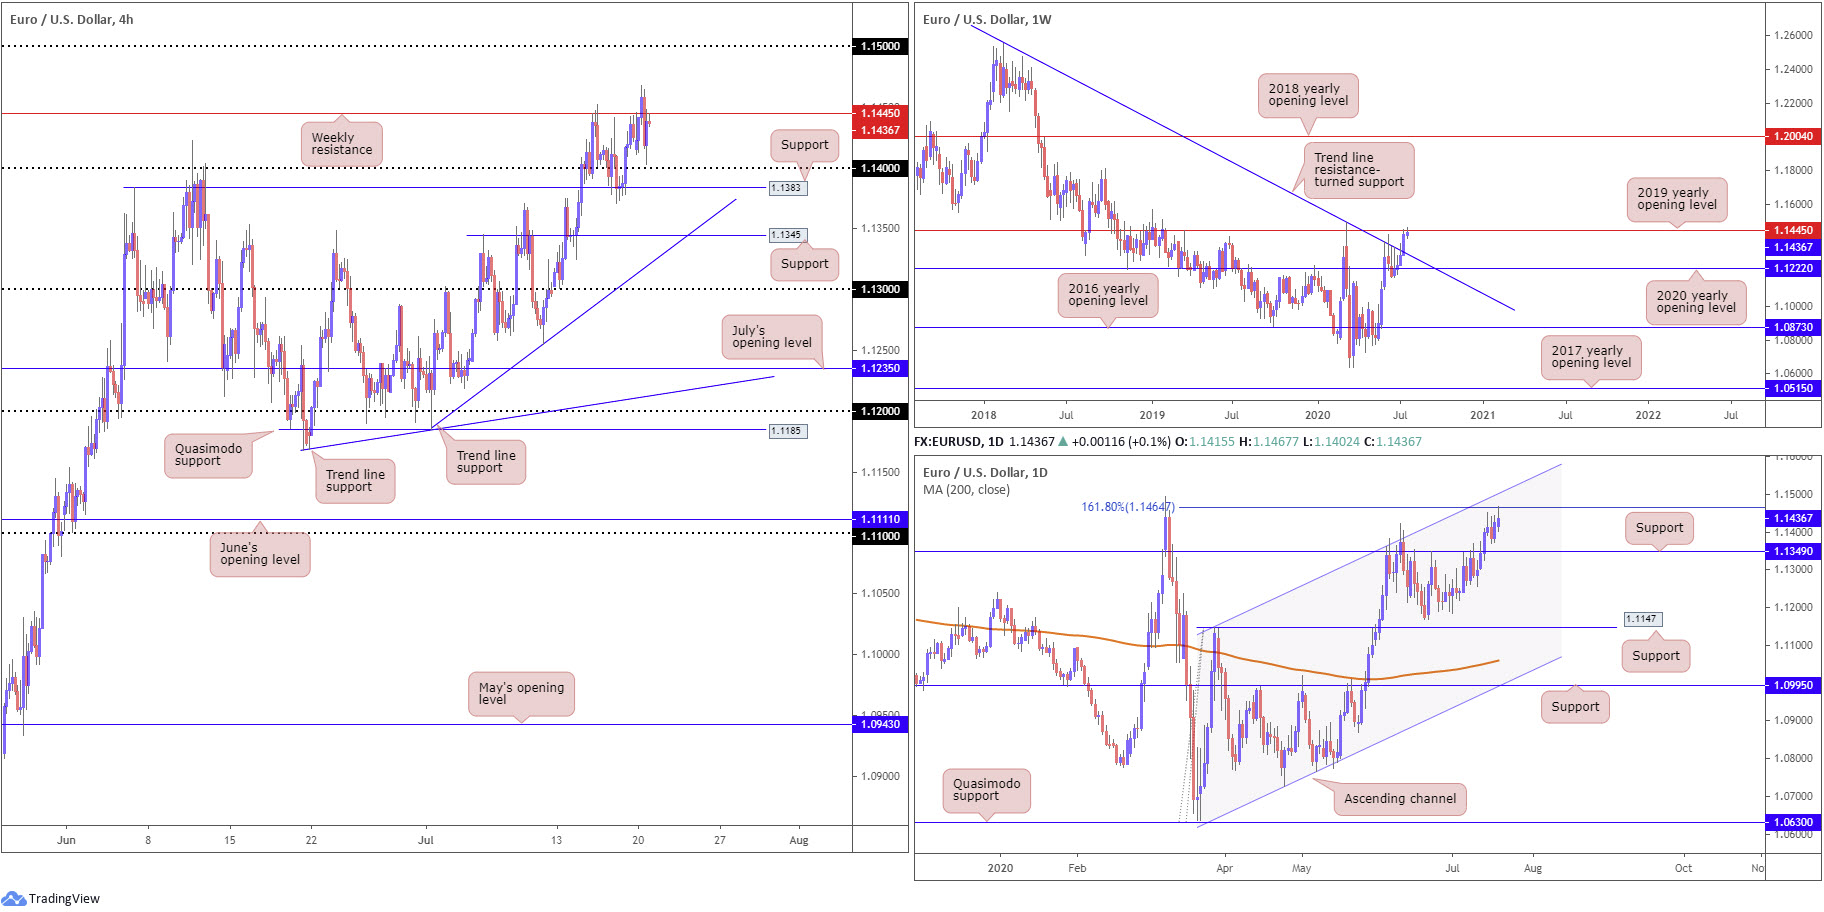
From the weekly timeframe, EUR/USD recently marched through long-term trend line resistance, extended from the high 1.2555, and shook hands with the 2019 yearly opening level at 1.1445. The latter is currently displaying potential as resistance. With respect to the overall trend, the pair remains southbound until breaking the 1.1495 March 9 high.
Price movement on the daily timeframe reveals the unit brought in a 161.8% Fibonacci extension point at 1.1464 in recent trading, positioned nearby channel resistance, extended from the high 1.1147. A decisive rejection from 1.1464 could have crosshairs filter back to 1.1349 support.
A closer reading of price action on the H4 timeframe reveals a two-candle whipsaw formed through weekly resistance (2019 yearly opening level) at 1.1445, drawing action back towards waters north of 1.14, a level sited ahead of support at 1.1383.
Areas of consideration:
Having active weekly and daily resistances in play may deter bullish themes.
Traders, therefore, are likely to monitor 1.1464/1.1445 for possible bearish scenarios today, targeting the 1.14 point (and H4 support at 1.1383) as an initial take-profit zone. Alternatively, a H4 close under 1.1383 support could stir breakout sellers, taking aim at H4 support coming in from 1.1345, which happens to converge with trend line support, extended from the low 1.1233.
GBP/USD:
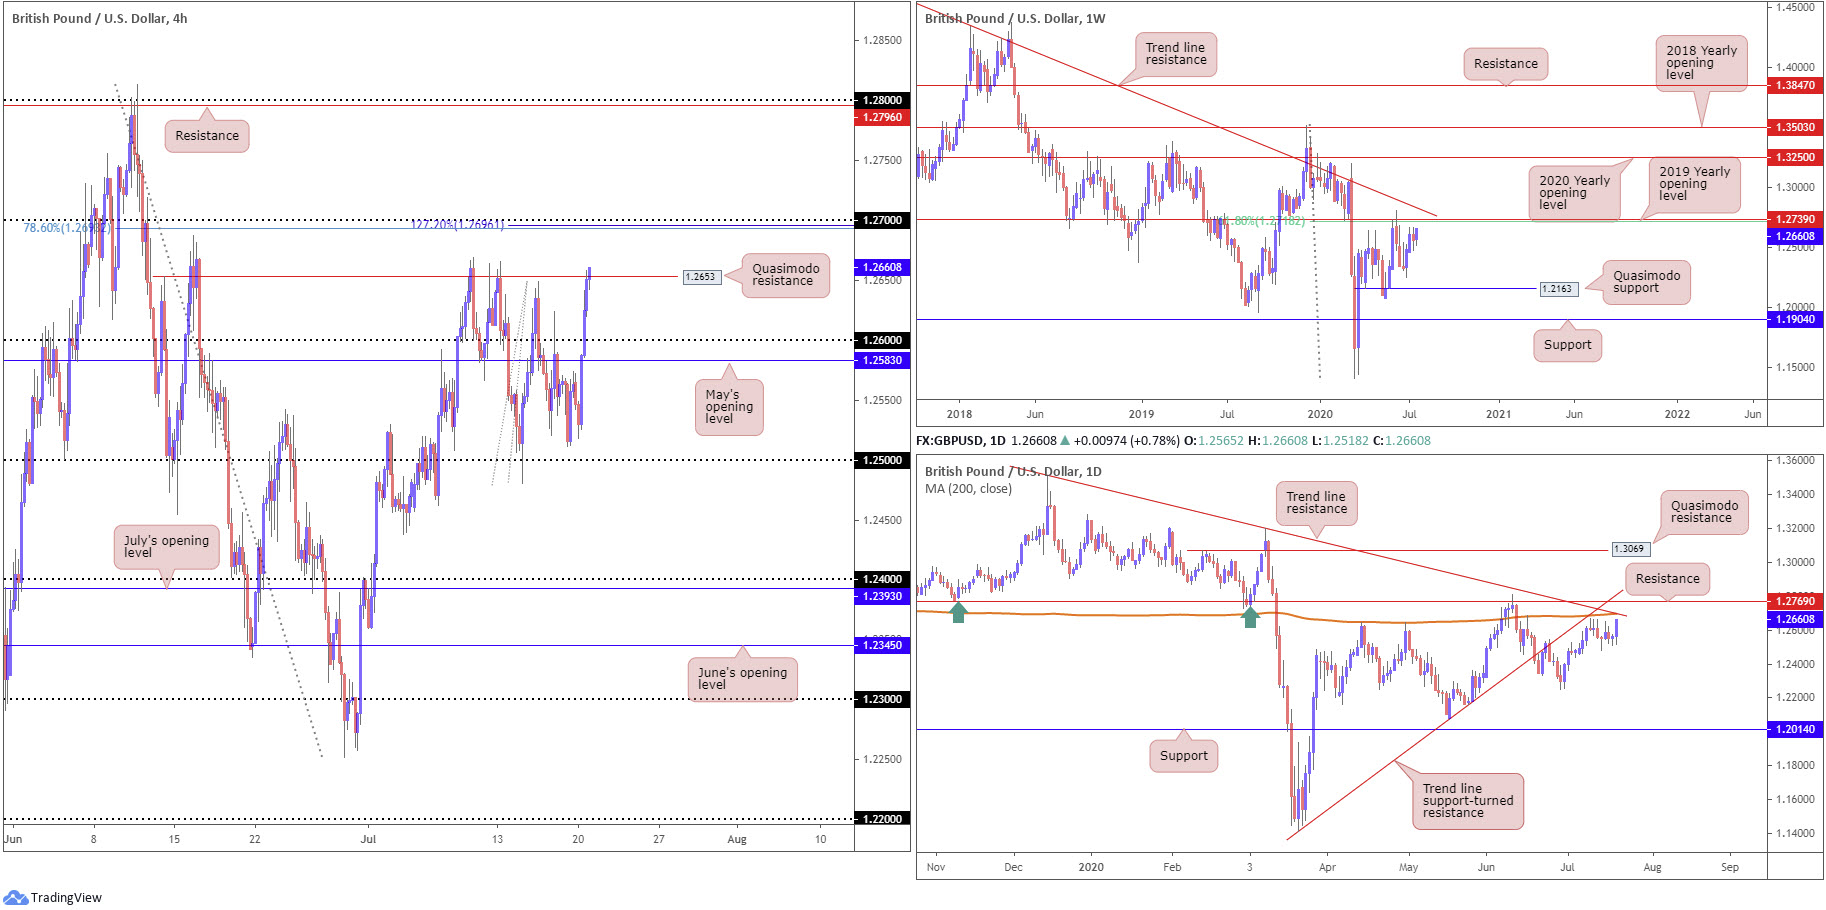
Sterling outperformed against the buck Monday, consequently penetrating a handful of key intraday technical resistances. Leaving 1.25 unchallenged, H4 candles clawed through May’s opening level at 1.2583, the round number 1.26 and recently crossed paths with Quasimodo resistance at 1.2653. Should buyers strengthen their grip at this point, traders will likely be watching 1.27 as the next point of resistance, closely shadowed by the 78.6% Fibonacci retracement ratio at 1.2693 and 127.2% Fibonacci extension point at 1.2696.
Further out, weekly price is tilting towards substantial resistance, made up of a 61.8% Fibonacci retracement ratio at 1.2718 and the 2019 yearly opening level at 1.2739. Movement on the daily timeframe, thanks to Monday’s rally, also trades within striking distance of firm resistance, comprised of trend line resistance, extended from the high 1.3514, the 200-day SMA (orange – 1.2697), resistance at 1.2769 and trend line support-turned resistance, taken from the low 1.1409. This resistance combination also boasts a connection to the aforementioned weekly resistances.
Areas of consideration:
H4 Quasimodo resistance at 1.2653 appears to be on unstable footing, despite capping upside on a number of occasions. This may lead to 1.27 making an appearance today. The latter remains an interesting point. Not only does the psychological base represent a notable take-profit target for any longs, the level emphasises robust resistance, joined closely by H4 Fibonacci studies and a collection of daily and weekly resistances (highlighted above).
AUD/USD:
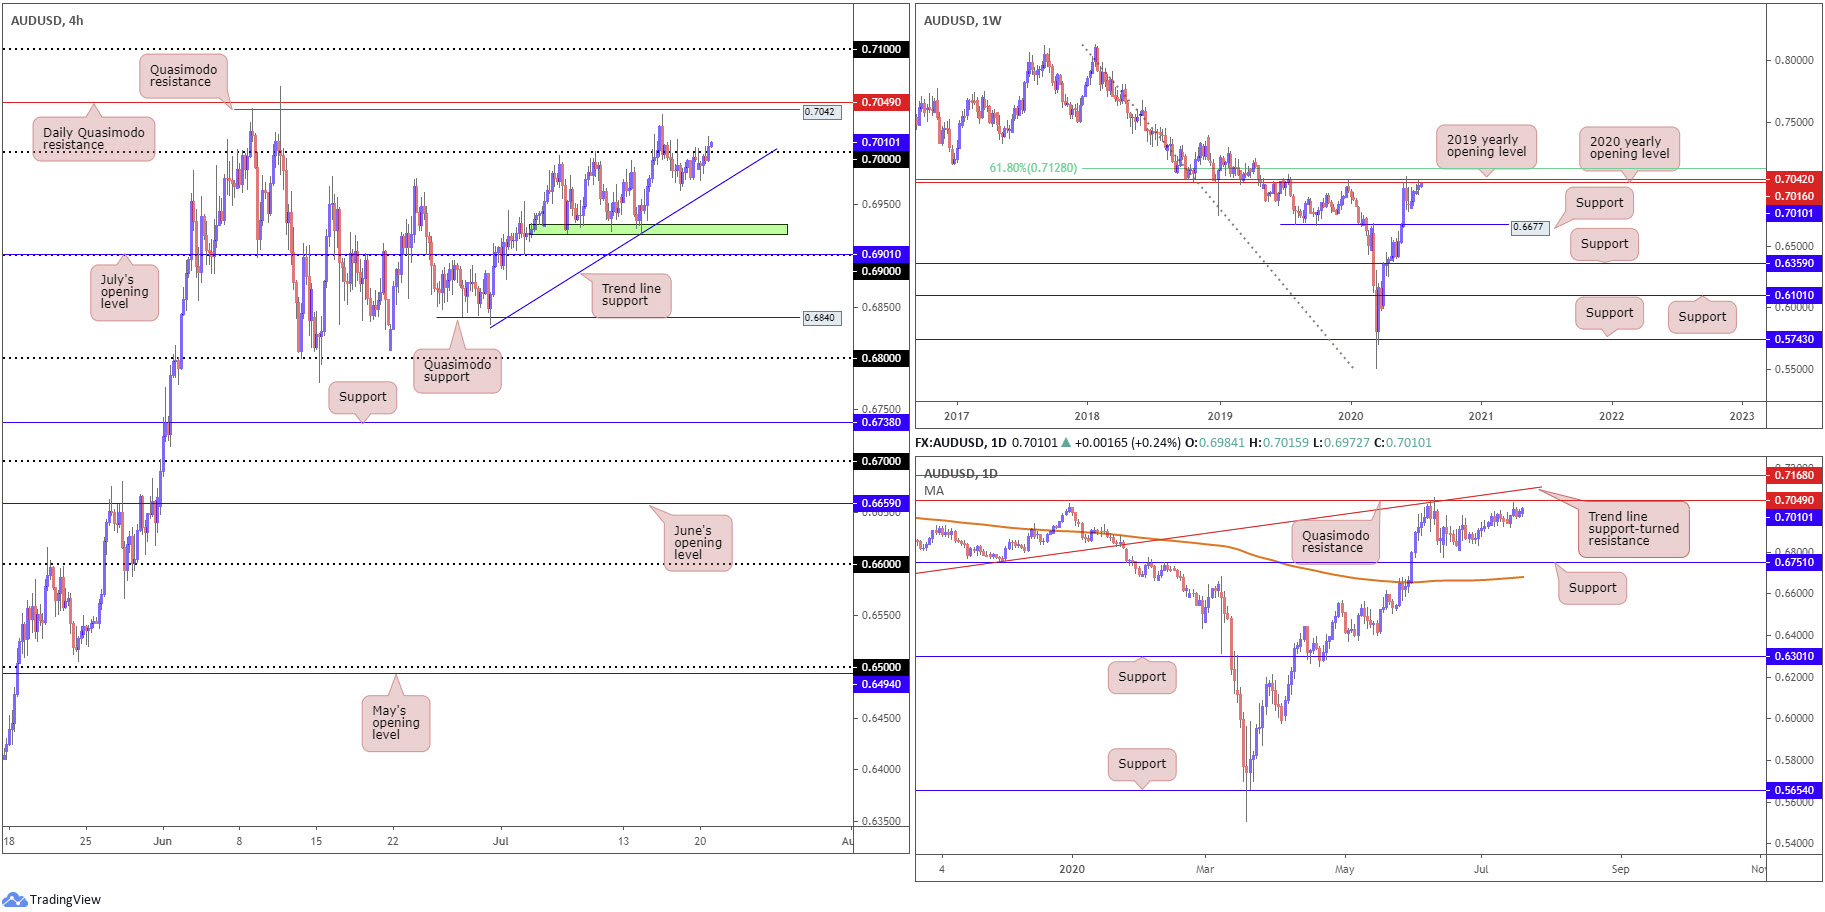
Leaving behind H4 trend line support, taken from the low 0.6832, the Australian dollar edged modestly higher against its US counterpart Monday. This, as you can see, drew H4 back above the key figure 0.70, relocating the spotlight on Quasimodo resistance at 0.7042, a level fastened just south of daily Quasimodo resistance at 0.7049. In addition to Quasimodo resistance on the daily timeframe, daily trend line support-turned resistance, taken from the low 0.6670, is positioned close by. Another daily level worth noting is support coming in at 0.6751 and the 200-day SMA (orange – 0.6681).
Weekly resistance, forged in the shape of a 2020 yearly opening level and a 2019 yearly opening level, at 0.7016 and 0.7042, respectively, took hold in recent trading. It might also interest some traders to note just above the said resistances we have a 61.8% Fibonacci retracement ratio sited at 0.7128 (green). In terms of support on the weekly timeframe, crosshairs remain fixed on 0.6677.
Areas of consideration:
Having noted weekly resistances (0.7042/0.7016) in play, the break of the 0.70 figure on the H4 may struggle to produce much of an upside move, despite intraday traders to potentially seek dip-buying strategies off the aforementioned level. This is not to say a rally from 0.70 will fail to take hold, as it might – the immediate trend is strongly to the upside. Should bulls maintain a presence, the 0.7050ish region represents strong resistance to target.
In terms of possible bearish scenarios, daily Quasimodo resistance at 0.7049 and H4 Quasimodo resistance at 0.7042 which aligns with the 2019 yearly opening level, is likely an area on the watchlists for many sellers today.
USD/JPY:
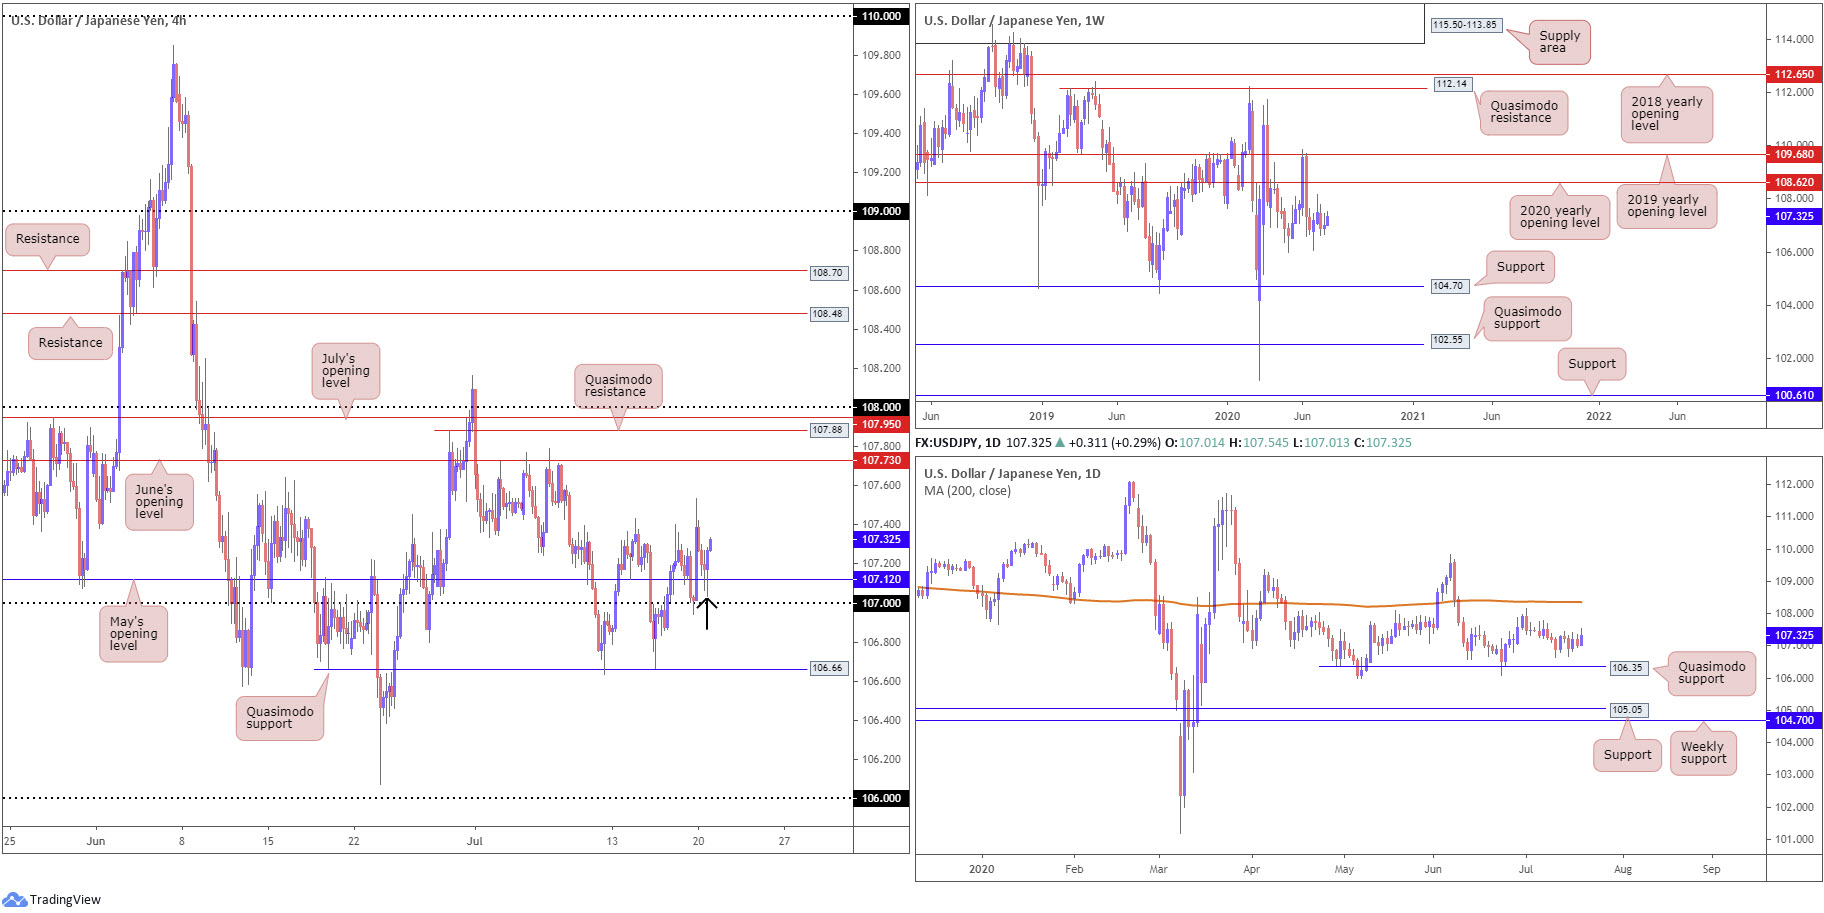
Since last Thursday, price readers will acknowledge the H4 timeframe has remained north of 107 and, for the most part, above May’s opening level at 107.12. Aside from local highs, June’s opening level at 107.73 is the next point of resistance, followed by Quasimodo resistance at 107.88, July’s opening level at 107.95 and the 108 handle. Under the 107 base, however, traders’ crosshairs will likely be fixed on familiar Quasimodo support coming in at 106.66.
Further out on the weekly timeframe, price is seen consolidating beneath the 2020 yearly opening level at 108.62. Support, on the other hand, can be derived from the 105.98 6th May low, with a break uncovering long-term support plotted at 104.70. Technical structure on the daily timeframe remains focused on Quasimodo support from 106.35 and the 200-day SMA (orange – 108.36) as resistance, assuming we get past the 108.16 July 1st high.
Areas of consideration:
Additional bullish sentiment above 107 is a possibility today, owing to the lack of H4 and higher timeframe resistances. Conservative traders may also find the recently formed H4 bullish engulfing candle useful (black arrow).
108, July’s opening level at 107.95 and Quasimodo resistance at 107.88 forms tight resistance to also keep an eye on, not only as an upside target, but also as a potential reversal zone for bearish signals. This is assuming price can take out June’s opening level at 107.73.
USD/CAD:
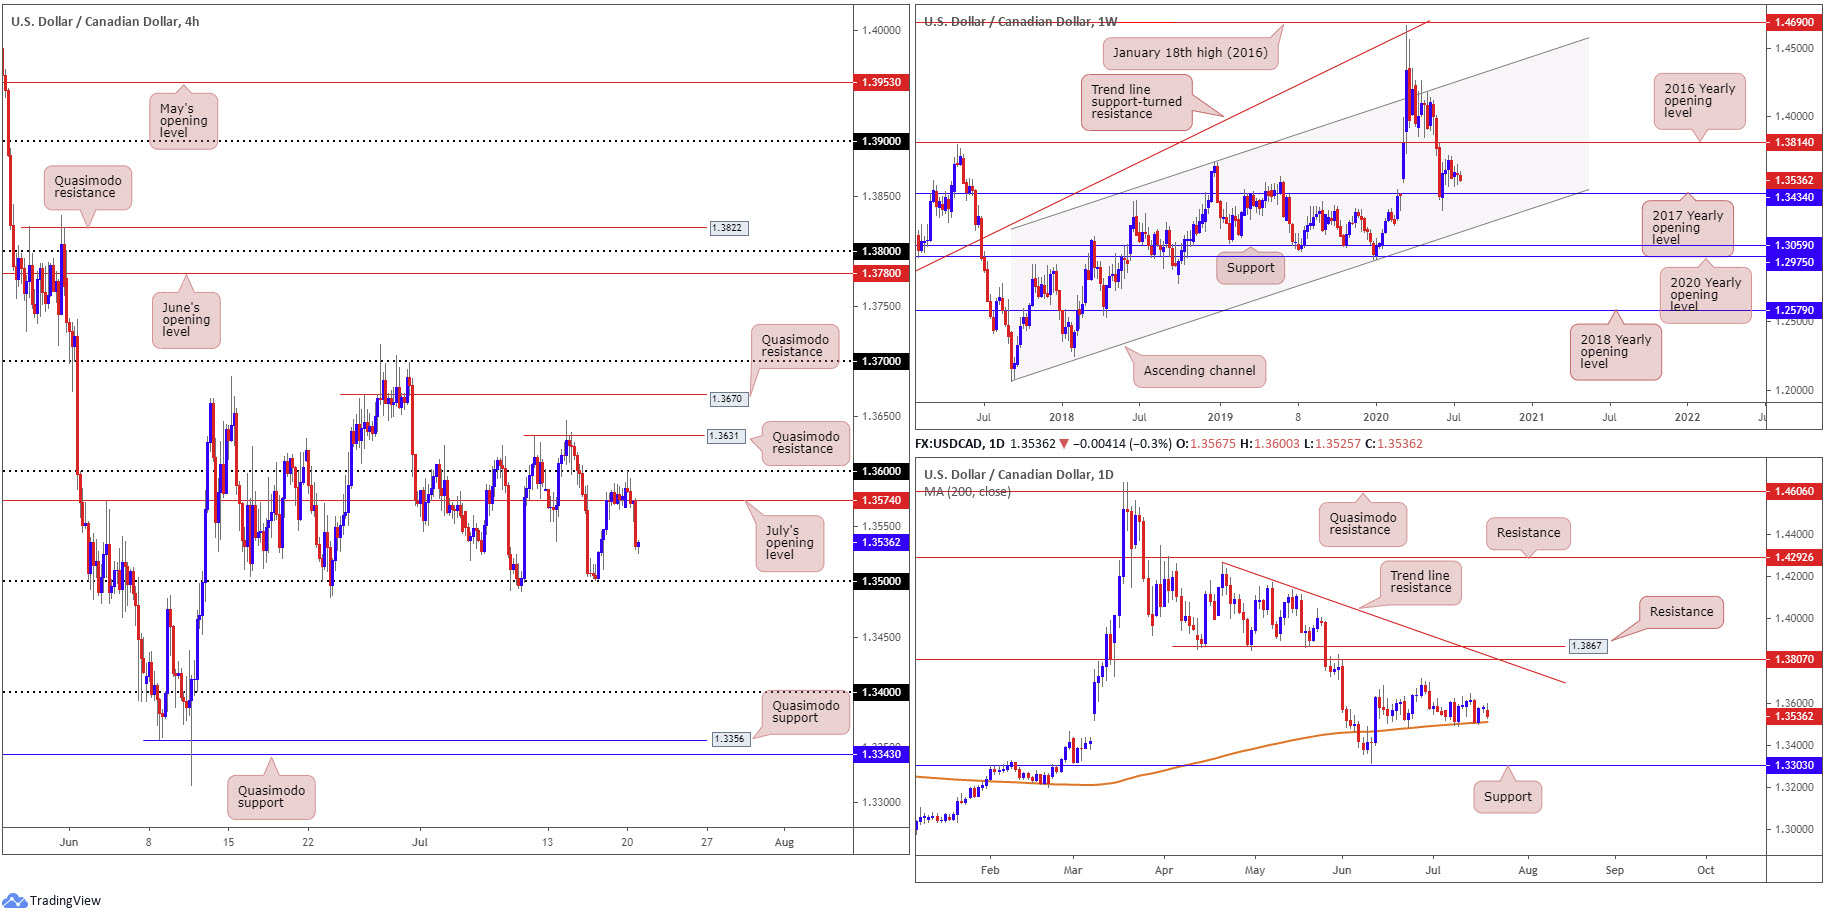
Early trade observed H4 knock on the underside of 1.36 and form what is commonly referred to as a shooting star pattern. As you can see, follow-through selling developed, submerging July’s opening level at 1.3574 and landing price action within touching distance of 1.35. Readers may also want to acknowledge the level has withstood downside attempts since June 23. Beyond the latter, we could be looking at a run to the 1.34 handle.
Action on the weekly timeframe is currently stationed north of the 2017 yearly opening level at 1.3434. Beyond 1.3434, channel support, taken from the low 1.2061, can be viewed as the next potential floor. A USD/CAD bid throws the 2016 yearly opening level at 1.3814 in the pot as feasible resistance, with follow-through buying to try and tackle a dense block of supply between 1.4190/1.3912.
Technical movement on the daily timeframe has buyers and sellers battling for position around the 200-day SMA (orange – 1.3510), with a break lower exposing support priced in at 1.3303. Besides the 1.3715 June 26 high, resistance can be seen at 1.3807 which merges closely with trend line resistance, extended from the high 1.4265, and another layer of resistance at 1.3867.
Areas of consideration:
With the 200-day SMA aligning closely with the 1.35 handle on the H4, the round number offers a platform for buyers to consider today. Conservative buyers, owing to the threat of fakeouts around psychological levels, may seek additional confirmation before pulling the trigger.
A break of 1.35, however, could stir breakout sellers, targeting weekly support at 1.3434 (2017 yearly opening level) to target, followed by 1.34 on the H4.
USD/CHF:
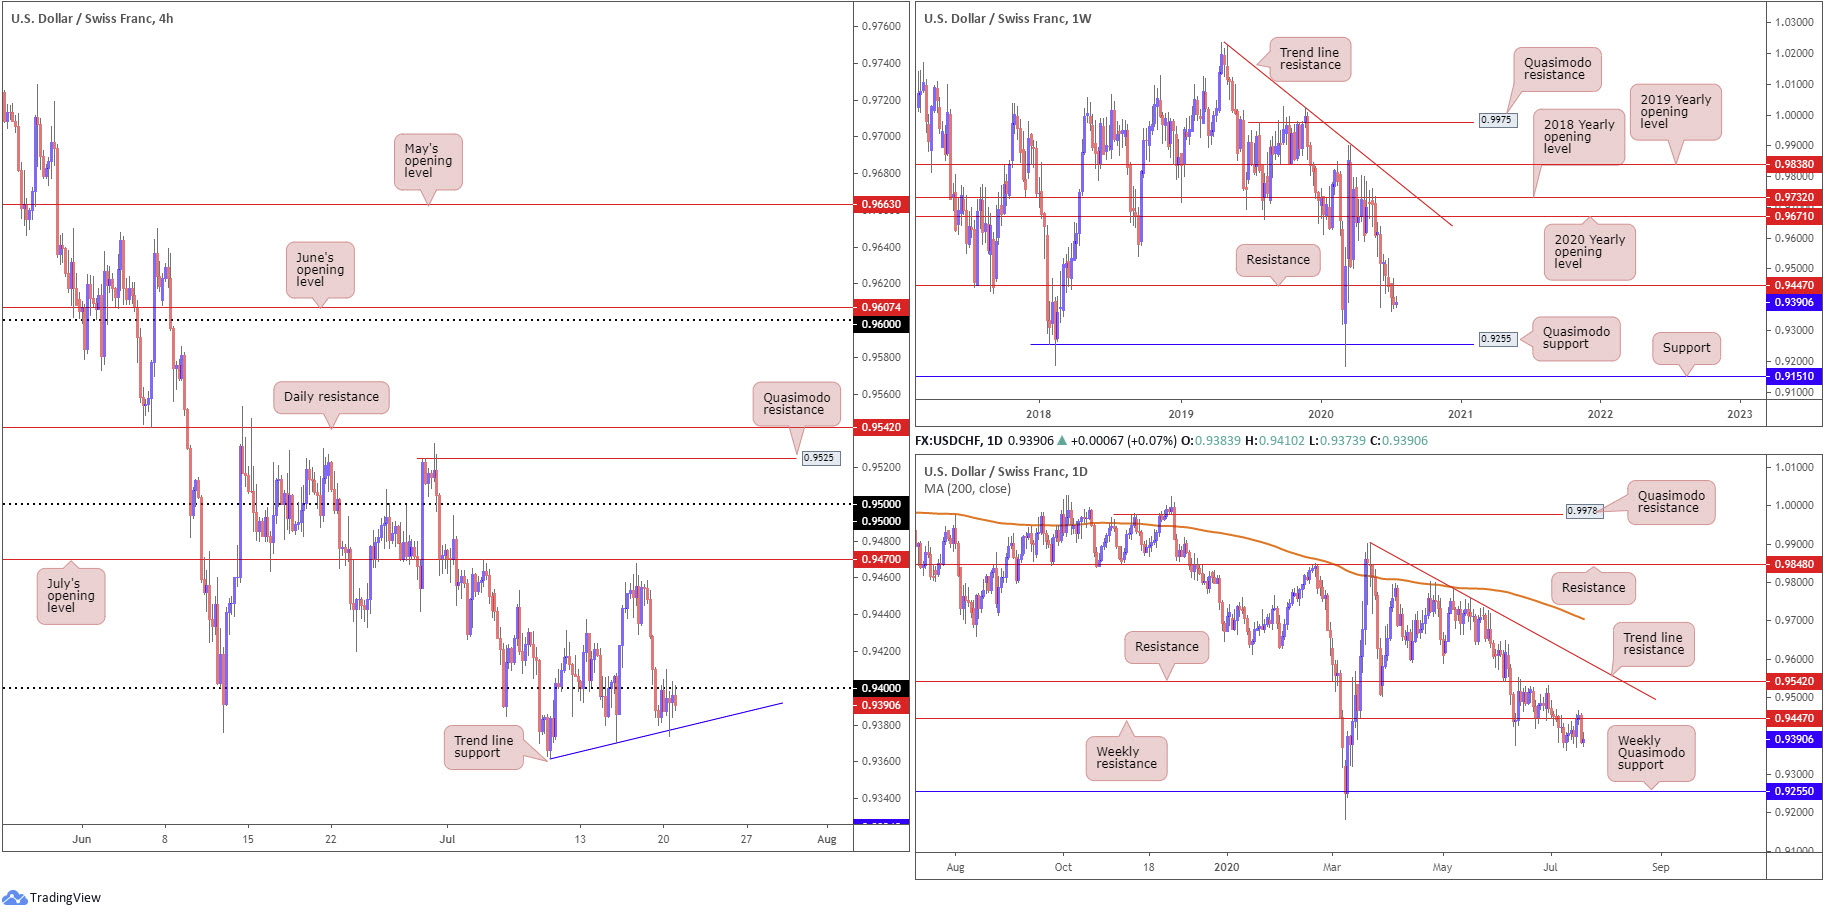
USD/CHF kicked off the week in a somewhat subdued fashion, clinging to the underside of 0.94 and testing local trend line support, taken from the low 0.9362, on the H4 timeframe. In the event buyers regain consciousness and reclaim 0.94+ status, July’s opening level at 0.9470 is in sight as feasible resistance, whereas a breach of the aforementioned trend line support could have sellers reach for Quasimodo support plotted at 0.9324.
Price action, based on the higher timeframes, recently gripped the underside of weekly resistance at 0.9447, suggesting we may eventually touch gloves with weekly Quasimodo support at 0.9255.
Areas of consideration:
With weekly price sheltering under resistance at 0.9447, the odds of H4 price holding under 0.94 and pushing through local trend line support today is high. A H4 close under the aforementioned trend line support is also likely to be interpreted as a sell signal, targeting H4 Quasimodo support at 0.9324, followed by the 0.93 handle and then weekly Quasimodo support mentioned above at 0.9255.
Dow Jones Industrial Average:
Major US benchmarks finished Monday mostly higher, elevated on the back of optimism surrounding prospects of a coronavirus vaccine. The Dow Jones Industrial Average advanced 8.92 points, or 0.03%; the S&P 500 advanced 27.11 points, or 0.84%, and the tech-heavy Nasdaq 100 concluded higher by 306.86 points, or 2.88%.
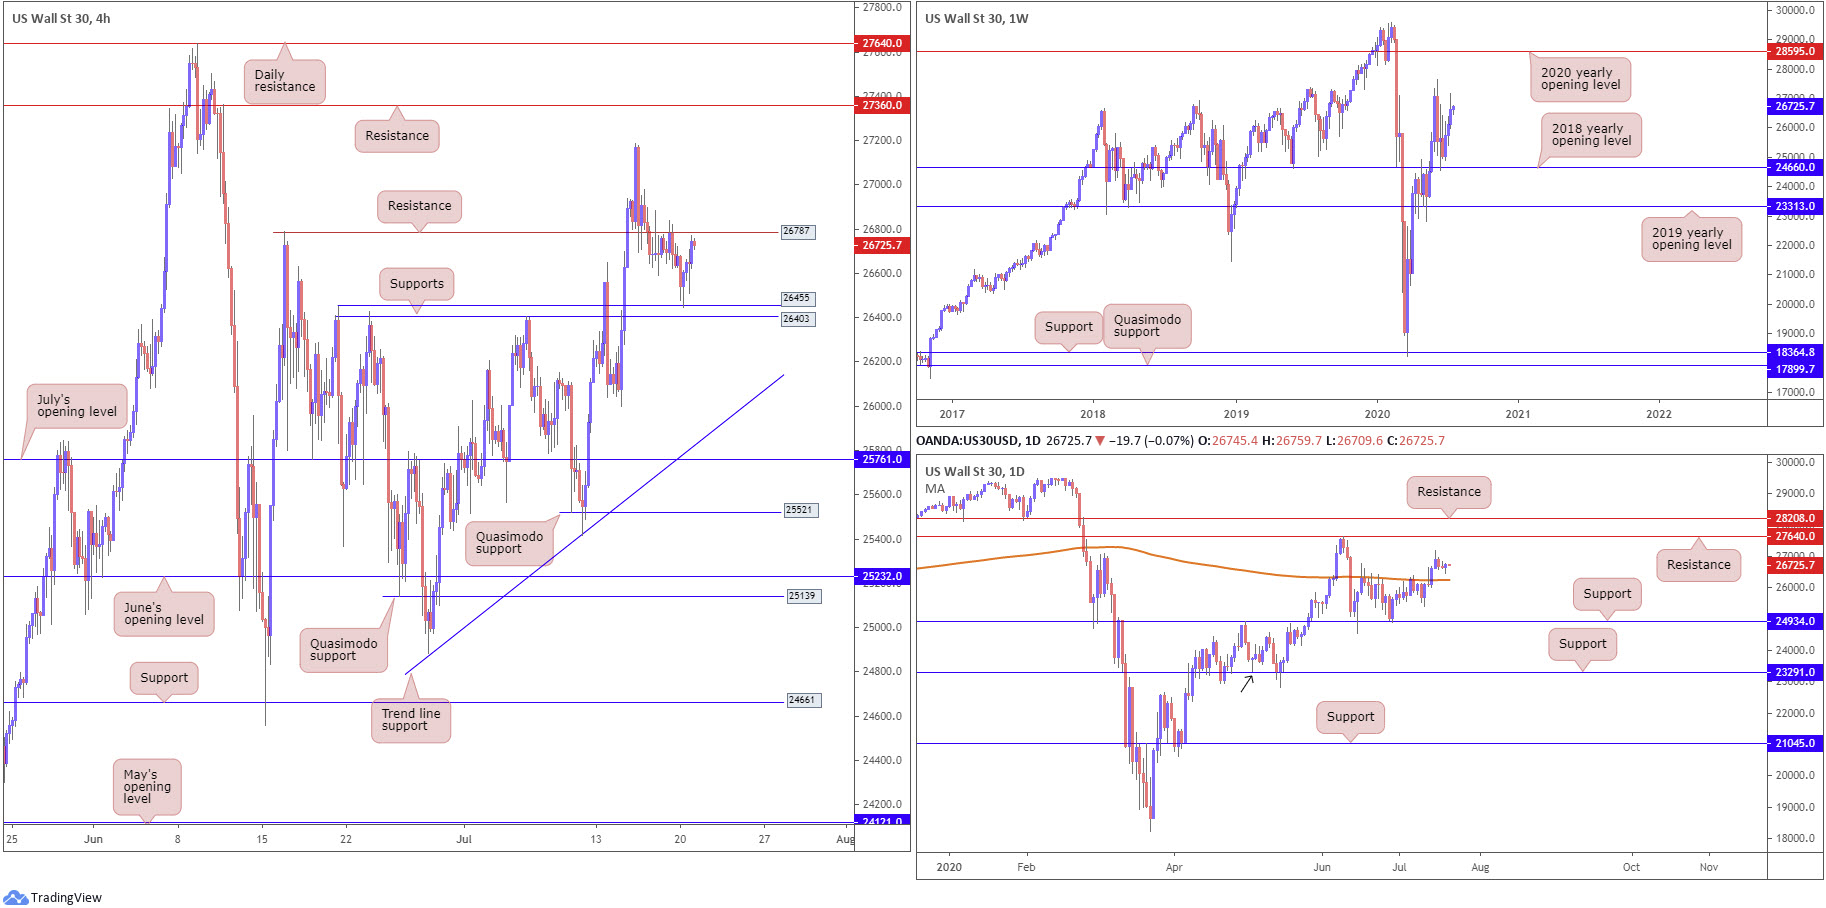
The technical picture recently threw H4 candles into support at 26455, leading to a recovery towards resistance at 26787. Gliding above the latter today opens things up to the 27187 July 15 high, closely shadowed by resistance at 27360. The flip side to this may see sellers drag price through 26455 (and nearby support at 26403) to potentially bring in trend line support, taken from the low 24881.
The story on the daily timeframe reveals the 200-day SMA (orange – 26253) recently gave way, a dynamic value capping upside since mid-June. Despite price action since consolidating, the move higher shifts interest towards resistance at 27640. From the weekly timeframe, the 2018 yearly opening level at 24660 remains an important base of support, with traders soon likely to pull in the 27638 high, followed by the 2020 yearly opening level at 28595.
Areas of consideration:
Dipping a toe in waters above H4 resistance at 26787 today, having noted room to explore higher levels on the bigger picture (see above), exposes a possible bullish theme, with the 27187 July 15 high in position as the first take-profit target. Conservative buyers may seek a retest at 26787 before committing.
XAU/USD (GOLD):
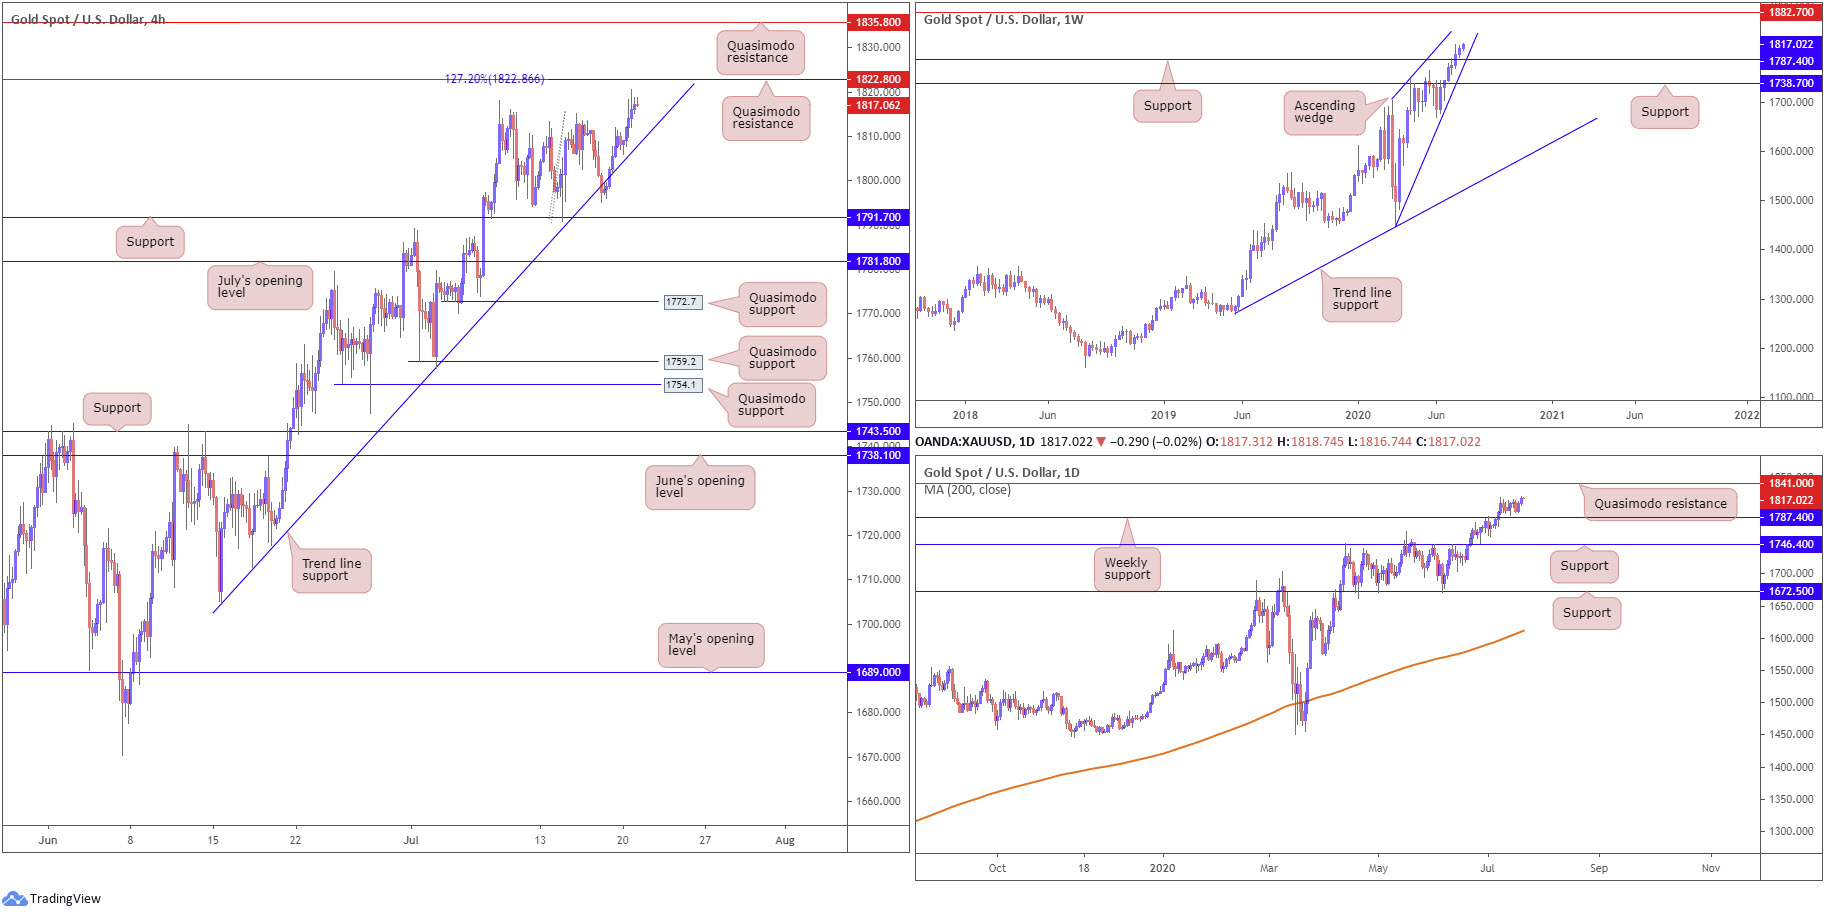
Following Friday’s rebound from trend line support, extended from the low 1705.0, Monday built on recent upside and threw a H4 Quasimodo formation at 1822.8 in the pot as resistance. This level also comes together with a 127.2% Fibonacci extension point at 1822.8, with a break uncovering another Quasimodo resistance at 1835.8. A break of the aforementioned trend line support could have H4 make a run for support at 1791.7.
From the weekly timeframe, bulls elbowed above Quasimodo resistance at 1787.4 (now a serving support) in recent trading. In line with the underlying trend, the break higher has perhaps laid the foundation for continuation buying to resistance stationed at 1882.7. Also of interest on the weekly timeframe is a potential ascending wedge pattern, forming between 1451.4/1703.2. In addition, clearing weekly Quasimodo resistance at 1787.4 on the daily timeframe stresses a possible run to daily Quasimodo resistance at 1841.0.
Areas of consideration:
Traders long Friday’s trend line support test may have reduced risk to breakeven at this point and are likely eyeing H4 Quasimodo resistance from 1822.8 to liquidate a portion of the position.
In light of the bigger picture indicating we’re headed for higher levels, alongside the current uptrend, attempting to fade 1822.8 may be a struggle. A H4 close above 1822.8, on the other hand, will not only please those already long, the move may also present additional buying opportunities to at least H4 Quasimodo resistance at 1835.8.
The accuracy, completeness and timeliness of the information contained on this site cannot be guaranteed. IC Markets does not warranty, guarantee or make any representations, or assume any liability regarding financial results based on the use of the information in the site.
News, views, opinions, recommendations and other information obtained from sources outside of www.icmarkets.com.au, used in this site are believed to be reliable, but we cannot guarantee their accuracy or completeness. All such information is subject to change at any time without notice. IC Markets assumes no responsibility for the content of any linked site.
The fact that such links may exist does not indicate approval or endorsement of any material contained on any linked site. IC Markets is not liable for any harm caused by the transmission, through accessing the services or information on this site, of a computer virus, or other computer code or programming device that might be used to access, delete, damage, disable, disrupt or otherwise impede in any manner, the operation of the site or of any user’s software, hardware, data or property.


