
Key risk events today:
BoJ Outlook Report and Monetary Policy Statement; BoJ Policy Rate and Press Conference; UK Average Earnings Index 3m/y; UK Claimant Count Change; UK Unemployment Rate; German ZEW Economic Sentiment; Canada Manufacturing Sales m/m.
(Italics represents previous analysis and outside sources)
EUR/USD:
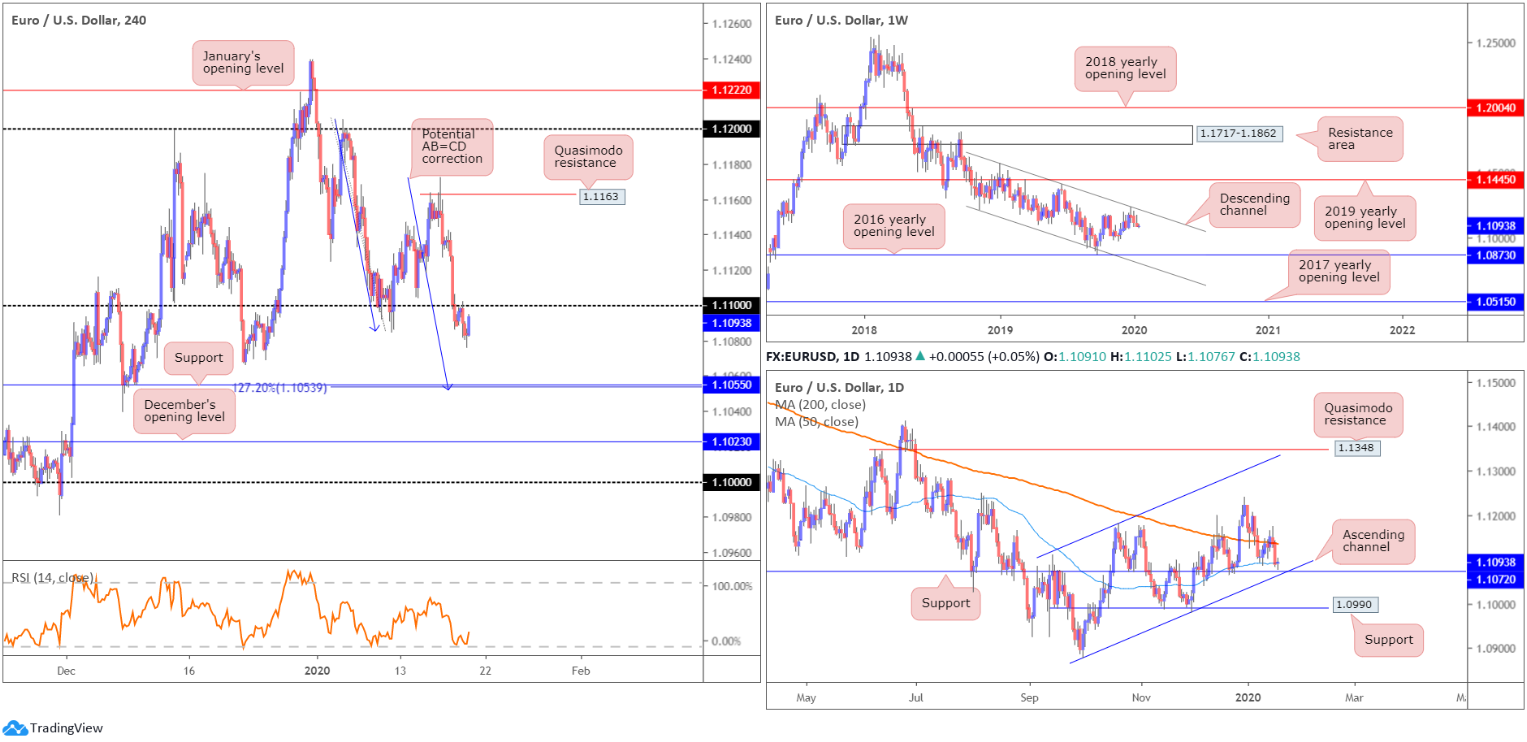
Markets observed soft trade Monday as US banks closed in observance of Martin Luther King Day. Short-term movement remained south of the 1.11 handle, retesting the figure as resistance during early Europe and clocking lows of 1.1076 heading into the US, before turning higher into the close.
Action on the weekly timeframe extended losses last week, south of long-standing channel resistance, drawn from the high 1.1569. Down for a third successive session, the next downside objective on this timeframe falls in around the 2016 yearly opening level at 1.0873 followed by channel support, taken from the low 1.1109. To the upside, assuming a break of the said channel resistance, price has the 2019 yearly opening level at 1.1445 to target. In terms of the primary trend, price has been trading lower since topping in early 2018, at 1.2555.
The 200-day SMA (orange – 1.1136) on the daily timeframe failed to offer much in the way of support in recent trading, with the unit closing the week out marginally beneath the 50-day SMA (blue – 1.1091). Notable support worthy of mention on this timeframe can be seen at 1.1072, closely shadowed by a channel support, drawn from the low 1.0879. A violation of 1.1072, however, has support priced in at 1.0990 in sight.
With respect to the H4 timeframe, although daily support resides close by at 1.1072 (see above), H4 highlights a potential 127.2% AB=CD correction (blue arrows) to support coming in at 1.1055. Indicator-based traders may also wish to note the relative strength index (RSI) is hovering north of oversold territory.
Areas of consideration:
Monday’s report highlighted the following:
A retest at 1.11 for potential shorting opportunities could be something to watch out for today. Aside from possible support emerging off the 50-day SMA, both weekly and daily timeframes exhibit room to press lower, at least until reaching daily support at 1.1072, the first downside target. Beyond here, traders likely have their crosshairs fixed on H4 support at 1.1055. In order to achieve favourable risk/reward, drilling down to the lower timeframes at 1.11 may be necessary. An M15 bearish candlestick signal, for example, could offer tighter entry/risk levels than a H4 or H1 signal.
An alternative scenario to keep an eye out for this week, one that goes against weekly direction (see above), is possible buying off daily support 1.1072, given it converges with a daily channel support. Entry based on a H4 close back above 1.11 on the H4 timeframe (considered a bullish indicator) could, therefore, be an idea.
Well done to any readers who managed to catch the 1.11 retest setup yesterday. Price came within four points of reaching daily support mentioned above at 1.1072.
An additional retest at 1.11 may form today, given the recent advance, therefore shorts from this angle could once again be a consideration.
GBP/USD:
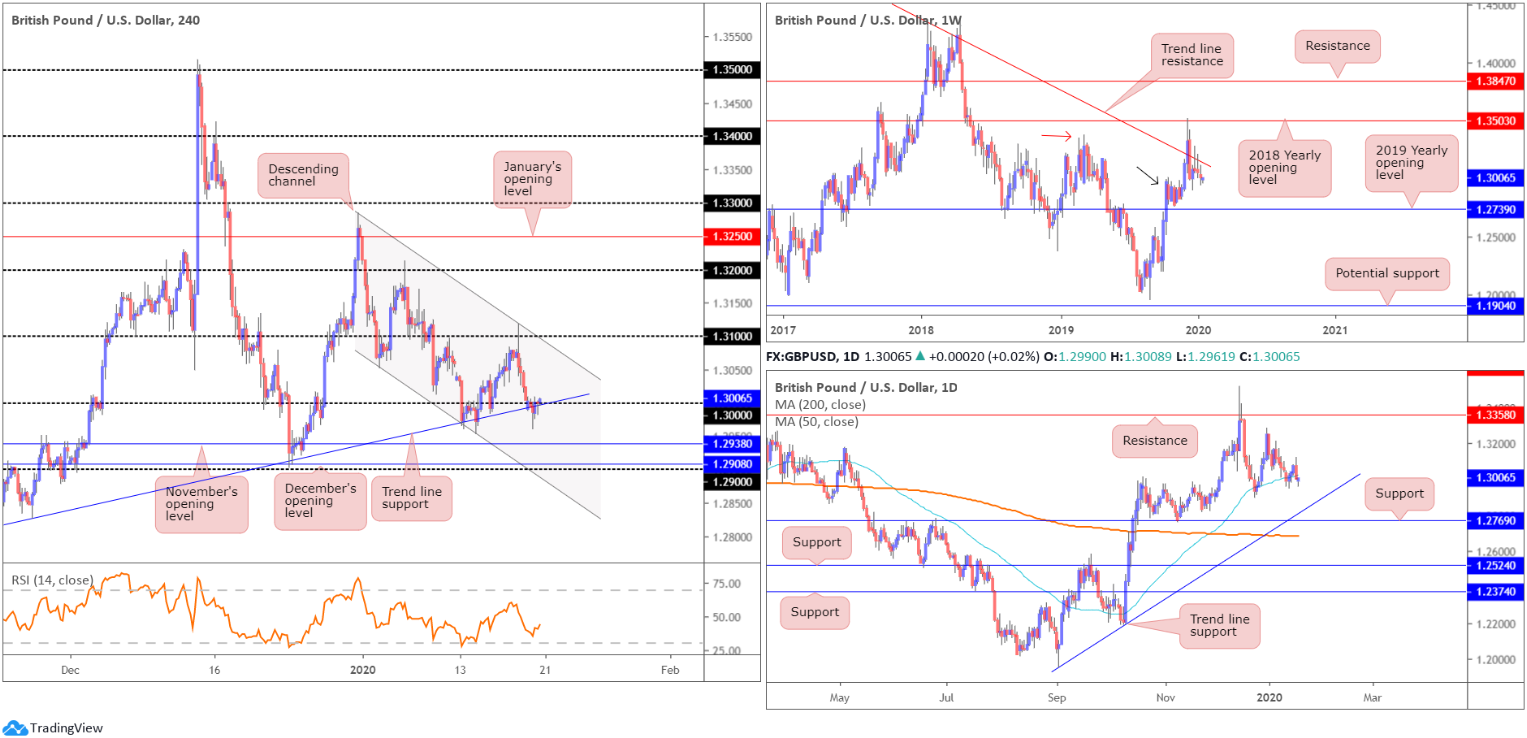
While volatility was somewhat limited Monday, traders who entered long from the key figure 1.30/trend line support, extended from the low 1.2768, had stops tripped as price scored lows of 1.2961. Beneath 1.30, November’s opening level at 1.2938 is visible, with a break exposing December’s opening level at 1.2908 and the 1.29 handle.
As of current action, though, H4 is attempting to reclaim lost ground and close back above the round number. This may lead to a move towards channel resistance, taken from the high 1.3284, and maybe the 1.31 handle.
In terms of the higher timeframes, here’s what Monday’s technical briefing had to say:
Following two back-to-back shooting star bearish candlestick patterns off long-standing weekly trend line resistance (pencilled in from the high 1.5930), sellers continued to probe lower last week. Despite recent declines, buyers are attempting to defend nearby demand around the 1.2939 region (black arrow), seduced by the recent break of the notable high at 1.3380 (red arrow). Continued selling, nevertheless, implies we might see a push lower to the 2019 yearly opening level at 1.2739, consequently tripping sell stops below the aforementioned demand zone.
A closer reading on the daily timeframe shows the 50-day SMA (blue – 1.3019) struggled to hold price higher over the course of last week. A minor breach of the dynamic value to lows of 1.2954 took place Tuesday, with Friday also closing the week out marginally lower, by way of an outside bearish day formation. A move lower from here highlights trend line support, taken from the low 1.1958. Another layer of support is visible nearby at 1.2769, sited a few points north of the 200-day SMA (orange – 1.2687). With respect to resistance, the only level of interest right now sits at the 1.3284 December 31st high and 1.3358, which capped upside since mid-June 2019.
Areas of consideration:
Monday’s analysis reported the following:
Traders considering a sell based on Friday’s daily bearish outside candle may opt to wait and see if H4 price closes beneath 1.30 prior to pulling the trigger. A more conservative approach might be to wait for a retest at 1.30 to take hold, preferably in the shape of a H4 bearish candlestick formation as fakeouts through round numbers are common viewing. As for the initial take-profit target, November’s opening level at 1.2938 appears a logical starting base.
A H4 retest formed by way of a bearish candlestick signal not only recognises seller intent, it helps position entry and risk levels.
Price did indeed close beneath 1.30 yesterday, which likely triggered eager shorts. Those who favoured the more conservative approach, nonetheless, remain flat as the retest produced little in regards to bearish candlestick confirmation.
AUD/USD:
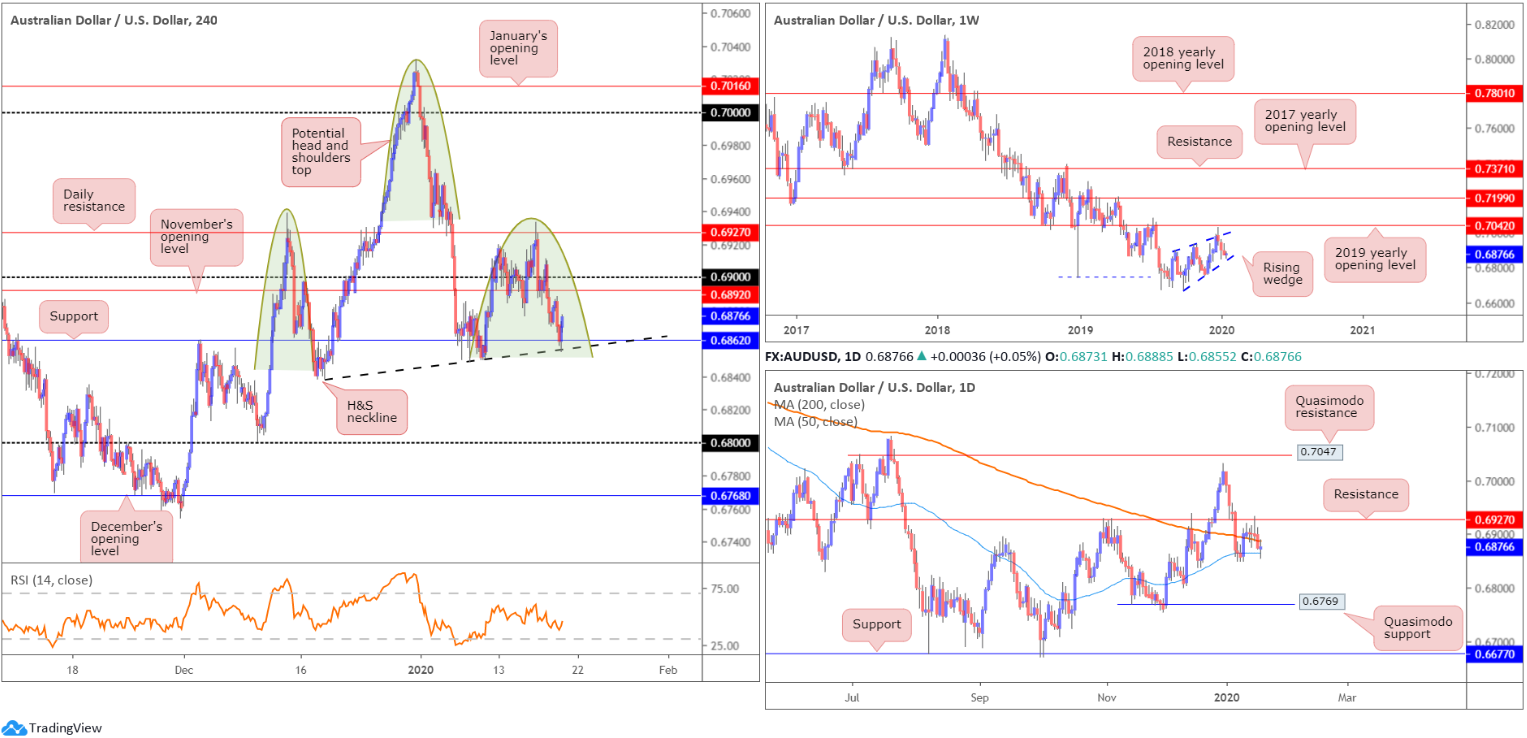
The absence of macroeconomic data and holiday-thinned US trade witnessed AUD/USD conclude unchanged Monday, forming a clear-cut daily doji indecision candle. Movement on the H4 timeframe, however, saw the unit shake hands with support at 0.6862 and push higher.
As underlined in Monday’s technical briefing, H4 price has also been chalking up a potential head and shoulders top pattern since mid-December 2019 (left shoulder sports a top at 0.6938, right shoulder at 0.6933 and the head at 0.7031 – green). The neckline is drawn from the 0.6838 December 18 low and the 0.6850 January 9 low (black line). Traditionally, traders wait for a close beneath the neckline to trigger shorts; others may attempt a short at the right shoulder or even at the formation of the head.
On a wider perspective, weekly action, since registering a bottom in late September at 0.6670, has been carving out what appears to be a rising wedge formation, typically considered a continuation pattern. Over the past three weeks, price declined back into the rising wedge, following a minor whipsaw through the top edge of the said wedge, missing the 2019 yearly opening level at 0.7042 by a mere ten points. With the primary downtrend having been in full force since topping at 0.8135, in early 2018, a break lower beyond the lower edge of the noted wedge formation could be seen. This would trigger weighty sell stops, both from lower-timeframe traders entering long the correction and longer-term traders’ breakout sell orders.
Daily resistance at 0.6927 capped upside Thursday, establishing a robust selling wick, with Friday finishing beneath the 200-day SMA (orange – 0.6886). The 50-day SMA (blue – 0.6864) entered view yesterday, offering support. As we head into Tuesday’s session, price is capped between the two said SMAs.
Areas of consideration:
According to our chart studies, focus remains on the completion of the H4 head and shoulder’s top this week. A H4 close beneath the neckline unlocks a potential bearish theme, with an initial (structure) target set at 0.68. H&S traders, though, will be looking for much lower levels.
An ideal entry scenario for most conservative traders would be for a H4 close beneath support at 0.6862 (and the H&S neckline) that’s followed up with a retest in the form of a notable H4 bearish candlestick pattern (entry and risk can be determined according to the candlestick’s structure).
USD/JPY:
USD/JPY entered a lacklustre phase Monday amid holiday-thinned trade, confined to a narrow range in the form of a modest potential H4 pennant pattern (blue lines), north of the 110 handle. Quasimodo resistance at 110.32 (drawn from mid-May 2019) remains in view as the next upside hurdle. Aside from the 109.79 January 15 low, limited support is visible south of 110 until reaching 109.68, closely followed by December’s opening level at 109.51.
Against the backdrop of short-term flow, weekly resistances, comprised of the 2019 yearly opening level at 109.68 and trend line resistance, extended from the high 114.23, gave way in recent trading, perhaps setting a long-term stage for a run to Quasimodo resistance at 112.14 and the 2018 yearly opening level at 112.65. Prior to further buying, however, the possibility of a retest at 109.68 is certainly there. In terms of market trend, immediate flows point north.
In similar fashion, daily price is establishing ground north of the recently broken weekly resistance at 109.68. According to the daily timeframe, additional upside is also a possibility this week, though resistance is seen around the 110.89 region on this scale.
Areas of consideration:
All three timeframes point to further upside this week; a retest at 110 could be something to watch out for today. A successful retest, preferably by way of a H4 bullish candlestick signal, is likely enough to entice further buying. The idea behind H4 candlestick confirmation is to help identify buyer intent off the round number, which, as most already understand, are frequently prone to whipsaws.
Entry and risk can be determined according to the H4 candlestick pattern, while the first take-profit target is seen at the H4 Quasimodo resistance 110.32, with daily resistance at 110.89 next on tap.

USD/CAD:
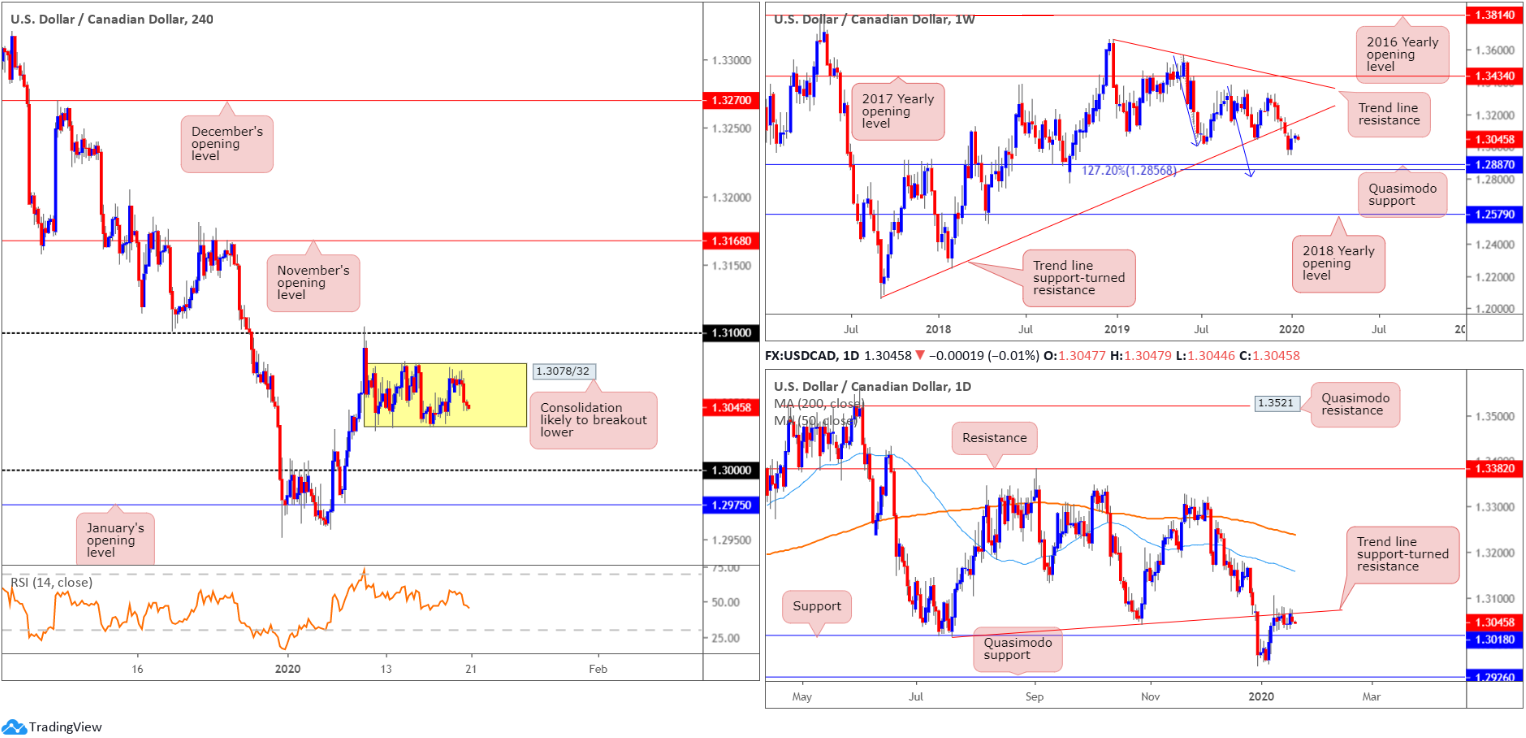
Since January 10, USD/CAD has been confined between 1.3078/32 on the H4 timeframe. Outside of this range, areas of interest fall in at 1.30, sited above January’s opening level at 1.2975, and 1.31, with a break underlining November’s opening level at 1.3168.
Structure on the weekly timeframe shows price could swing either way. To the upside, we have trend line support-turned resistance, extended from the low 1.2061. Lower on the curve, the pair also exhibits scope to test Quasimodo support at 1.2887, positioned close by a 127.2% AB=CD bullish correction (blue arrows) at 1.2856. The immediate trend has faced north since bottoming in September 2017; however, this move could also be considered a deep pullback in a larger downtrend from the 1.4689 peak in early January 2016.
Daily flow remains capped at the underside of a trend line support-turned resistance, taken from the low 1.3015. Sellers from this point have support at 1.3018 in view, with a break possibly triggering a push to the 1.2951 December 31 low and Quasimodo support at 1.2926. A break to the upside, nonetheless, has the 50-day SMA (blue – 1.3157) in view, trailed by the 200-day SMA (orange – 1.3238).
Areas of consideration:
With weekly price displaying room to explore lower ground, and daily price holding at the underside of trend line resistance, the lower edge of the current H4 consolidation is likely to give way. Traders, therefore, have the option of either attempting to sell the top edge of the range (this is best done entering on the back of additional candlestick confirmation to help avoid whipsaws [entry/risk can be determined according to the candle pattern]), or waiting for a breakout to form. The latter, although considered the more conservative route, unfortunately has immediate support at 1.30 to contend with, consequently limiting risk/reward.
USD/CHF:
For those who read Monday’s technical briefing on the H4 timeframe you may recall the following:
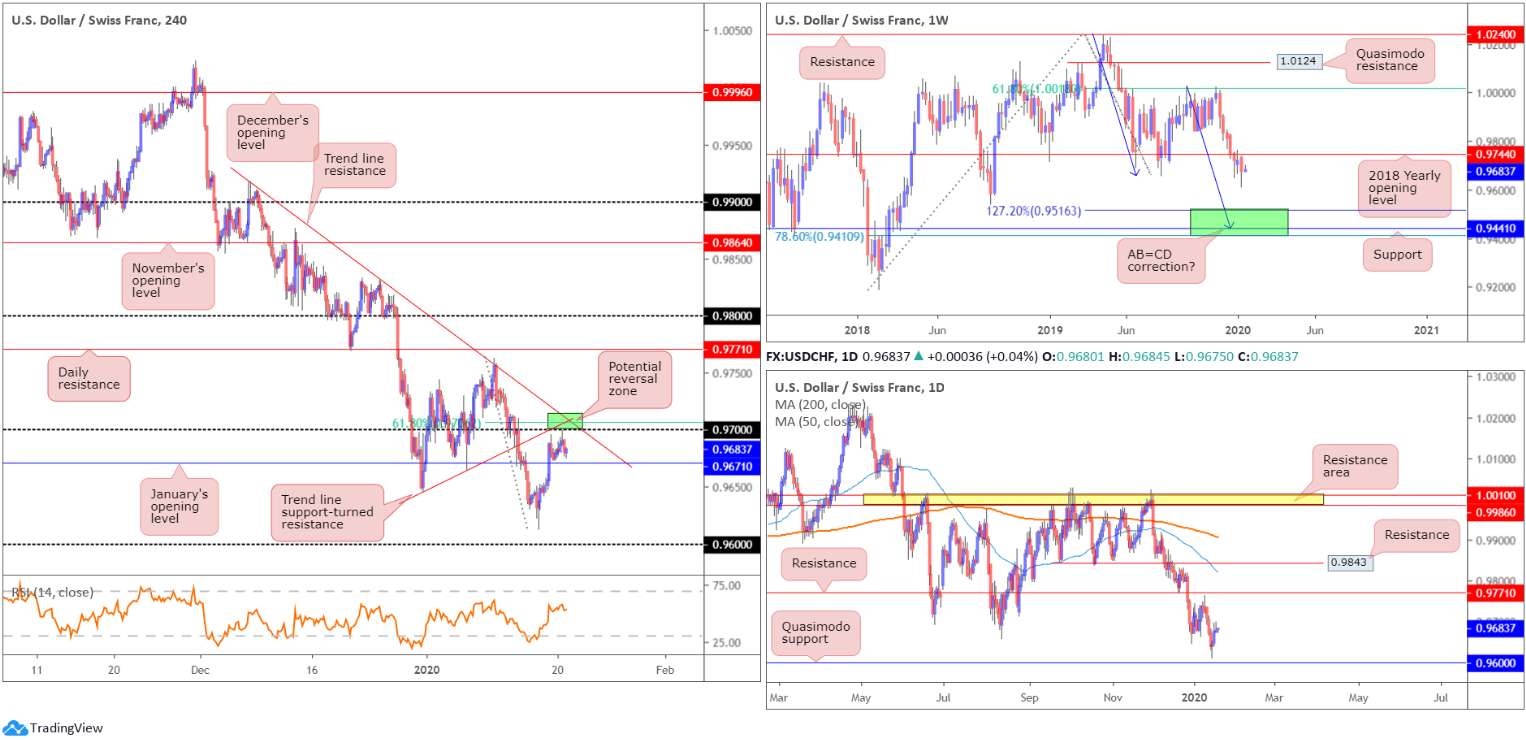
USD/CHF built on Thursday’s intraday recovery on Friday, led by broad-based USD buying. The pair refreshed session tops with bulls now poised to approach the 0.97 handle. Although we crossed above January’s opening level at 0.9671, a reasonably strong reversal zone is present around 0.97. Comprised of a 61.8% Fibonacci resistance at 0.9707 and two trend line resistances, we could be heading for fresh yearly lows from here this week, targeting daily Quasimodo support at 0.9600 (the 0.96 handle also on the H4).
As evident from the H4 timeframe, price fell short of reaching 0.97 by less than a point on the charted feed, before turning lower amid holiday-thinned trade. The session wrapped up within striking distance of January’s opening level mentioned above at 0.9671.
The situation on the higher timeframes, however, remains pretty much unchanged:
Weekly timeframe:
Following a brief pause, that snapped a five-week losing streak and retested the underside of the 2018 yearly opening level at 0.9744, USD/CHF reignited its bearish tone last week. Losing more than 45 points and clocking lows of 0.9613, levels not seen since September 2018, the next downside target sits in the range of 0.9410/0.9516 (comprised of a 78.6% Fibonacci retracement at 0.9410, support at 0.9441 and a 127.2% AB=CD bullish correction [black arrows] at 0.9516 – green]).
Daily timeframe:
Leaving Quasimodo support at 0.9600 unopposed (drawn from September 2018), Thursday printed a half-hearted hammer candlestick pattern (considered a bullish signal), followed through on Friday’s modest upside.
Resistance, according to the technical studies presented here, is not expected to arise until crossing swords with 0.9771.
Areas of consideration:
Those who missed yesterday’s sell will likely be watching for the H4 candles to close south of 0.9671. A close beneath here, that’s preferably followed up with a retest in the shape of a bearish candlestick signal, is possibly enough to encourage further selling to the 0.9613 January 16 low, closely shadowed by the 0.96 handle (which also represents daily Quasimodo support).
XAU/USD (GOLD):
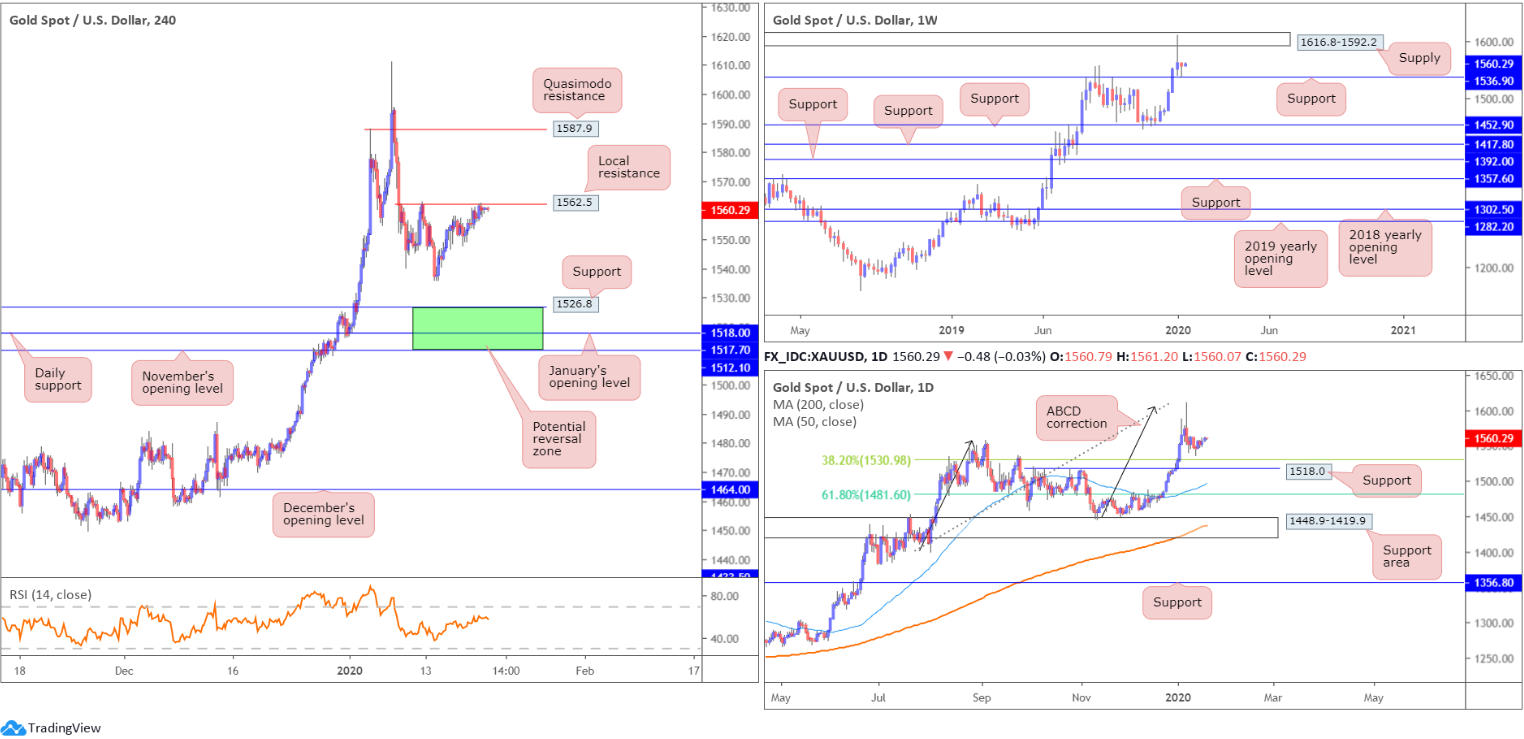
Gold prices finished Monday mostly unmoved, though H4 price did manage to cross paths with resistance coming in at 1562.5. Technically, this was yesterday’s main highlight.
A break of 1562.5 suggests a run towards Quasimodo resistance plotted at 1587.9. A move lower from 1562.5 may see the 1536.1 January 14 low make an appearance, followed by an area of support (green) between November’s opening level at 1512.1 and support at 1526.8 (daily support at 1518.0 and January’s opening level at 1517.7 seen within).
Weekly price is seen recovering from support at 1536.9, following a dominant rejection out of supply at 1616.8-1592.2. A violation of the said support could prompt selling towards additional layers of support at 1452.9, 1417.8, 1392.0 and 1357.6.
Although we seem to be entering into a bottoming phase on the daily timeframe, it’s still worth bearing in mind the 38.2% Fibonacci retracement at 1530.9 as support, closely followed by 1518.0. The former offers an initial take-profit target for traders short the ABCD bearish correction (black arrows) at 1608.0.
Areas of consideration:
Should a selloff occur, 1512.1/1526.8 on the H4 timeframe is a zone worth watching for signs of buyer intent. Not only does it boast a strong mix of confluence, the support area forms in line with the primary trend.
Continued buying, along with a H4 close north of H4 resistance at 1562.5, unlocks the door to potential bullish themes, targeting H4 Quasimodo resistance at 1587.9, closely shadowed by the lower edge of weekly supply at 1592.2. Breakout traders will likely enter on the close of the breakout candle, and position stops beneath its respective low (lower candle shadow). A more conservative approach entails waiting for a retest at 1562.5 to occur and entering based on the rejection candle’s framework, either at market or using a buy stop entry.
The accuracy, completeness and timeliness of the information contained on this site cannot be guaranteed. IC Markets does not warranty, guarantee or make any representations, or assume any liability regarding financial results based on the use of the information in the site.
News, views, opinions, recommendations and other information obtained from sources outside of www.icmarkets.com.au, used in this site are believed to be reliable, but we cannot guarantee their accuracy or completeness. All such information is subject to change at any time without notice. IC Markets assumes no responsibility for the content of any linked site.
The fact that such links may exist does not indicate approval or endorsement of any material contained on any linked site. IC Markets is not liable for any harm caused by the transmission, through accessing the services or information on this site, of a computer virus, or other computer code or programming device that might be used to access, delete, damage, disable, disrupt or otherwise impede in any manner, the operation of the site or of any user’s software, hardware, data or property.


