
A note on lower timeframe confirming price action…
Waiting for lower timeframe confirmation is our main tool to confirm strength within higher timeframe zones, and has really been the key to our trading success. It takes a little time to understand the subtle nuances, however, as each trade is never the same, but once you master the rhythm so to speak, you will be saved from countless unnecessary losing trades. The following is a list of what we look for:
- A break/retest of supply or demand dependent on which way you’re trading.
- A trendline break/retest.
- Buying/selling tails/wicks – essentially we look for a cluster of very obvious spikes off of lower timeframe support and resistance levels within the higher timeframe zone.
- Candlestick patterns. We tend to only stick with pin bars and engulfing bars as these have proven to be the most effective.
We search for lower timeframe confirmation between the M15 and H1 timeframes, since most of our higher-timeframe areas begin with the H4. Stops are usually placed 5-10 pips beyond confirming structures.
EUR/USD:
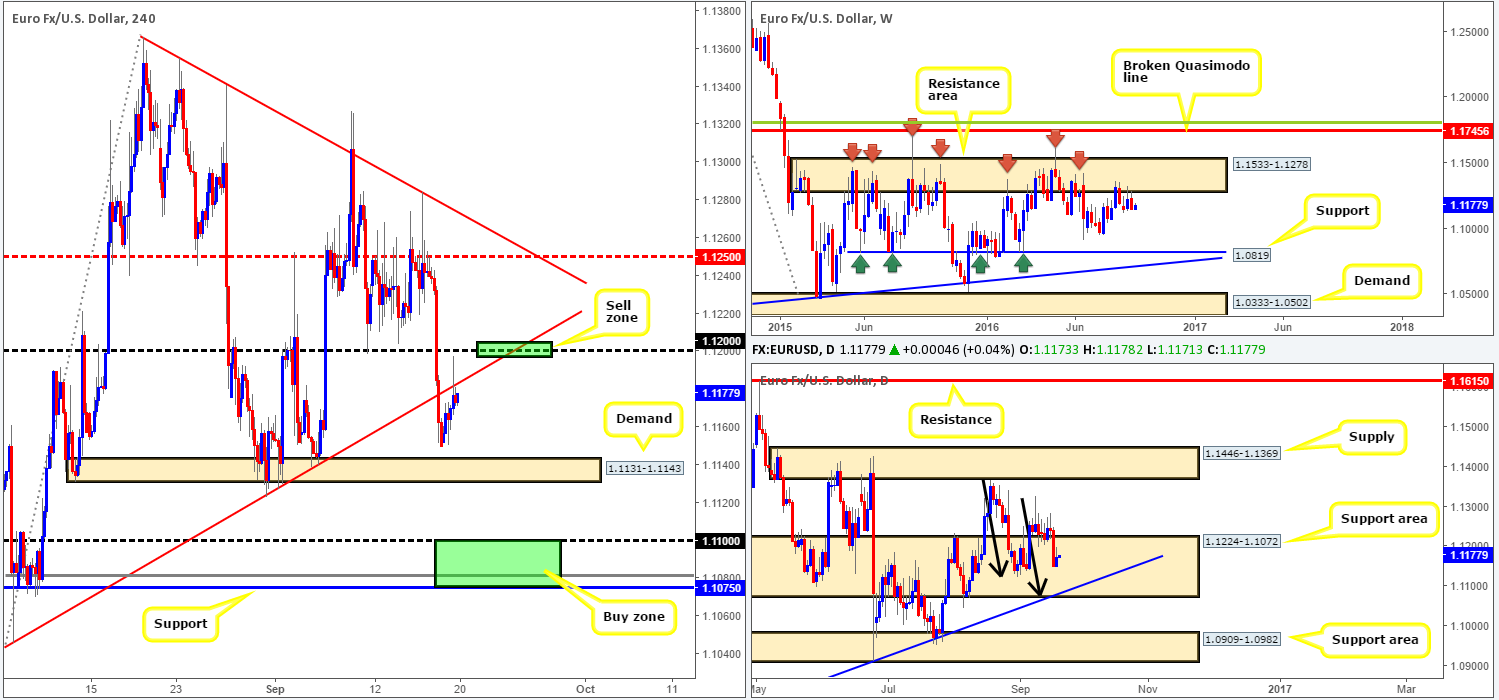
Following the week’s open, we can see that the shared currency staged a modest recovery just ahead of a H4 demand base seen at 1.1131-1.1143. From here, price managed to reach highs of 1.1197, which, as you can see, also saw price aggressively whipsaw through a H4 trendline resistance taken from the low 1.1045 going into yesterday’s US open. By and large, the structure of this market remains unchanged. As such, much of the following report will echo thoughts put forward in Monday’s analysis…
Turning our attention to the higher-timeframe picture, weekly price turned bearish from the underside of a major resistance area coming in at 1.1533-1.1278 last week. This move could trigger further selling in this market this week. The next downside target to have an eye on falls in around the 1.0970 region, followed closely by a major support seen at 1.0819. On the other side of the coin, the daily candles are still seen trading deep within a support area drawn from 1.1224-1.1072. As we’ve mentioned several times in previous writings, there’s been little noteworthy bullish intent registered from this barrier as of yet. Perhaps the most compelling factor here is that the candles are in the process of completing an AB=CD bull pattern (black arrows) which terminates around the lower edge of the above said support area, and also converges with a trendline support extended from the low 1.0516.
Our suggestions: Apart from yesterday’s modest rally of 20 or so pips (open/close), our recommended setups remain the same going into today’s sessions:
- A short from 1.12 is valid, in our opinion, due to merging with the recently broken H4 trendline. What’s more, let’s not forget that the both higher-timeframe charts suggest lower prices could be seen this week (see above).
- A break below the current H4 demand zone, nonetheless, would likely place the H4 support at 1.1075 and the 1.11 band on the hit list. Not only is this a good take-profit area for any shorts in this market, it is also a fantastic barrier to look for longs. It sits within the depths of the aforementioned daily support area, as well as merging with both the above noted daily trendline support and a deep H4 88.6% Fib support at 1.1081.
On the data front, you may want to keep an eyeball on the US housing data scheduled to be released at 1.30pm GMT today.
Levels to watch/live orders:
- Buys: 1.1075/1.11 [strong-looking buy zone which could, dependent on the time of day and approach, be sufficient enough to condone an entry without waiting for lower timeframe confirmation] (Stop loss: 1.1060).
- Sells: 1.12 region [H4 bearish close required] (Stop loss: beyond the trigger candle).
GBP/USD:
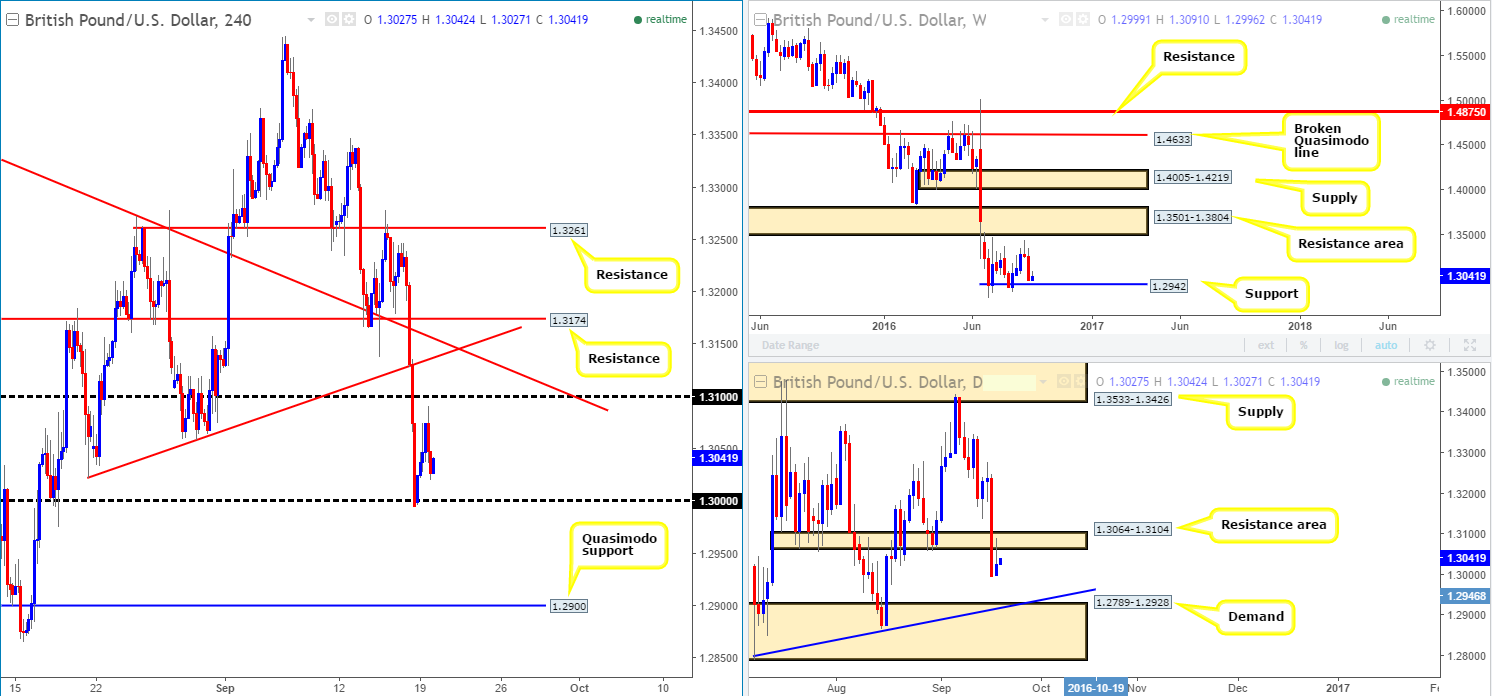
The buyers managed to find their feet early on in the day yesterday, bidding price higher from the key figure 1.30 to highs of 1.3091 going into the American session. Technically speaking, the reason for price rotating 10 pips ahead of the 1.31 handle, as far as we can see, was simply down to daily price also seen testing a resistance area coming in at 1.3064-1.3104. From our point of view, this lands the pair in a difficult position. Both 1.30 and 1.31 carry weight! 1.30 is attractive because it is recognized by the majority of the market as a key number, and 1.31 due to its connection with the above noted daily resistance area.
According to the daily chart, there’s room seen for further selling down to a rather large demand area chiseled in at 1.2789-1.2928 that blends with a trendline support extended from the low 1.2789. In support of this, the weekly chart also shows scope for further downside to support penciled in at 1.2942. Couple all of this together with the fact that the pair is entrenched within a major downtrend at the moment, we feel 1.30 is slightly more fragile than 1.31.
Our suggestions: Although 1.30 is likely being watched by the majority of the market, we’re wary of buying from here with it having little higher-timeframe support. Therefore, our prime focus remains on the following setups:
- Watch for a decisive close below 1.30, and then look to trade any retest seen to the underside of this number (waiting for a H4 bearish close following the retest is recommended), targeting weekly support at 1.2942.
- In the event that prices rally, nevertheless, 1.31 looks relatively attractive for shorts given its connection with the top edge of the daily resistance area at 1.3104. Waiting for at least a H4 bearish close to form prior to pulling the trigger is recommended to avoid the dreaded fakeout.
Levels to watch/live orders:
- Buys: Flat (Stop loss: N/A).
- Sells: 1.31 region [H4 bearish close required] (Stop loss: beyond the trigger candle). Watch for price to close beyond 1.30 and then look to trade any retest seen thereafter [waiting for a H4 bearish close following the retest is preferred] (Stop loss: beyond the trigger candle).
AUD/USD:
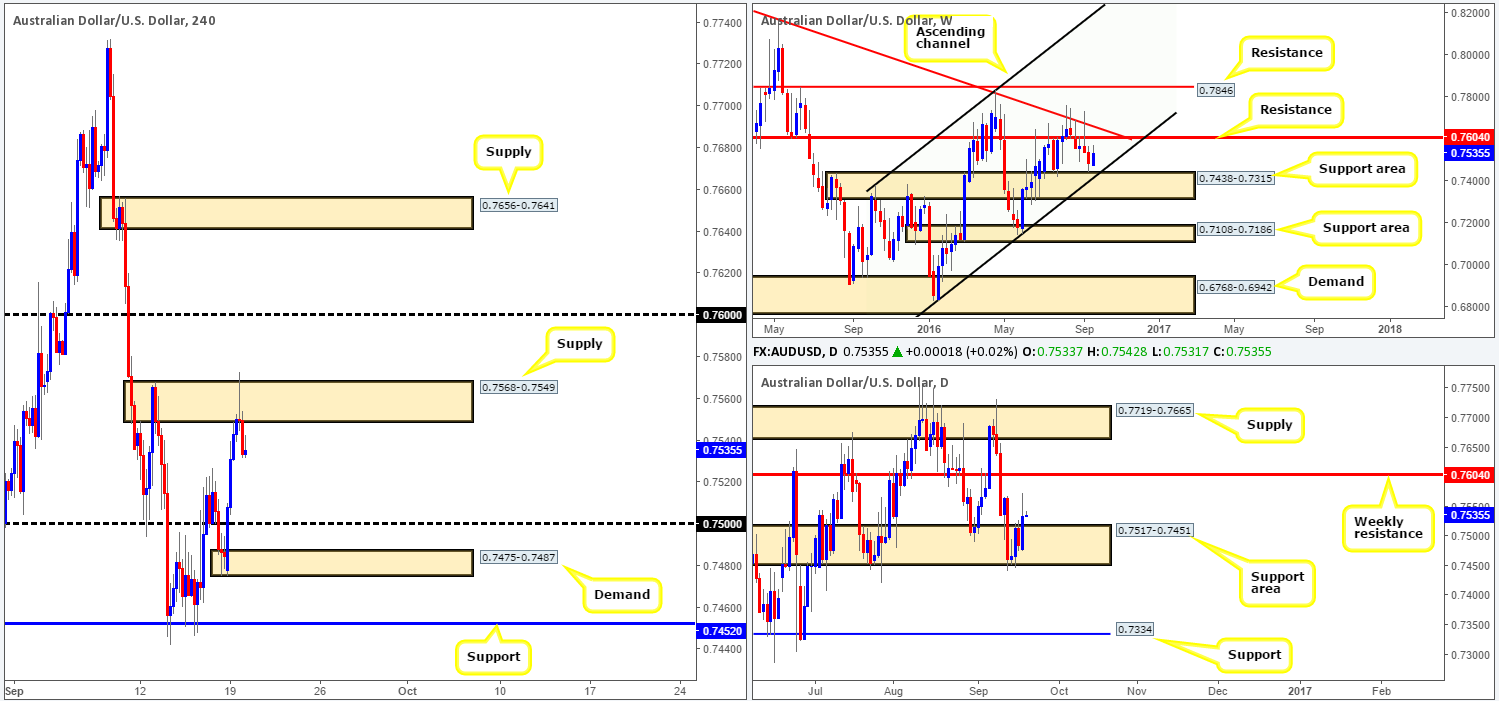
Using a top-down approach this morning we can see that the bulls remain in a dominant position above the weekly support area seen at 0.7438-0.7315, which is complemented by a weekly channel support line extended from the low 0.6827. In the event that the bulls hold position here, we could see prices retest the underside of the weekly resistance level at 0.7604 once again! Down on the daily chart, price is also reflecting a bullish stance from the support area seen at 0.7517-0.7451, with yesterday’s action chalking up a bullish engulfing candle.
Stepping over to the H4 chart, yesterday’s advance took out the 0.75 handle and went on to breach supply drawn from 0.7568-0.7549. This likely triggered a truckload of stops above this zone and potentially cleared the pathway north for further buying today up to the 0.76 hurdle, which, as you can probably see, represents the above noted weekly resistance line at 0.7604.
Our suggestions: The only areas that really catch our eye this morning are the 0.75 handle and the H4 demand barrier seen just below it at 0.7475-0.7487. If price manages to pullback and test either of these barriers we feel, given the higher-timeframe picture and the recent break above H4 supply at 0.7568-0.7549 (sellers weakened), a long from one of these levels is valid. However, seeing as how it’s difficult to know which one will react, if any, our team requires that price print at least a H4 bullish candle before we consider these zones tradable. In addition to this guys, do keep in mind that at 2.30am GMT today we have the RBA minutes taking the limelight so do remain vigilant around this time!
Levels to watch/live orders:
- Buys: 0.75 region [H4 bullish close required] (Stop loss: beyond the trigger candle). 0.7475-0.7487 [H4 bullish close required] (Stop loss: beyond the trigger candle).
- Sells: Flat (Stop loss: n/a).
USD/JPY:
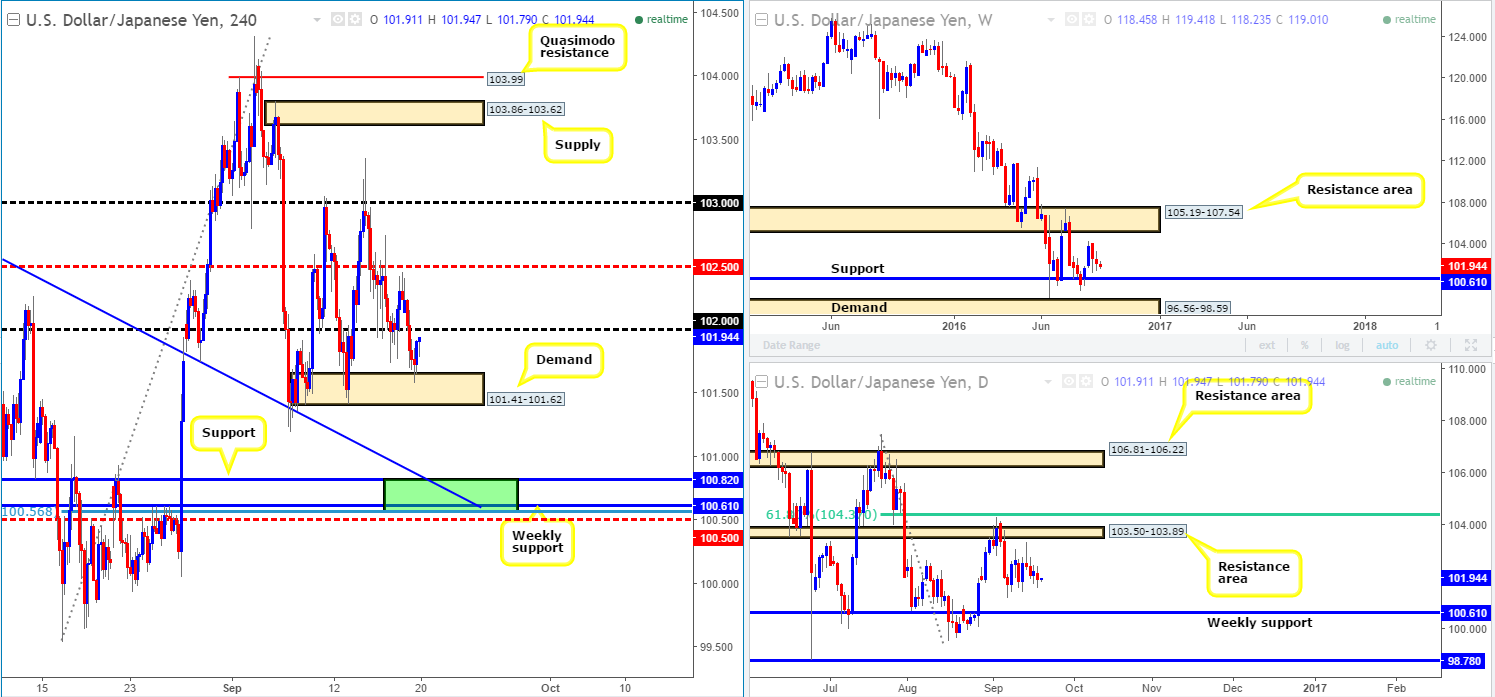
During the course of yesterday’s sessions the USD/JPY sold off, consequently taking out the 102 handle and testing active bids around a H4 demand seen at 101.41-101.62. Although price is currently bid from this zone right now, both the weekly and daily charts suggest price is potentially heading southbound to test weekly support coming in at 100.61.
Should our analysis turn out to be correct and price does indeed push on lower, today’s spotlight will then firmly be focused on 100.61/100.82 (the weekly support at 100.61 and a H4 support at 100.82 [green rectangle]). This area also includes a H4 78.6% Fib support at 100.56, a H4 trendline support extended from the high 102.65 and a nearby H4 mid-way support at 100.50. In view of the confluence seen here, our team would, dependent on time of day, look to enter long from this zone at market with a stop planted below at 100.47.
Levels to watch/live orders:
- Buys: 100.61/100.82 [dependent on the time of day, a long from here without confirmation is possible] (Stop loss: 100.47).
- Sells: Flat (Stop loss: n/a).
USD/CAD:
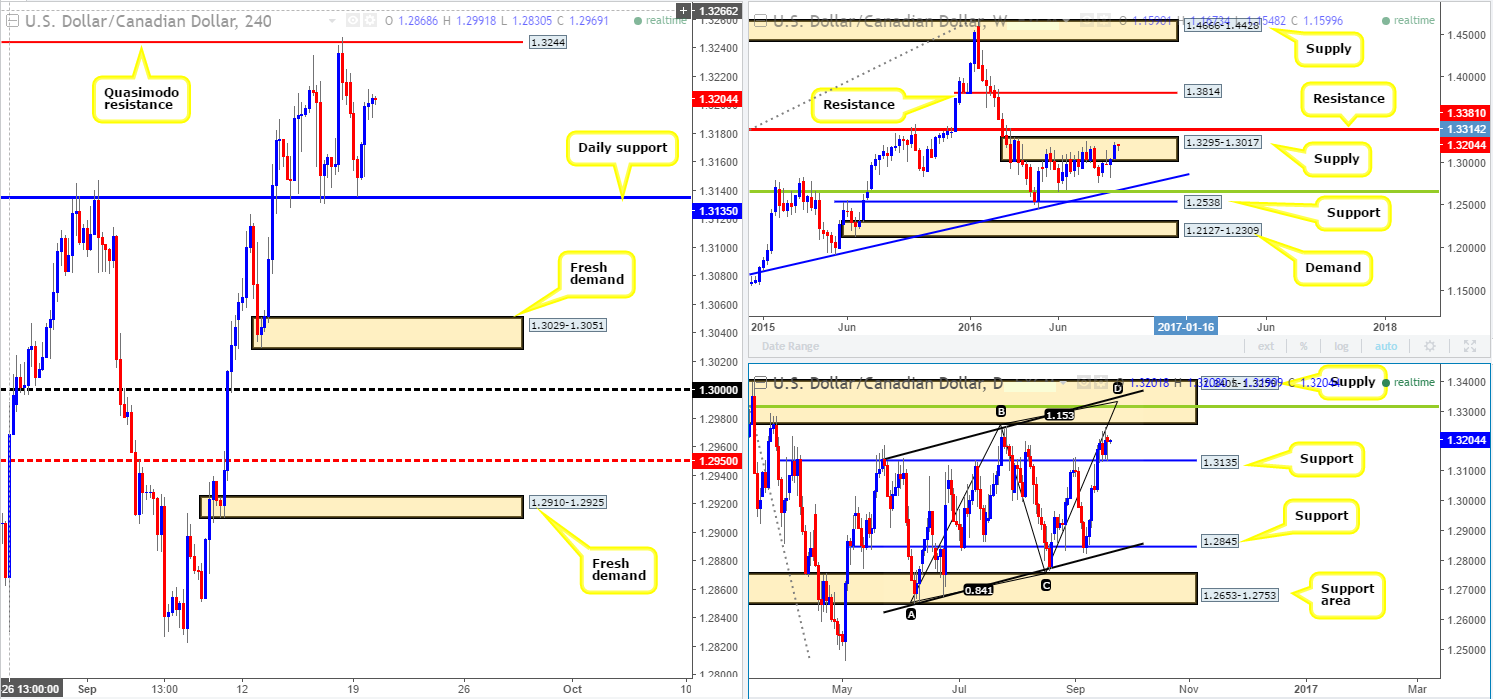
After sharply dropping from Sunday’s opening candle, the USD/CAD found a floor of bids around 1.3135: a daily support hurdle, which saw prices rotate to the upside and end the day within 6 pips of Friday’s closing point. With this, the pair is currently seen trading mid-range between the aforementioned daily support level and a H4 Quasimodo resistance barrier coming in at 1.3244.
With weekly action still inhabiting the upper limit of a supply zone at 1.3295-1.3017, prices could revert to the downside at any time. Despite this, the story on the daily chart reveals that the unit remains bid from the above noted daily support and could potentially push prices north to test supply at 1.3405-1.3259.
Our suggestions: Should H4 action close below the current daily support, this could spark a selloff down to a fresh H4 demand area at 1.3029-1.3051. Supported by prices lurking within weekly supply at the moment, we would look to short beyond the daily support line if price retests this boundary as resistance (waiting for a H4 bearish close following the retest is recommended).
In addition to the above, do keep a tab on the 1.33 handle (not seen on the H4 chart). Not only does this number sit within the above said daily supply, it is also positioned nearby a daily convergence point (a 38.2% Fib resistance level at 1.3315 [green line], a weekly resistance level at 1.3381, a channel resistance taken from the high 1.3241 and an AB=CD completion point around the 1.3332ish range). Should price reach the 1.3310/15 region we would have no hesitation (apart from if high-impacting news is scheduled for release) in shorting here at market with stops placed above the daily supply zone at 1.3407.
On a side note guys, do keep in mind that BoC Gov Poloz takes the stage at 5.50pm GMT today, so do expect some volatility around this time!
Levels to watch/live orders
- Buys: Flat (Stop loss: n/a).
- Sells: Watch for price to close beyond daily support at 1.3135 and then look to trade any retest seen thereafter [waiting for a H4 bearish close following the retest is preferred] (Stop loss: beyond the trigger candle). 1.3310/15 region (Stop loss: 1.3407).


