
A note on lower timeframe confirming price action…
Waiting for lower timeframe confirmation is our main tool to confirm strength within higher timeframe zones, andhas really been the key to our trading success. It takes a little time to understand the subtle nuances, however, as each trade is never the same, but once you master the rhythm so to speak, you will be saved from countless unnecessary losing trades. The following is a list of what we look for:
- A break/retest of supply or demand dependent on which way you’re trading.
- A trendline break/retest.
- Buying/selling tails – essentially we look for a cluster of very obvious spikes off of lower timeframe support and resistance levels within the higher timeframe zone.
- Candlestick patterns. We tend to only stick with pin bars and engulfing bars as these have proven to be the most effective.
EUR/USD:
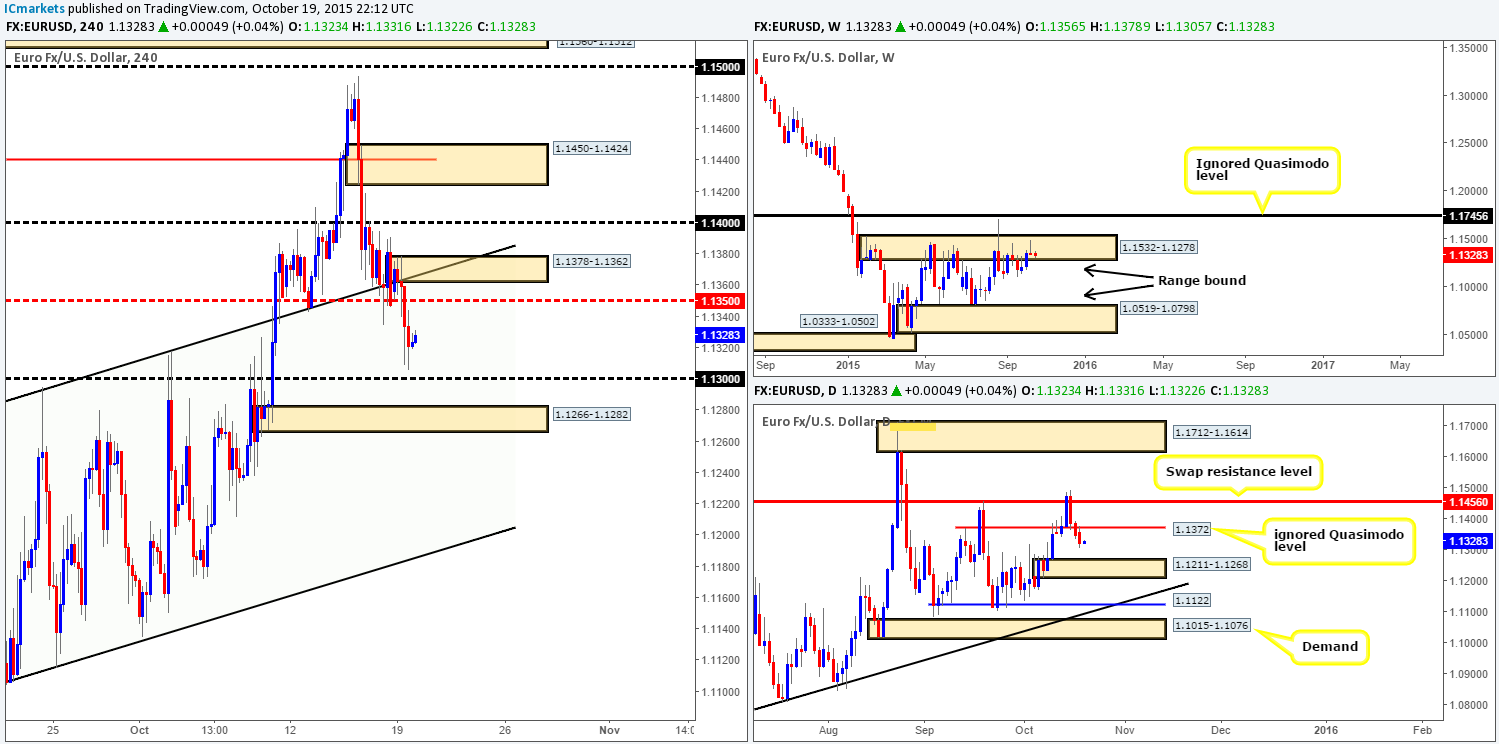
Following the open 1.1356, bids established intraday support above the mid-level number 1.1350, and shortly after a ceiling of offers were seen forming around the 1.1373 mark. It was only once London opened for business did we see things begin to liven up. Strong sellers stepped in and pushed the EUR below 1.1350 and reached lows of 1.1305 on the day.
So, with the above in mind, what do we have here?
- A distinct bearish pin candle formed deep within supply at 1.1532-1.1278 during last week’s trade.This, at least to us, hints a further sell-off may take place this week.
- From the daily chart, we can see that price retested the underside of an ignored Quasimodo level at 1.1372 yesterday. Should the sellers remain in good form below this level, there’s very little reason why this market will not continue to depreciate down to demand sitting at 1.1211-1.1268.
- Since the higher timeframe picture indicates further downside is possible in this market today/this week, we are looking at the following areas to trade short from, targeting 1.1300 as our first take-profit area:
- Mid-level resistance 1.1350. This level was not retested on the 4hr view following yesterday’s break, hence there may be unfilled sell orders still lurking around this barrier (lower timeframe confirmation required).
- Supply at 1.1378-1.1362. This area sits just above 1.1350 and looks not only to be a perfect zone for well-funded traders to fakeout to above 1.1350, it also encapsulates the aforementioned ignored daily Quasimodo level. Stops are likely huddled tightly just above 1.1350. We know this, and so do players who move price! Therefore, be prepared for a fake above 1.1350 (hence confirmation needed at 1.1350 if you intend to short there) into this supply today as it could make for a lovely short trade. We would, dependent on how price approached this zone and the time of day, likely be confident enough to enter at market here, given its location.
Levels to watch/live orders:
- Buys: Flat (Stop loss: N/A).
- Sells:1.1350 [Tentative – confirmation required] (Stop loss: dependent on where one confirms this level) 1.1358 (Stop loss: 1.1380).
GBP/USD:
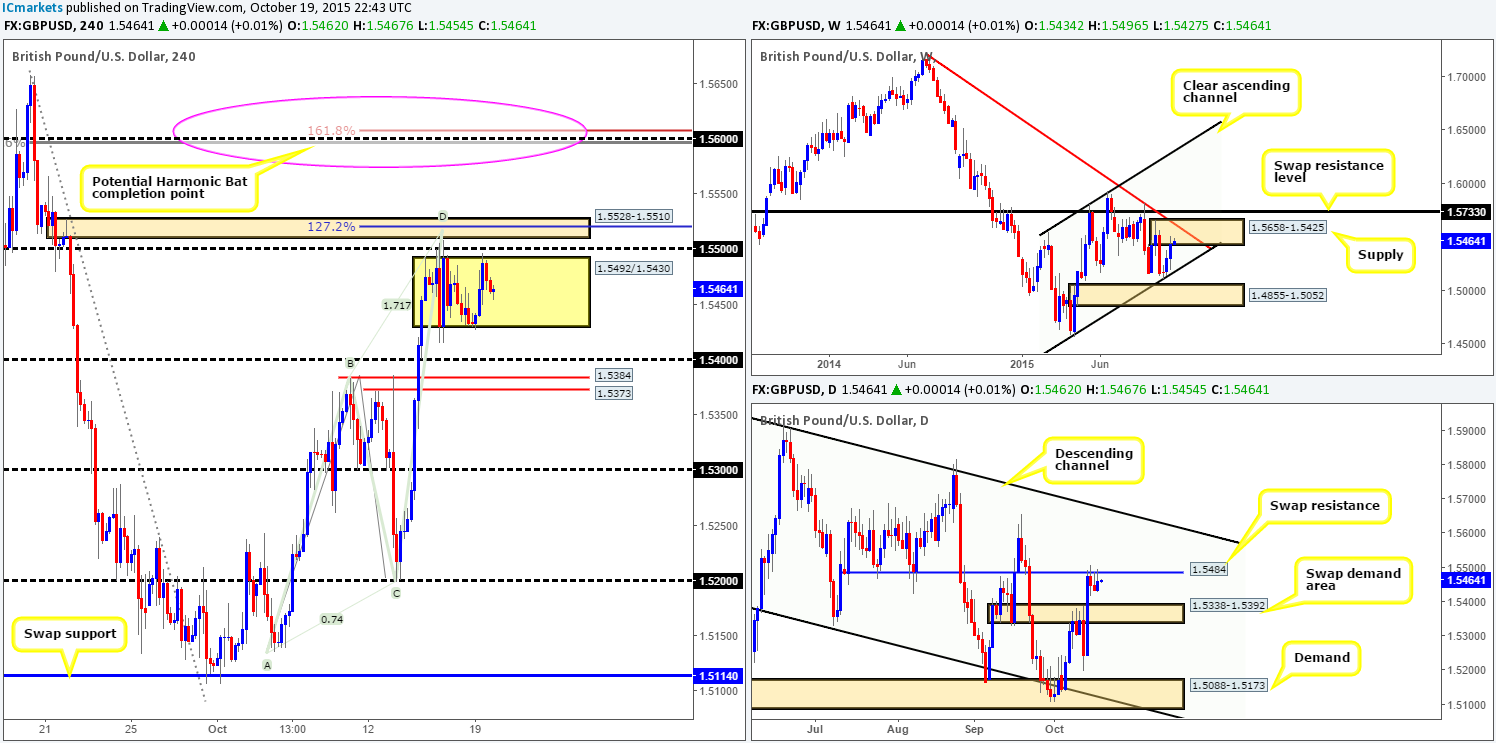
For those who read our previous report (http://www.icmarkets.com/blog/monday-19th-october-weekly-technical-outlook-and-review/), you may recall that our team went short at 1.5506. 50% of our position was locked in at 1.5434 and the stop placed at breakeven. As you can see, price has yet to hit our breakeven stop, so we’re still in game. For how long though is anybody’s guess.
As of now, Cable has entered into a phase of consolidation between 1.5492/1.5430 and is currently trading mid-range. A push above this range sees immediate resistance from 1.5500, followed closely by supply at 1.5528-1.5510, which, as you can see, boasts an AB=CD correction point within. Conversely, a push below this range would likely open the doors for further downside towards psychological support 1.5400.
Given the above, where do we see this market headed today/this week? Well, considering weekly action is loitering within supply at 1.5658-1.5425, and the daily chart shows price nibbling at the underside of a swap resistance level at 1.5484, we still favor a sell-off in this market. That being the case, this is what we have logged so far:
- Price could just as well continue to sell-off from current prices and break below the range and hit 1.5400. This would not provide a selling opportunity but would be great for our live short trade as 1.5400 is our next take-profit area.
- A rally may be seen and price could very well fakeout above the range, and hit 1.5500 and sell-off. This could provide traders a level to sell into this market from (confirmation required).
- Finally, we left the best till last. A fake above both the consolidation and 1.5500 into supply at 1.5528-1.5510 would be great, since a ton of buy stops would be collected and could be used as liquidity to sell into. Of course, this would take us out of current position at breakeven, but, in turn, it would open up the possibility to another short.
Levels to watch/ live orders:
- Buys: Flat (Stop loss: N/A).
- Sells: 1.5506 [LIVE] (Stop loss: Breakeven) 1.5500 [Tentative – confirmation required] (Stop loss: dependent on where one confirms this level) 1.5528-1.5510 [Tentative – confirmation required] (Stop loss: dependent on where one confirms this area).
AUD/USD:
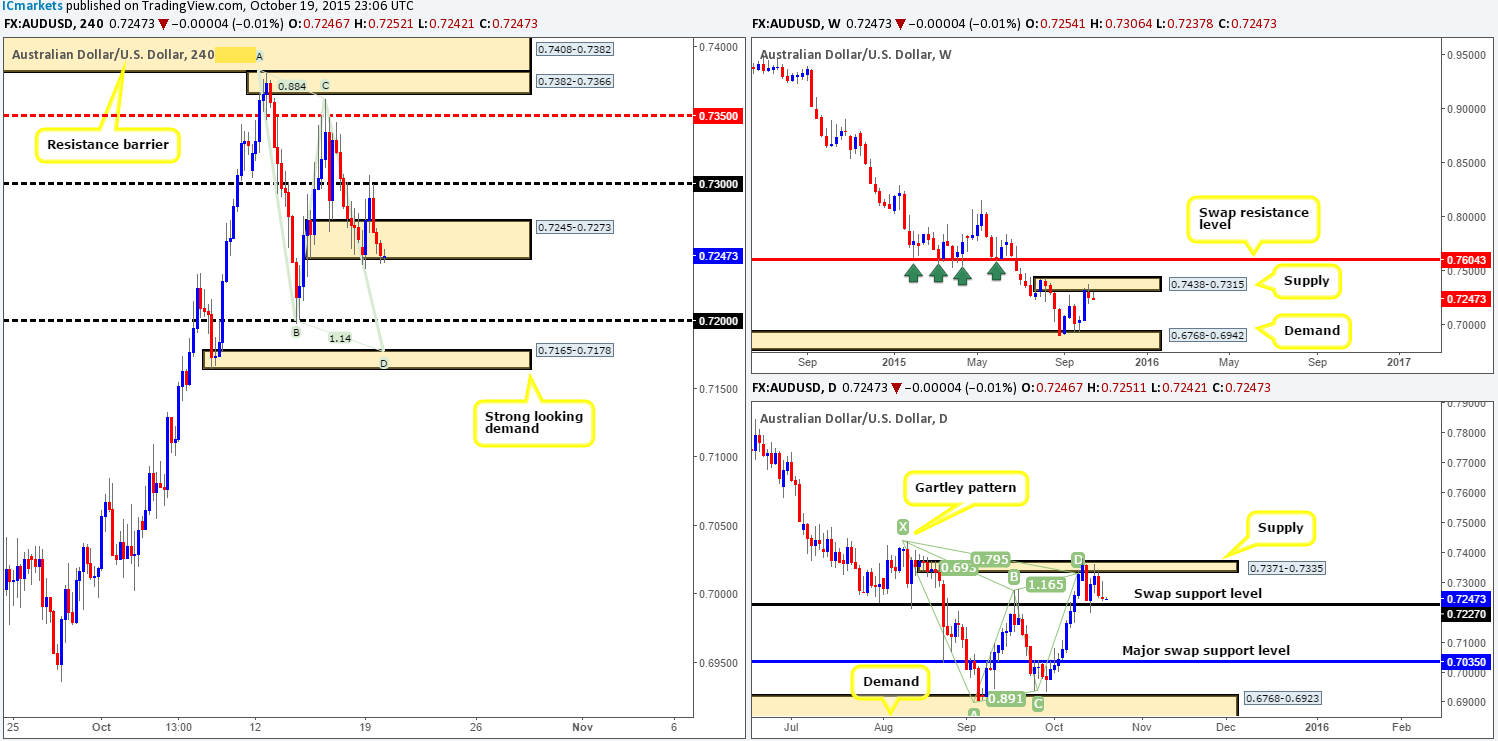
This morning’s analysis will kick-off with a look at the weekly picture, which shows price currently respecting supply at 0.7438-0.7315. On the other side of the ledger, daily action also shows price has been loitering around supply at 0.7371-0.7335, which coincides nicely with a Harmonic Gartley sell zone positioned just within. However, for the sellers to be able to push this pair lower this week, bids around the swap support level at 0.7227 will need to be taken out. The path, at least from this timeframe, will then likely be clear all the way down to a major swap support level at 0.7035.
Turning our attention to the 4hr timeframe reveals a heavy surge of bids came into the market yesterday following a small fake below demand at 0.7245-0.7273. This move consequently pushed the Aussie up to psychological resistance 0.7300, which was clearly a well-offered area as price tumbled back down to yesterday’s open by the days end.
With the above in mind, we believe the Aussie is likely headed lower today. As such, here are the areas we’ll be watching during today’s sessions:
- Should the current demand area be taken out today, we may, dependent on if price retests this area as supply and shows some form of lower timeframe selling confirmation, look to jump in short targeting 0.7200 first and foremost.
- Psychological support at 0.7200 could be a potential buy zone today, seeing as it lurks below the aforementioned daily swap (support) level. However, we would only trade this barrier with lower timeframe confirming price action as price could very easily fake lower here to connect with bids sitting around demand at 0.7165-0.7178.
- And this brings us nicely to our third area, demand at 0.7165-0.7178. Not only is this a strong-looking demand zone, it also boasts an AB=CD correction point at the top-side of this area.
All areas noted above require lower timeframe confirmation for us to trade, specifically the buy zones. Let’s not forget that even though these areas sit relatively close to a daily swap support, price is currently reacting to weekly supply right now (see above), so do trade cautiously!
Levels to watch/ live orders:
- Buys:0.7200 [Tentative – confirmation required] (Stop loss: dependent on where one confirms this level) 0.7165-0.7178 [Tentative – confirmation required] (Stop loss: dependent on where one confirms this area).
- Sells: Watch for bids at 0.7245-0.7273 to be consumed and look to enter on any retest seen at this area (confirmation required).
USD/JPY:
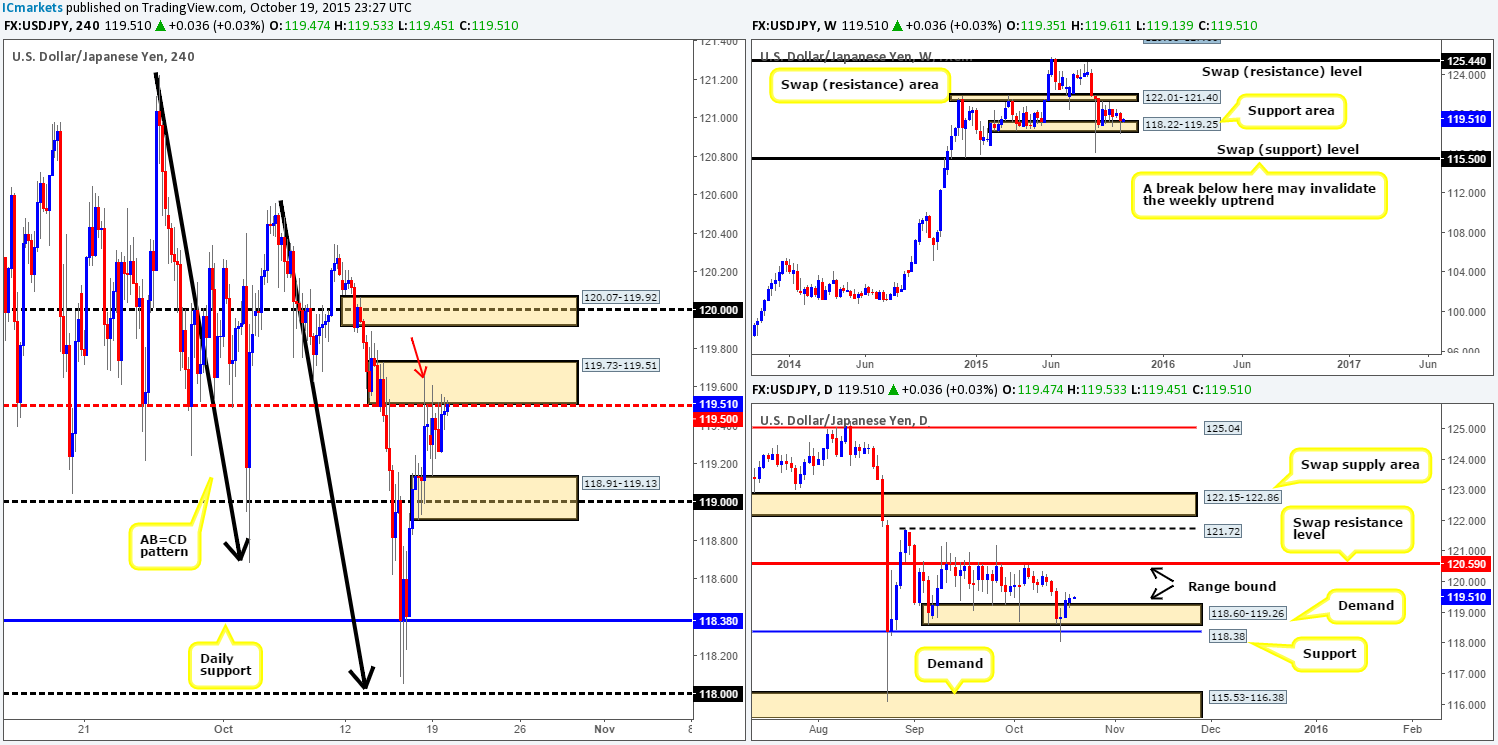
Yesterday’s action was relatively quiet compared to Friday’s surge of buyingenergy. Price remained confined between supply at 119.73-119.51 and demand drawn from 118.91-119.13.
Given the above and the fact that price has recently rebounded from both weekly and daily range demand areas (118.22-119.25/118.60-119.26), our bias certainly sways more the long side of this market at the moment. Ultimately, however, the only possible entry levels we see are on the break and retest of the mid-level number 119.50 as support, or a retracement back down to demand at 118.91-119.13.
The reason for selecting 119.50 as a possible level to buy from when price is positioned within supply at 119.73-119.51 comes from the spike/wick seen marked with a red arrow at 119.66. This candle wick drove high into the zone and likely consumed a great deal of offers here, thus potentially weakening this area and clearing the path north up to supply at 120.07-119.92.
Levels to watch/ live orders:
- Buys:118.91-119.13 [Tentative – confirmation required] (Stop loss: dependent on where one finds confirms this area) watch for offers at 119.50 to be consumed and look to enter on any retest seen at this level (confirmation required).
- Sells: Flat (stop loss: N/A).
USD/CAD:
Mid-way through yesterday’s London trade, the bulls were seen aggressively pushing forward from psychological support 1.2900. Offers were taken out at both supply drawn from 1.2948-1.2928, and also at the large psychological resistance 1.3000, which, as you can see, has been retested as support already.
In view of this recent surge, how do things stand on the higher timeframe picture right now? High up on the weekly scale, price is currently trading at an ignored swap Quasimodo level at 1.3014. In line with this, daily action reveals price is trading at supply taken from 1.3074-1.3025.
Taking the above into account, trading this pair long for the time being is out of the question for us no matter how bullish the 4hr timeframe appears. In regard to shorting this market, we have the following levels noted down in our watch list:
- Mid-level resistance 1.3050 (waiting for confirmation is recommended). This barrier has provided adequate support and resistance to this pair over the past couple of months, thus deserving its place here on our list.
- Supply coming in at 1.3074-1.3059. Although this zone is located deep within the above said daily supply, the spike/wick above this area seen marked with a red arrow at 1.3079 is concerning. Therefore, if you’re looking to short this zone, we would still wait for the lower timeframe selling strength before risking capital.
- And finally, we absolutely love the supply area at 1.3134-1.3097. Reason being is because not only does this zone surround a weekly swap (resistance) level at 1.3128, it is also lovely area to facilitate a fakeout. What we mean by this is stops from traders looking to short the aforementioned daily supply area are positioned just below the 4hr supply at 1.3134-1.3097 – an absolutely perfect base of liquidity to short into. We would, dependent on the time and day and how price approaches this zone, likely consider going in short at market here since there is enough confluence to justify such an order in our opinion.
Levels to watch/ live orders:
- Buys:Flat (Stop loss: N/A).
- Sells:1.3050 [Tentative – confirmation required] (Stop loss: dependent on where one confirms this level) 1.3074-1.3059 [Tentative – confirmation required] (Stop loss: dependent on where one confirms this area) 1.3093 (Stop loss: 1.3138).
USD/CHF:
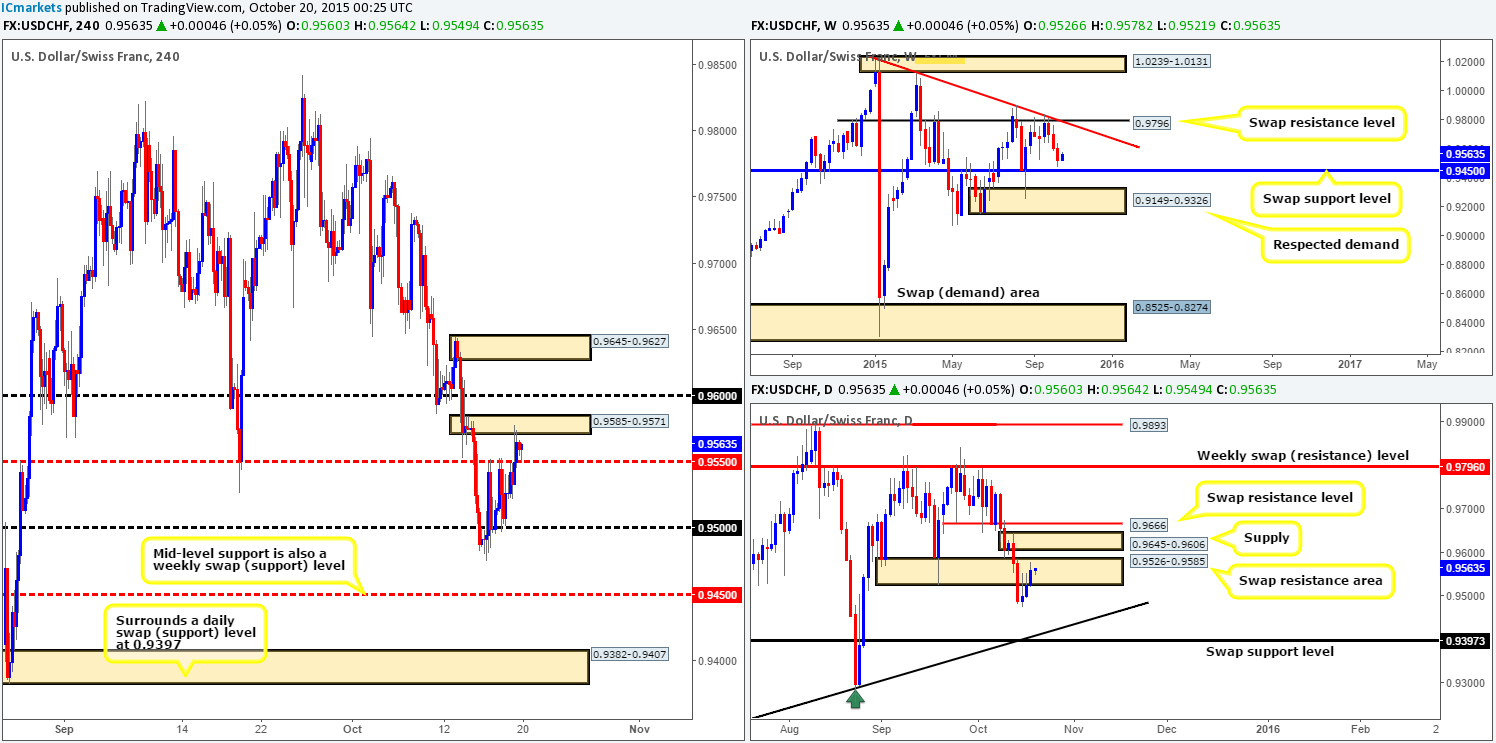
For those of you who read our previous report (http://www.icmarkets.com/blog/monday-19th-october-weekly-technical-outlook-and-review/), you may recall that we mentioned that we would absolutely love to see a fakeout spike above mid-level resistance 0.9550 into the supply at 0.9585-0.9571. As you can see, this did indeed happen during the early hours of London trade. For anyone who did manage to catch a short here, you may likely be panicking now due to supportive pressure being seen above 0.9550 right now. Granted, there is a strong possibility, since bids are clearly interested in defending 0.9550, that price may fake north to psychological resistance 0.9600 (ties in nicely with the underside of daily supply at 0.9645-0.9606), so be extra cautious hereand do not hesitate to close out your position if need be.
With little room seen on the 4hr scale for price to move, and the fact that the weekly is trading from just above a support low 0.9526, thus forcing price to cross swords with the daily swap (resistance) area at 0.9526-0.9585, remaining flat seems the best path to take.
Levels to watch/ live orders:
- Buys: Flat (Stop loss: N/A).
- Sells:Flat (Stop loss: N/A).
DOW 30:
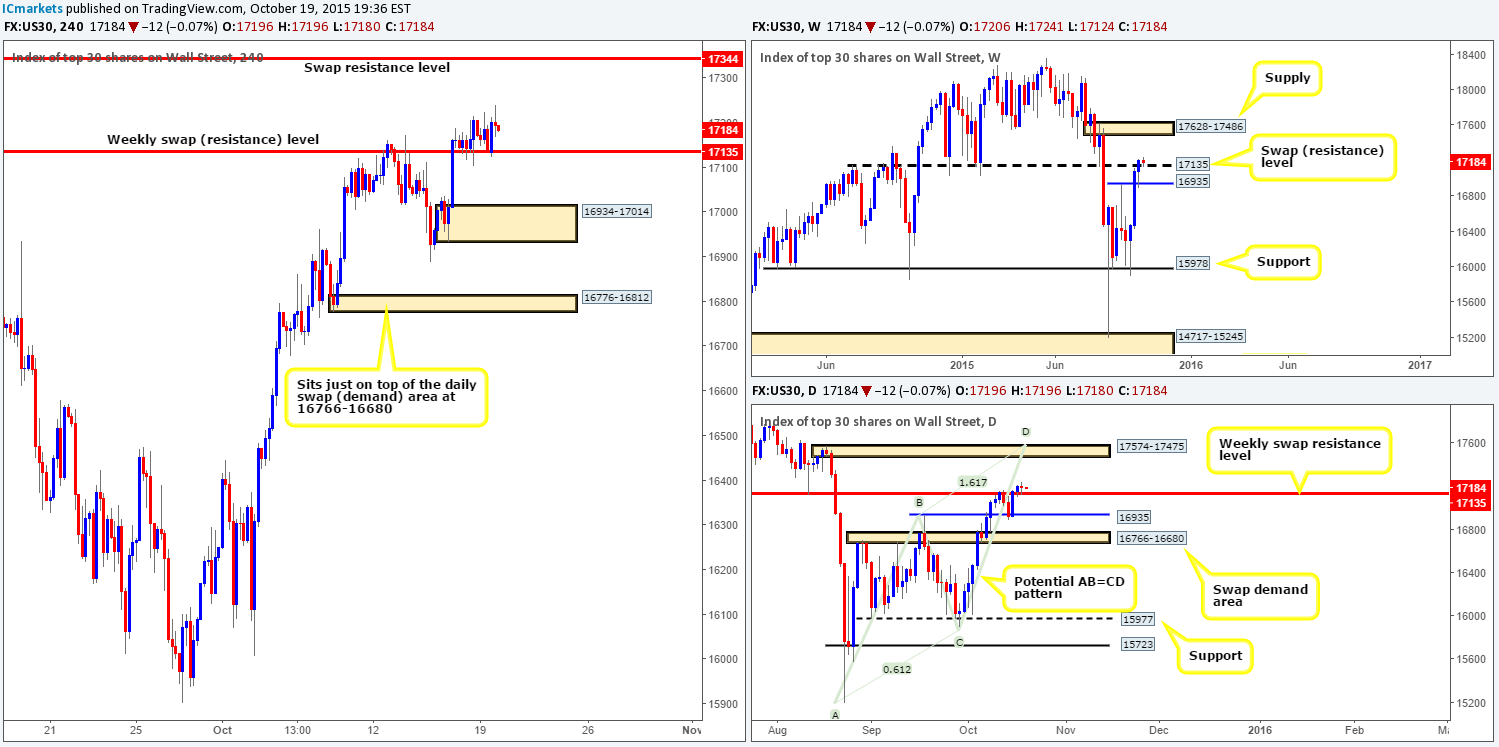
Using a top-down approach this morning the weekly timeframe shows that following last week’s close above the swap resistance level at 17135, price is, at least for the time being, respecting this level as support. From this angle, the next upside target to reach falls in around supply at 17628-17486.
As far as we can see, there is very little difference between the weekly and daily timeframe at the moment. The only two things we see that is more obvious from the daily chart are the target supply and the current approach. Should the buyers manage to hold above the aforementioned weekly swap (resistance) level, the next area of supply to watch comes in a little lower than its weekly counterpart at 17574-17475. Furthermore, there is also a relatively clear Harmonic AB=CD bearish pattern currently forming, completing a few points above the aforementioned daily supply at 17612.
From the 4hr timeframe, we get a clearer view of just how well-bid 17135 is at the moment. As long as the buyers manage to hold prices above this weekly level, there is very little in the way stopping this market from rallying up to at least the swap resistance level at 17344. Beyond that, however, there is a Quasimodo resistance level at 17518, which sits deep within the aforementioned weekly and daily supplies.
Therefore, very similar to yesterday’s plan of attack, we intend to watch for lower timeframe buying confirmation around current price since we were unable to pin-point any lower timeframe buy setups during yesterday’s sessions unfortunately. Should a setup be seen today, we’ll jump in long, and look to take out 50% of our position just below the above said 4hr swap resistance level at around 17320, and then reassess based on how price reacts.
Levels to watch/ live orders:
- Buys: 17135 region [Tentative – confirmation required] (Stop loss: dependent on where one confirms this line).
- Sells:Flat (Stop loss: N/A).
XAU/USD: (Gold)
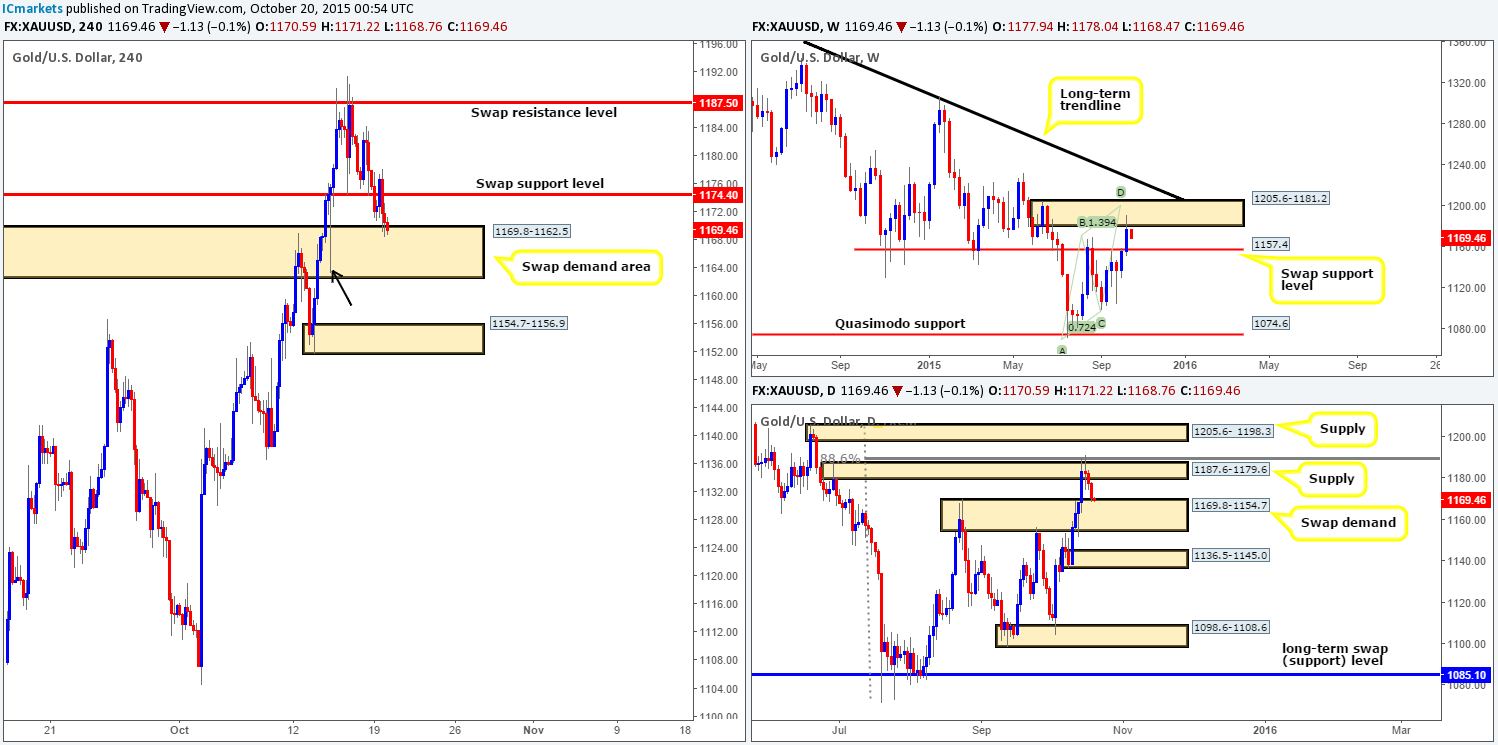
Based on recent price action, Gold is now nibbling at the top-side of a swap demand zone coming in at 1169.8-1162.5. Now, if you cast your mind back to yesterday’s report (http://www.icmarkets.com/blog/monday-19th-october-weekly-technical-outlook-and-review/), you may remember that we highlighted this as an interesting zone to look for buys today/this week due to the following:
- It sits deep within a daily swap (demand) zone seen at 1169.8-1154.7.
- The long buying tail seen marked with a black arrow at 1163.3 suggests this was an area pro money were once interested in buying from (only pro money can collectively form tails of this magnitude) That being the case, there may be unfilled buy orders still lurking within this zone.
However, buying right now is not something we’d label high probability. The swap resistance level at 1174.4 will likely be problematic and considering our stop would need to be placed below the current 4hr swap demand area, the risk/reward would be very unfavorable. Therefore, the zone we’re looking at buying from within this area is actually around the low of the long buying tail mentioned above, thus improving risk/reward dramatically.
Despite this, we mustn’t forget that weekly action could still overrule this 4hr buy zone. Price is currently selling off from weekly supply at 1205.6-1181.2, and has the weekly swap (support) level at 1157.4 to target. This target is positioned below the 4hr swap demand zone, but still within confines of the daily swap demand base mentioned above at point one. As such, for us to consider a buy from here this current 4hr area, we MUST see some form of lower timeframe buying confirmation before we’d feel comfortable risking capital on this idea.
Levels to watch/ live orders:
- Buys:1169.8-1162.5 [Tentative – confirmation required] (Stop loss: dependent on where one confirms this zone since a fake lower could very well take place).
- Sells:Flat (Stop loss: N/A).


