A note on lower timeframe confirming price action…
Waiting for lower timeframe confirmation is our main tool to confirm strength within higher timeframe zones, andhas really been the key to our trading success. It takes a little time to understand the subtle nuances, however, as each trade is never the same, but once you master the rhythm so to speak, you will be saved from countless unnecessary losing trades. The following is a list of what we look for:
- A break/retest of supply or demand dependent on which way you’re trading.
- A trendline break/retest.
- Buying/selling tails – essentially we look for a cluster of very obvious spikes off of lower timeframe support and resistance levels within the higher timeframe zone.
- Candlestick patterns. We tend to only stick with pin bars and engulfing bars as these have proven to be the most effective.
EUR/USD:
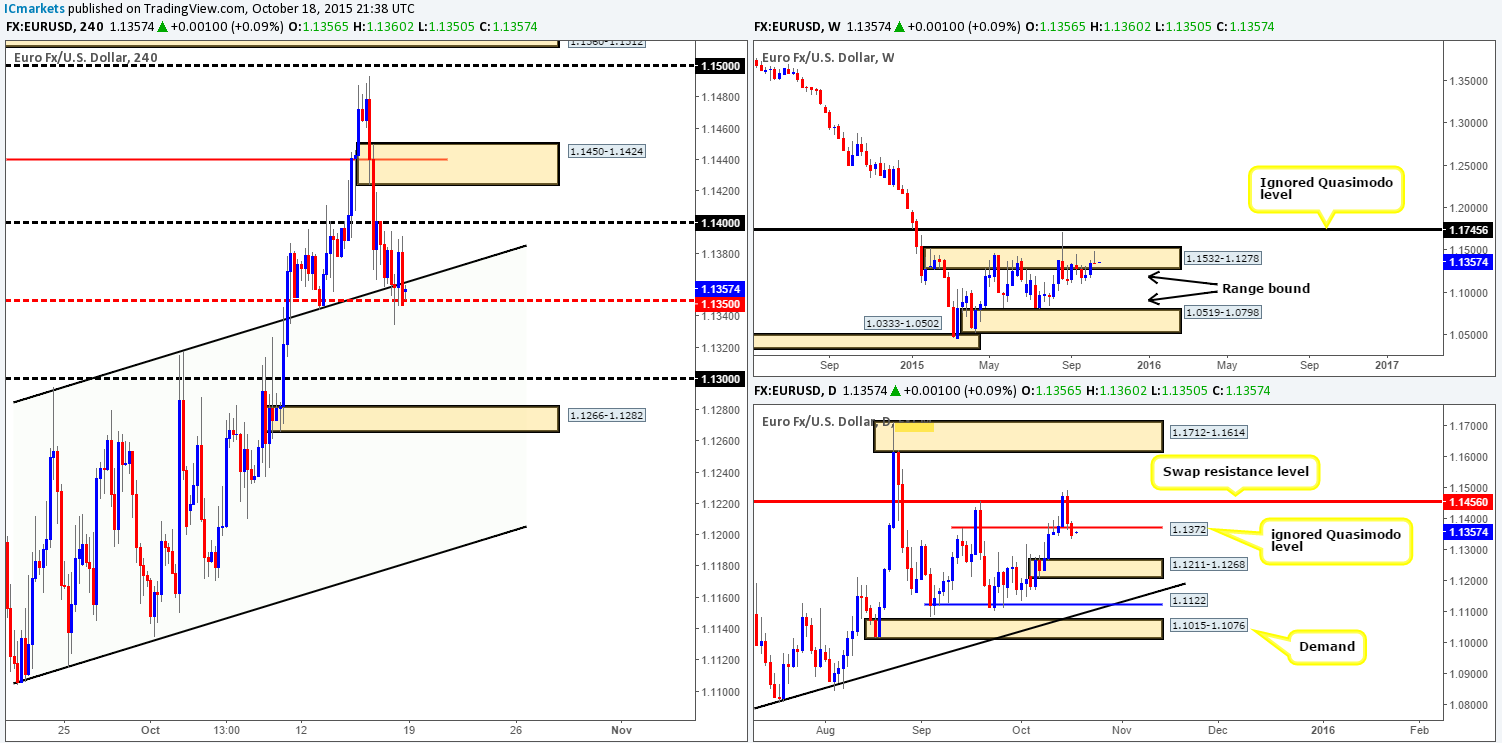
Weekly view:The EUR/USD pair, as you can see, remained relatively unchanged at the close 1.1347. In spite of this, price did in fact stamp in a distinct bearish pin candle deep within supply at 1.1532-1.1278 during last week’s trade. This, at least to us, hints a further sell-off may take place this week deeper into the weekly range, possibly down as far as demand coming in at 1.0519-1.0798. Should price break above the current supply zone in the coming week, however, the next objective to reach can be seen at 1.1745 – an ignored Quasimodo level.
Weekly levels to watch this week fall in at:1.1532-1.1278/1.0519-1.0798/1.1745.
Daily view:On the other side of the spectrum, we can see that daily action sold-off on Thursday from a swap resistance level drawn at 1.1456. As a result, price attacked and eventually closed below an ignored Quasimodo level at 1.1372. As long as the sellers remain in good form below this level this week, there is very little reason why this market will not continue to depreciate down to demand sitting at 1.1211-1.1268.
Daily levels to watch this week fall in at: 1.1456/1.1372/1.1211-1.1268.
4hr view:Moving down on to the 4hr timeframe shows us that Friday’s trade saw relatively little movement going into the close. The most we managed to take away from this action was that price closed back into the upward channel (1.1104/1.1294) as well as below mid-level support 1.1350.
The open 1.1356, however, saw price jump eight pips higher from Friday’s close, consequently placing this market back above mid-level support 1.1350. Despite this, our team is stillrelatively confident the EUR is likely headed south. For us to be confident to pull the trigger here though, a close below and confirmed retest of 1.1350 as resistance will be required before we consider committing capital to this trading idea. Should this come to fruition, we’ll be eyeing psychological support 1.1300 as our immediate take-profit area, followed closely by demand seen at 1.1266-1.1282 (sits on top of daily demand mentioned above at 1.1211-1.1268).
Levels to watch/live orders:
- Buys: Flat (Stop loss: N/A).
- Sells:Watch for bids at 1.1350 to be consumed and look to enter on any retest seen at this level (confirmation required).
GBP/USD:
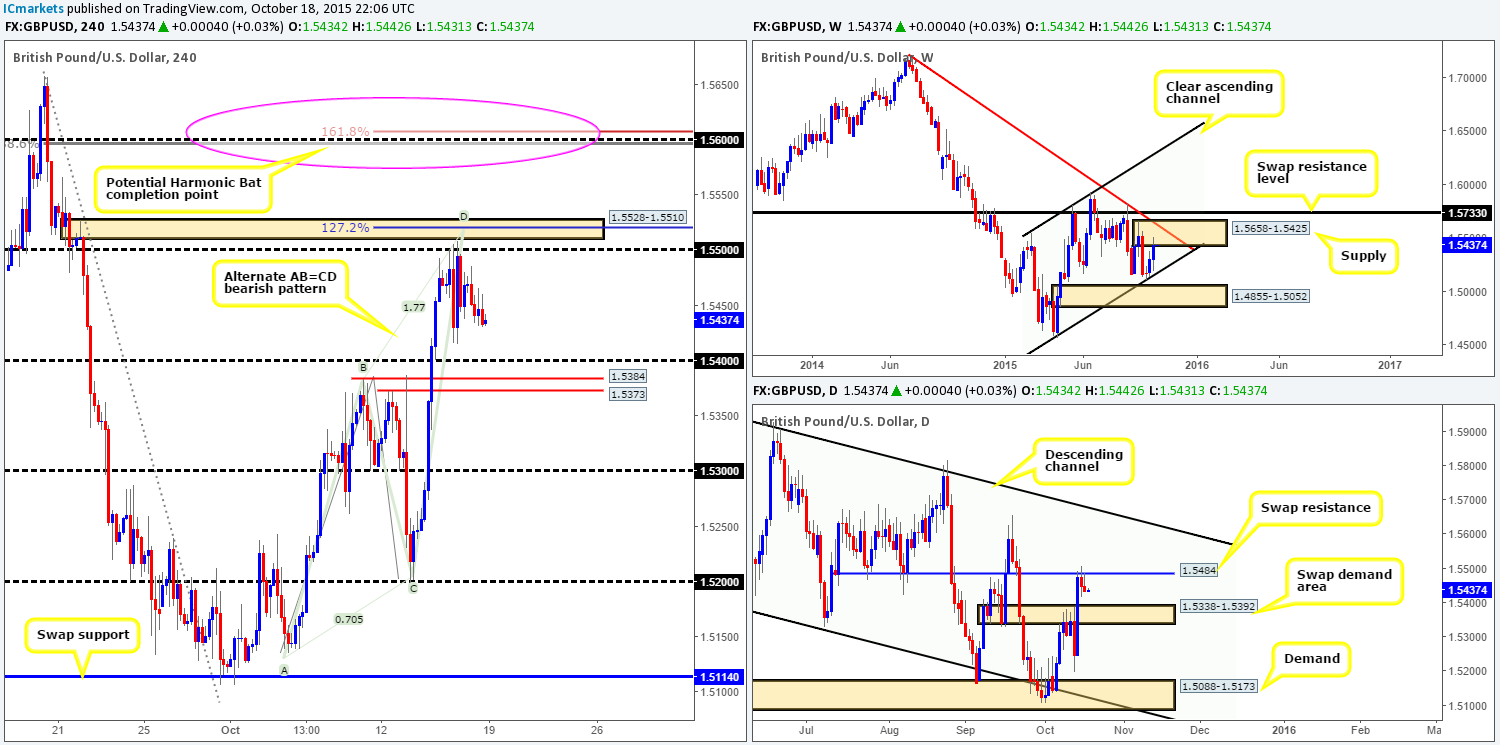
Weekly view:The GBP/USD edged higher last week gaining around 130 pips in value at the close 1.5433. Consequent to this, price connected with the underside of supply formed from 1.5658-1.5425. This area – coupled with trendline resistance from the high 1.7190 and swap level resistance just above at 1.5733 is certainly a zone to keep an eye on this week for potential shorts. A decline from current price, as far as we see, only has around 200 pips of free space below to move down to channel support extended from the low 1.4586. It will be interesting to see what the lower timeframes have to offer…
Weekly levels to watch this week fall in at:1.5658-1.5425/Trendline resistance (1.7190)/ 1.5733/ Channel support (1.4586).
Daily view:In line with the weekly timeframe, we also see that price held firm at the underside of a swap resistance level coming in at 1.5484 from Wednesday’s close (1.5474) onwards. The next downside target to keep a tab on from here comes in around a swap demand base at 1.5338-1.5392. In the event that this demand area is taken out this week, Last Tuesday’s low 1.5199, followed closely by demand at 1.5088-1.5173 will be the next hurdles to watch.
Daily levels to watch this week fall in at: 1.5484/1.5338-1.5392/1.5199/1.5088-1.5173.
4hr view:Like its bigger brother, the EUR/USD, the GBP/USD was also rather slow during Friday’s sessions. Price traded from highs of1.5486 reaching as low as the 1.5430 mark on the day.
With little change seen going into this morning’s open 1.5434, much of our previous analysis still holds firm. For those who read our last report on Cable (http://www.icmarkets.com/blog/friday-16th-october-daily-technical-outlook-and-review/), you may recall that we still have 50% of our position left running in the market from our short taken at 1.5506 and our stop firmly positioned at breakeven. Our team continues to eye psychological support 1.5400 to take further profits, and judging by what the higher timeframes are suggesting (see above) at the moment, this level is likely going to be hit sometime today.
It would be at this point, the 1.5400 figure, that things may become a little trickier however. Note that this number also coincides with the daily swap (demand) base mentioned above at 1.5338-1.5392. Therefore, even with a close seen below 1.5400 today, traders should remain wary not only because of the above said daily demand, but also due to the near-term 4hr swap support barriers positioned just below at 1.5384/1.5373.
On the flip side, should our breakeven stop be hit today, and price continues to advance higher, our team will then be watching to see if price connects with the Harmonic Bat completion point sitting around psychological resistance 1.5600. This, like the current area of supply at 1.5528-1.5510 and its converging structures (see chart), is another strong sell zone in this market.
Levels to watch/ live orders:
- Buys: Flat (Stop loss: N/A).
- Sells: 1.5506 [LIVE] (Stop loss: Breakeven) 1.5600 [Tentative – confirmation required] (Stop loss: dependent on where one confirms this level).
AUD/USD:
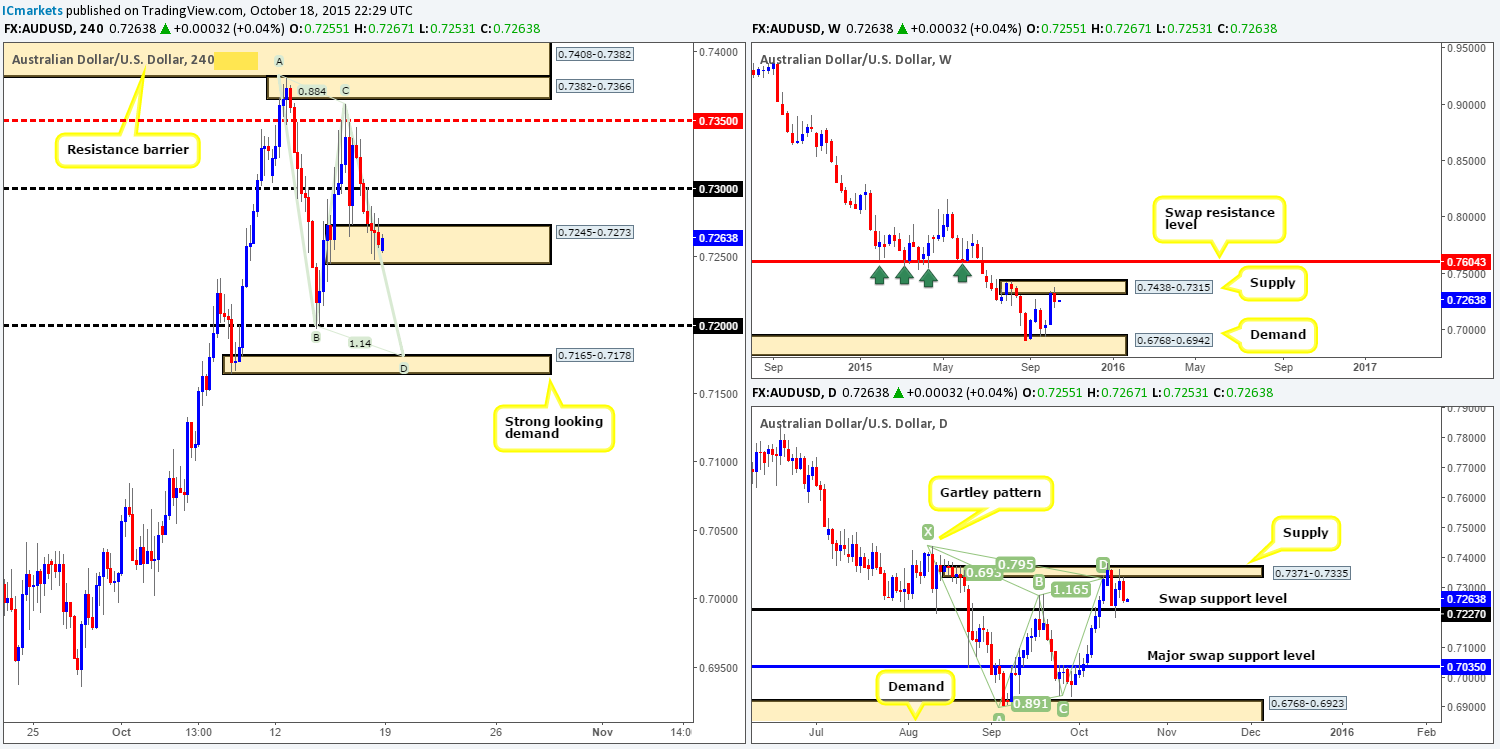
Weekly view:Following the aggressive advance into supply at 0.7438-0.7315 two weeks back, last week’s trade saw a small sell-off from this area tallying in around 70 pips by the close 0.7259. Should the sellers maintain their ground here, we could see this pair continue to depreciate this week. In the event that this area fails to hold, nonetheless, the next zone to keep a tab on comes in at 0.7604 – a clear swap resistance level.
Weekly levels to watch this week fall in at:0.7438-0.7315/0.7604.
Daily view:From this angle the picture becomes a little clearer. Price has been loitering around supply coming in at 0.7371-0.7335, which, as you can see, also boasts a Harmonic Gartley sell zone positioned just within. This – along with the weekly supply zone noted above, forms a strong barrier of resistance in this market. However, for the sellers to be able to push this pair lower this week, bids around the swap support level at 0.7227 will need to be taken out. The path, at least from this timeframe, will then likely be clear all the way down to a major swap support level at 0.7035.
Daily levels to watch this week fall in at:0.7371-0.7335/0.7227/0.7035.
4hr view: As can be seen from this chart, the Aussie took a dive from psychological support 0.7300 on Friday bringing prices back down into demand coming in at 0.7245-0.7273, and this is where price remained trading until the close.
Pushing forward, the open 0.7255 made very little difference to the overall technical position on the 4hr timeframe. We, personally, have absolutely no interest in trying to enter long from the current demand zone today since it has little connection with any higher timeframe structures, and also the fact that psychological resistance is sitting just above it!
With that, we’d much prefer to hunt for longs lower down on the curve this week around psychological support 0.7200; even more so just below this number around demand at 0.7165-0.7178 (Ideally a nice fakeout spike below 0.7200 into this demand would be absolutely perfect). As such, should the current demand area be taken out today, we may, dependent on if price retests this area as supply and shows some form of lower timeframe selling confirmation, look to jump in short targeting the above said buy zones.
The reason for liking 0.7200 and demand at 0.7165-0.7178 as potential buy areas comes from these beauties lining up nicely with the daily swap (support) level mentioned above at 0.7227, and also that fact that the lower demand converges with a bullish AB=CD drive!However, should price reach either of these two zones this week, caution is still advised. Remember, price has only just recently rebounded from weekly supply at 0.7438-0.7315 (see above), which could cause problems to longs from these areas this week. As such, waiting for lower timeframe buying confirmation here is highly recommended.
Levels to watch/ live orders:
- Buys:0.7200 [Tentative – confirmation required] (Stop loss: dependent on where one confirms this level) 0.7165-0.7178 [Tentative – confirmation required] (Stop loss: dependent on where one confirms this area).
- Sells: Watch for bids at 0.7245-0.7273 to be consumed and look to enter on any retest seen at this area (confirmation required).
USD/JPY:
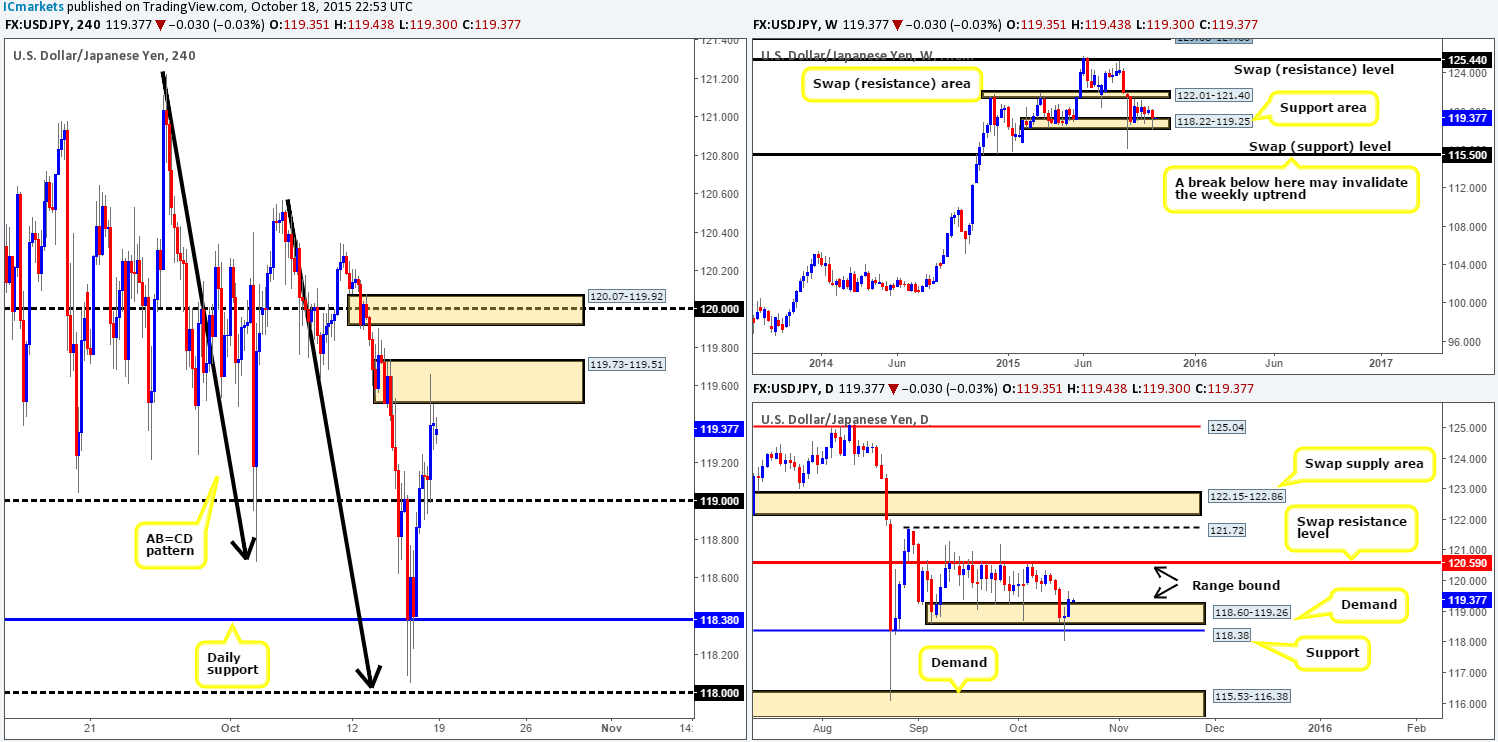
Weekly view: From this angle, we can see that there was a little more action on the USD/JPY last week. Although price still remains range bound between a swap resistance zone at 122.01-121.40 and a support area drawn from 118.22-119.25, there was a slight breach to the downside seen.This subsequently cost the pair close to 80 pips in value into the week’s close 119.40.
Weekly levels to watch this week fall in at:122.01-121.40/118.22-119.25.
Daily view:Similar to its bigger brother (the weekly timeframe), daily action also saw a break lower from its current range between demand at 118.60-119.26 and a swap resistance level at 120.59. However, as you can see, there was effectively no close lower. In fact, price hit bids at a near-term support just below at 118.38 and closed back within the above said demand going into by Thursday’s close 118.86 (forming of a long-legged doji candle) and continued to advance back into the range by the weeks end.
Daily levels to watch this week fall in at: 118.38/118.60-119.26/120.59.
4hr view: Following Thursday’s close above psychological resistance 119.00, price retested this figure going into the early hours of Friday’s European trade and catapulted itself up to supply seen at 119.73-119.51 which held firm into the close.
On the whole, the open 119.35 was steady and shows little activity was seen during the weekend. Therefore, with the current 4hr supply still holding firm, do we think a short, be it confirmed or a touch trade (pending order), is worth considering today? In our opinion, one could look to trade this area for an intraday (confirmed) bounce back down to the 119.00 region, but be aware that price has recently rebounded from both weekly and daily range demand areas (see above/charts).
As such, we personally have little interest in shorting from the current supply. We are, however, interested in taking a long (should confirmation be seen) from 119.00 if this level hits today for the following reasons:
- The spike seen into current supply at 119.66 was deep and likely consumed a great deal of offers here, thus potentially weakening this zone and clearing the path north up to supply at 120.07-119.92.
- The 119.00 figure sits beautifully within both the weekly and daily lower range limits (see above).
Levels to watch/ live orders:
- Buys:119.00 [Tentative – confirmation required] (Stop loss: dependent on where one finds confirms this level).
- Sells: Flat (stop loss: N/A).
USD/CAD:
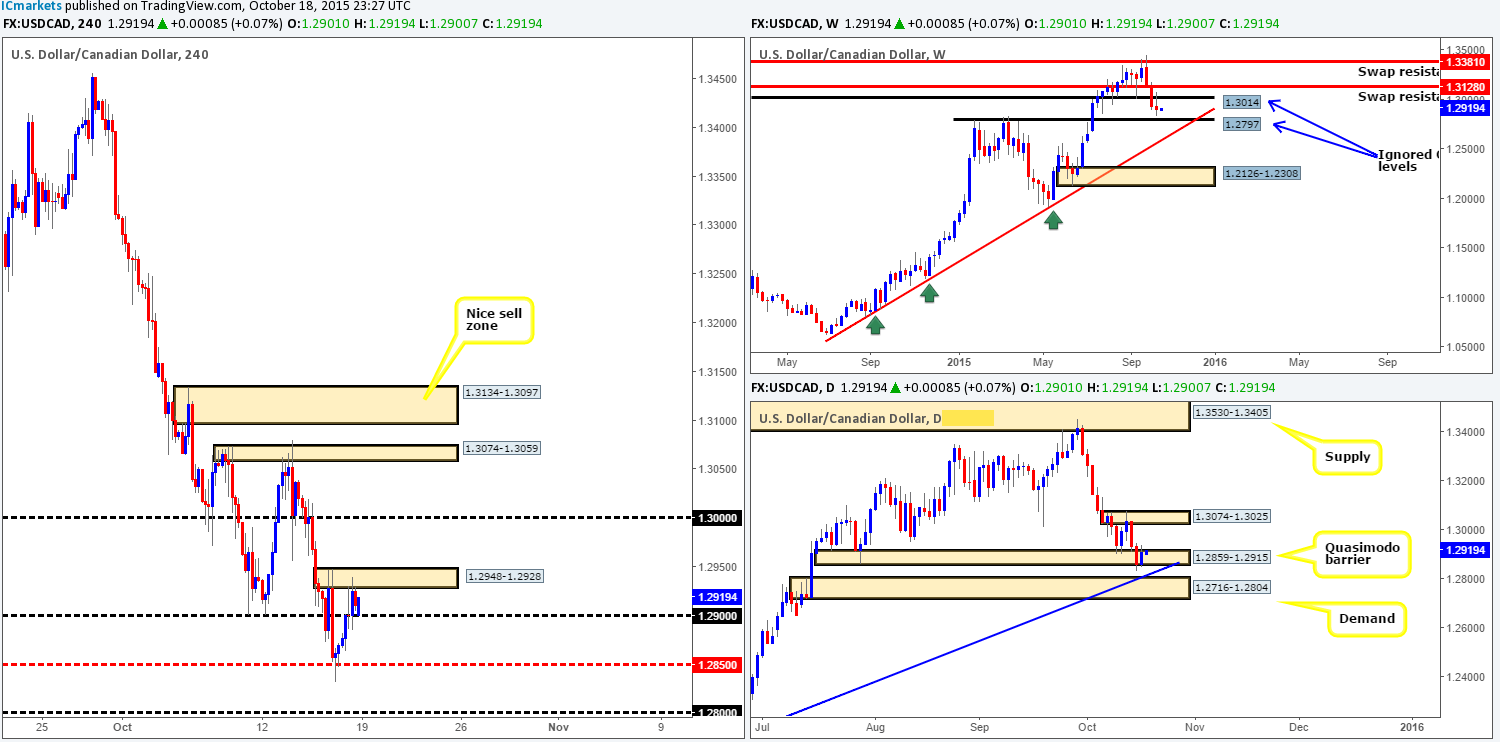
Weekly view:Following the close below the ignored Quasimodo level at 1.3014, we can see that price successfully retested this level as resistance during trade last week. As a consequence, price reached a low of 1.2832 on the week, and just missed connecting with the ignored Quasimodo level at 1.2797 by around 35 pips before slightly pulling back into the close 1.2910.Seeing as price is now effectively trading mid-range between the above said levels, both, in our opinion, are worth keeping an eye on this week as is the near-term swap resistance level above at 1.3128.
Weekly levels to watch this week fall in at: 1.3014/1.2797/1.3128.
Daily view:Zooming in and looking at the daily timeframe reveals that despite the fakeout below the Quasimodo base at 1.2859-1.2915 on Thursday, active buying was seen going into Friday’s session, forming a bullish inside candle pattern. Essentially this timeframe is not much different to the weekly. Should price break below the current Quasimodo base this week, we’ll likely see price tackle demand at 1.2716-1.2804, which, as can be seen from the chart, converges nicely with trendline support from the low 1.1918. In addition, this area also surrounds the ignored weekly Quasimodo line at 1.2797, thus could provide a nice base in which to look for longs from this week.
On the other side of the coin, a rally from the current Quasimodo base will likely see price connect with supply at 1.3074-1.3025. This area sits only eleven pips above the weekly ignored Quasimodo swap level at 1.3014, making this also a zoneto keep an eye on for shorts from this week.
Daily levels to watch this week fall in at:1.2859-1.2915/1.3074-1.3025/1.2716-1.2804.
4hr view:From this angle, it’s clear to see that price rallied beautifully on Friday just above from mid-level support 1.2850, consequently hitting and rebounding from supply at 1.2948-1.2928 by the weeks end.
The open 1.2901 has so far seen a small wave of bids enter the market, consequently establishing intraday support at the 1.2900 figure. Just so that we’re all on the same page here, let’s just quickly outline what we have:
- The weekly is trading mid-range within a relatively tight band (see above in bold).
- Daily action could go either way this week (see above in bold).
- And now, on the 4hr timeframe, we can see price is effectively lodged between the current supply and psychological support 1.2900.
On account of the above, here is how we intend to approach this market today/this week:
- Should 1.2900 see a breach, we’ll watch for price to retest this area and may, dependent on how the lower timeframes respond, take an intraday short down to 1.2850, followed by psychological support 1.2800 given enough time. Final profits will be taken at this barrier considering that 1.2800 ties in with both the top-side of daily demand at 1.2716-1.2804 and the ignored weekly Quasimodo level at 1.2797. 1.2800 continues to besomewhere our team has a great deal of interest in as a base to enter long from.
- In the event that the current 4hr supply is taken out, nonetheless, this would likely stimulate an advance towards the large psychological resistance 1.3000, and possibly, given enough effort from the buyers, the 4hr supply at 1.3074-1.3059 (sits deep within daily supply at 1.3074-1.3025). However, our team has pointed out that they’d only be interested in trading this move if the broken area was retested as demand and displayed some sort of lower timeframe buy signal.
Levels to watch/ live orders:
- Buys:Watch for offers at 1.2948-1.2928 to be consumed and look to enter on any retest seen at this area (confirmation required).
- Sells:Watch for bids at 1.2900 to be consumed and look to enter on any retest seen at this level (confirmation required).
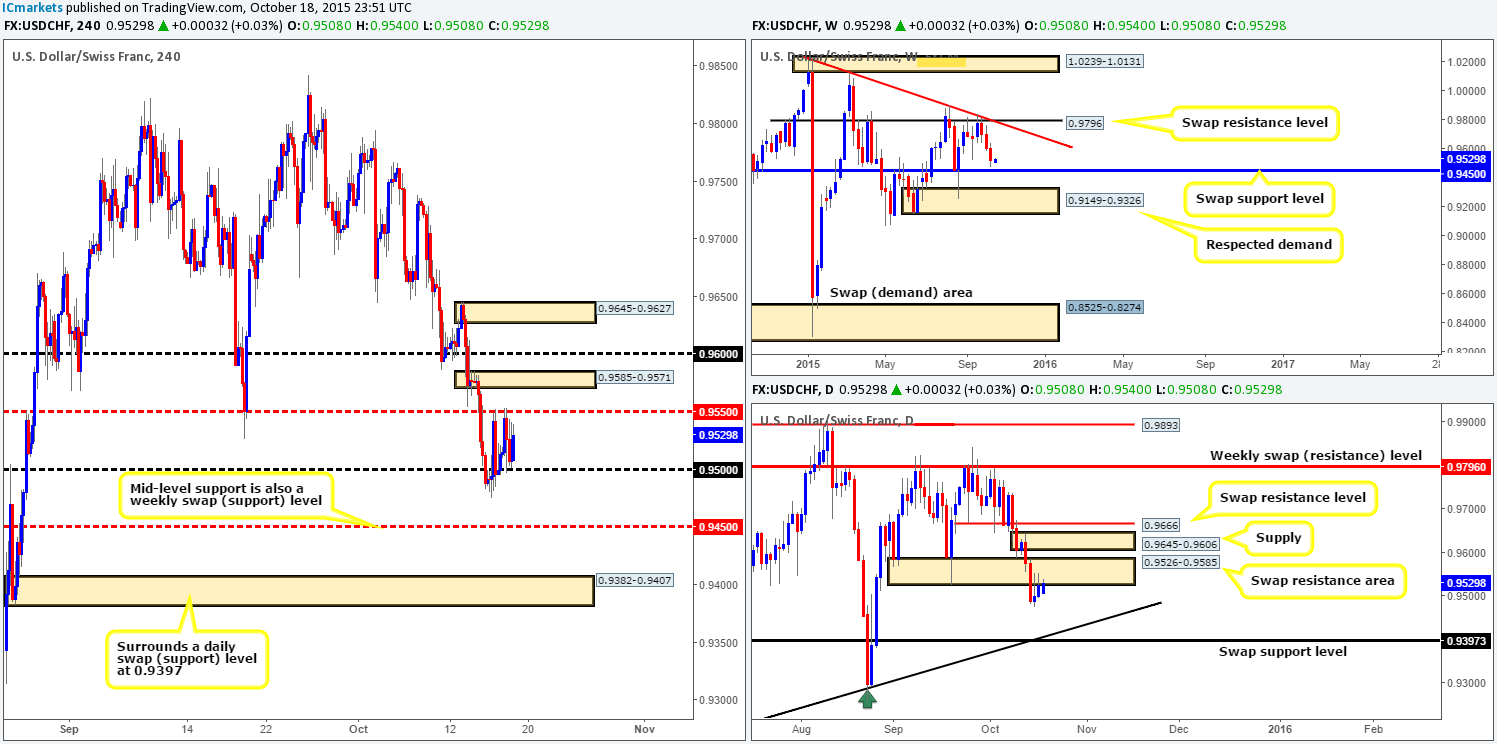
USD/CHF:
Weekly view:The USD/CHF sustained further losses for the third consecutive week, erasing eighty pips off its value at the close 0.9526. What was also interesting about this recent decline was the fact that price closed to-the-pip at a distinct weekly low formed back on the 14/09/15. Should bids fail to hold this level this week, we could see a small run down to the swap support barrier at 0.9450, and maybegiven enough time, demand at 0.9149-0.9326. It will be interesting to see what the lower timeframes have to say on the matter…
Weekly levels to watch this week fall in at: 0.9796/0.9450/0.9149-0.9326.
Daily view:Turning our attention to the daily timeframe reveals that during Wednesday’s trade, price absolutely demolished an area of support coming in at 0.9526-0.9585. By default, this now becomes a valid resistance base, which, as you can see, held prices lower into the weekend. Should offers continue to defend this zone, we see very little support on this timeframe stopping price from attacking the trendline taken from the low 0.9077, followed closely by a swap support barrier at 0.9397.
In the event that the current swap resistance area fails, however, price may rally to connect with offers sitting around supply at 0.9645-0.9606/swap resistance level just above at 0.9666.
Daily levels to watch this week fall in at:0.9526-0.9585/0.9397/0.9645-0.9606/0.9666.
4hr view: From this viewpoint, we can see that price remains confined between mid-level resistance at 0.9550 and psychological support 0.9500 at this morning’s open 0.9508.
In the event price breaks above 0.9550, there is immediate supply to contend with drawn from 0.9585-0.9571. On the other hand, a push below 0.9500 shows there is potential, at least on the 4hr scale,down towards mid-level support 0.9450 (also a weekly swap [support] level), followed by demand sitting at 0.9382-0.9407 (surrounds the daily swap (support) level at 0.9382-0.9407).
However, given the market’s higher timeframe position (see above) right now, and the fact that supply is lurking just above 0.9550, our team has no interest in buying any breakout here. With that being said, we would absolutely love to see a fakeout spike above 0.9550 into the supply today. This, in itself would be a signal to short in our opinion, targeting 0.9500, and all being well, the mid-level support mentioned above in bold, 0.9450.
Levels to watch/ live orders:
- Buys: Flat (Stop loss: N/A).
- Sells:Watch for a fakeout to be seen above 0.9550, and then look to enter with lower timeframe selling confirmation.
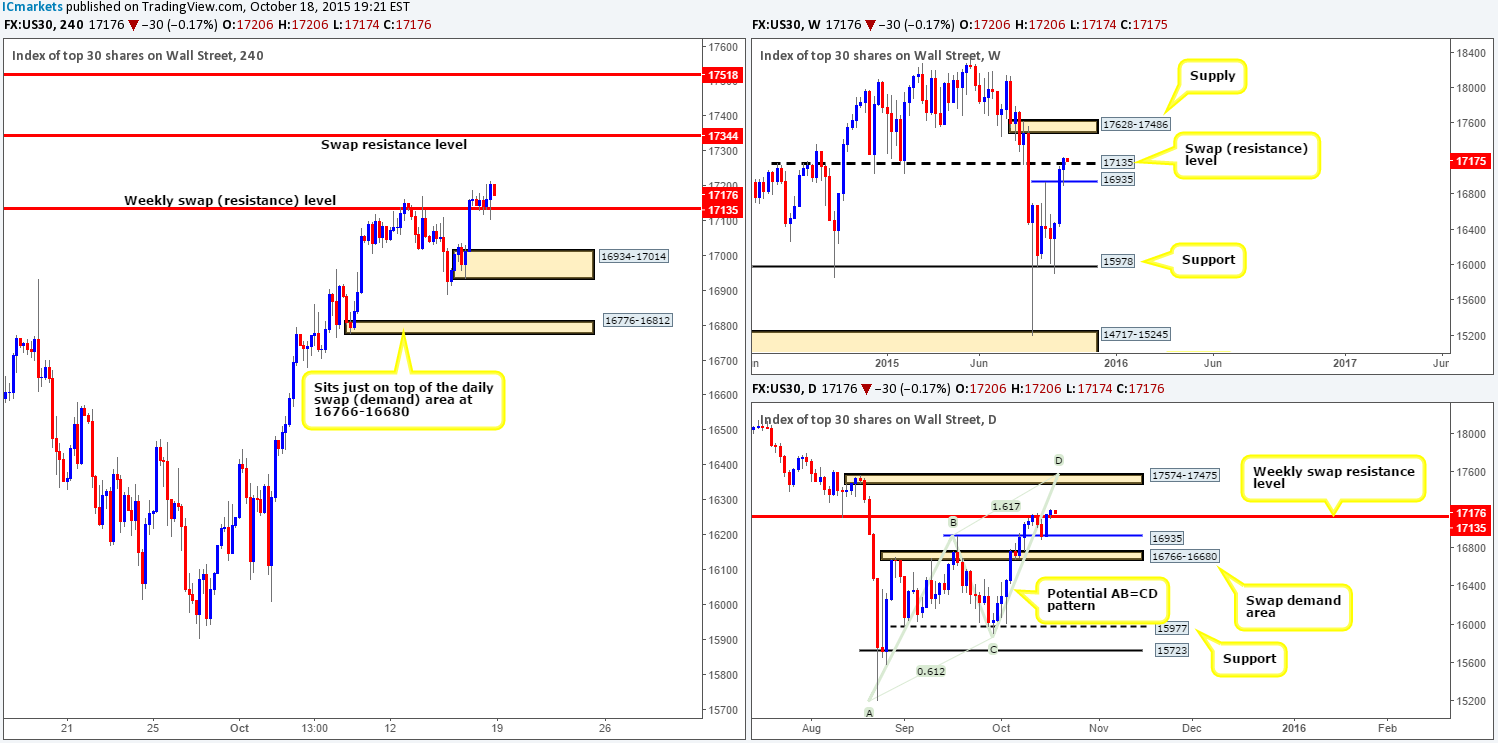
DOW 30:
Weekly view:Consequent to the strong bullish advance two weeks back, price came so very close to hitting a swap resistance level at 17135. Going into last week’s trade, however, we began seeing price react very bearishly to this level, nevertheless, as you can see, it was clearly not to be. Price found support from a broken high coming in at 16935, forcing the DOW to close above this level into the close 17206, gaining a further 120 points in value by the weeks end. Contingent upon the buyers maintaining a position above this number this week, we may see price continue advancing in the direction of supply at 17628-17486.
Weekly levels to watch this week fall in at: 16935/17135/17628-17486.
Daily view:As far as we can see, there is very little difference between the weekly and daily timeframe at the moment. The only two things we see that is more obvious from the daily chart are the target supply and the current approach. Should the buyers manage to hold above the aforementioned weekly swap (resistance) level, the next area of supply to watch comes in a little lower than its weekly counterpart at 17574-17475. Furthermore, there is also a relatively clear Harmonic AB=CD bearish pattern currently forming, completing a few points above the aforementioned daily supply at 17612.
Daily levels to watch this week fall in at: 17135/16935/17574-17475/17612.
4hr view:Friday’s trade was relatively uneventful as far as price movement goes. Nonetheless, support was, at least on this scale, clearly established around the top-side of the weekly swap (resistance) level at 17135. Going forward from this morning’s open 17206, we feel this market is heading higher today/ this week.
As long as the buyers manage to hold prices above the aforementioned weekly level, there is very little in the way stopping this market from rallying up to at least the swap resistance level at 17344. Beyond that, however, there is a Quasimodo resistance level at 17518, which sits deep within the aforementioned weekly and daily supplies.
Therefore, our plan of attack today is simple. Watch for lower timeframe buying confirmation around current price. Should a setup be seen, we’ll jump in long, and look to take out 50% of our position just below the 4hr swap resistance level at around 17320, and then reassess based on how price reacts.
Levels to watch/ live orders:
- Buys: 17135 region [Tentative – confirmation required] (Stop loss: dependent on where one confirms this line).
- Sells:Flat (Stop loss: N/A).
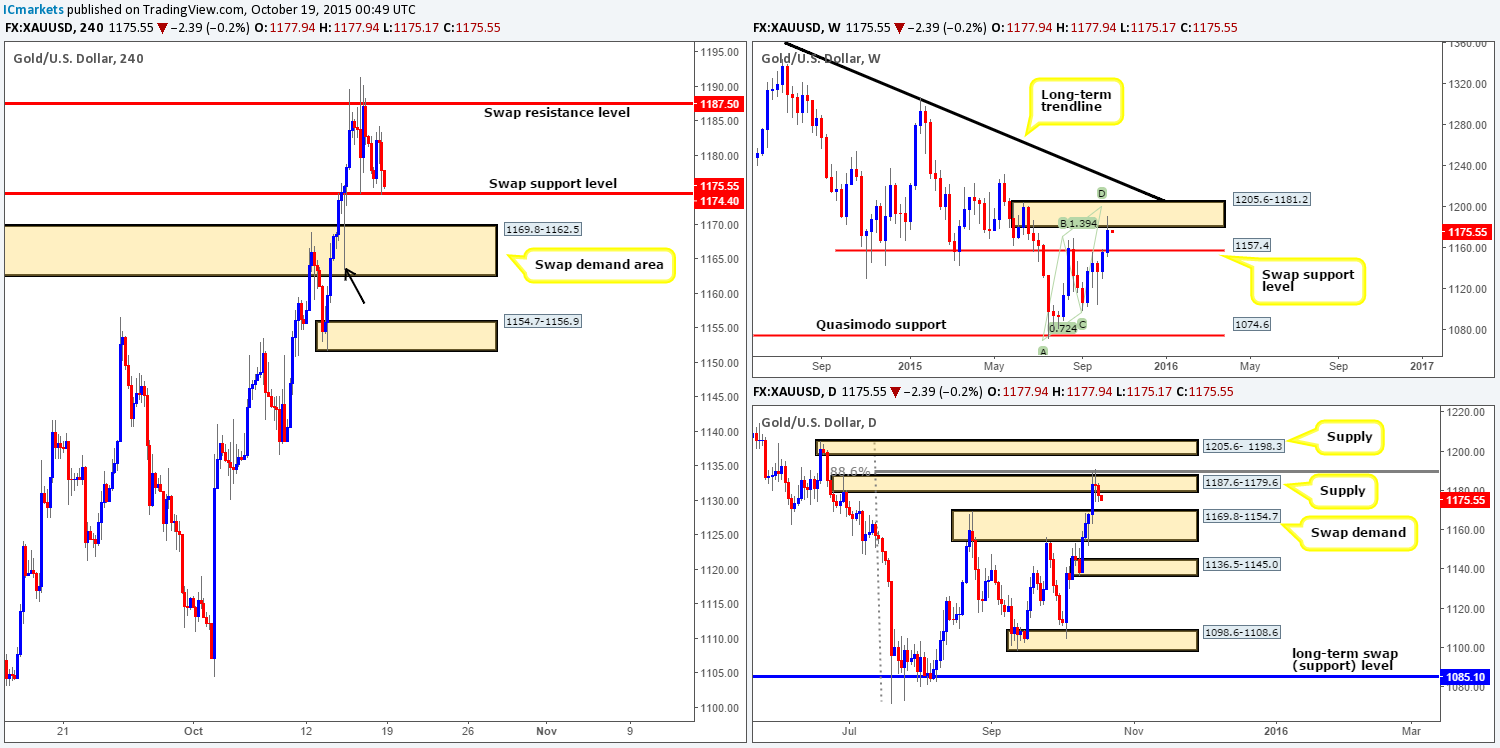
XAU/USD: (Gold)
Weekly view:As can be seen from the weekly chart, there was little to no selling interest seen at the underside of 1157.4 at the beginning of last week. As a result, Gold continued to advance gaining a little over $21 in value by the close 1177.9. What is more, this recent surge in buying saw price connect with a weekly supply area drawn from 1205.6-1181.2. This zone, as we mentioned in our previous weekly report, is a perfect barrier to look for shorts back down to 1157.4 – now acting support. It not only converges with a bearish Harmonic AB=CD pattern (1199.4), but also with the underside of a long-term trendline extended from the high 1488.0.
Weekly levels to watch this week fall in at:1205.6-1181.2/1199.4/1157.4.
Daily view:Moving down to the daily timeframe, we can see that price found active offers around the 88.6% Fibonacci resistance level at 1188.8 (just above supply at 1187.6-1179.6). Should active sellers remain positioned here this week, we could see Gold trade lower to test for active bids at the swap demand area seen at 1169.8-1154.7 (surrounds the weekly swap support level at 1157.4). On the other hand, should selling pressure dry up here, price will likely drive higher towards supply at 1205.6- 1198.3 (located DEEP within the above said weekly supply and also ties in beautifully with the weekly bearish Harmonic AB=CD pattern completion point at 1199.4. A beautiful zone to look for shorts!!!
Daily levels to watch this week fall in at: 1188.8/1187.6-1179.6/1205.6- 1198.3/1169.8-1154.7.
4hr view:As we can all see, late in the American afternoon session on Friday price once again tested the swap support level coming in at 1174.4, which held firm. Pushing forward, this morning’s open 1177.9 has so far continued to sell-off, consequently once again hovering just above the above said swap support level.
Seeing as there is clearly an interest in this level from the buy-side of this market here, where do we go from this point forward? Well, there may be an interest in this level, but we do not see it holding for much longer. As we already mentioned above in bold (higher timeframe sections), price is, at least to us anyway, suggesting that it may see a depreciation in value. This could bring Gold down into the jaws of a swap demand area below at 1162.5-1169.8. This barrier is a particularly interesting area to look for buys today/this week due to the following:
- It sits deep within a daily swap (demand) zone seen at 1169.8-1154.7.
- The long buying tail seen marked with a black arrow at 1163.3 suggests this was an area pro money were once interested in buying from (only pro money can collectively form tails of this magnitude) That being the case, there may be unfilled buy orders still lurking within this zone.
As bullish as this zone appears, however, we mustn’t forget that weekly action could still overrule this buy zone. A strong sell-off from weekly supply at 1205.6-1181.2 has, as we mentioned above, the weekly swap (support) level at 1157.4 to target. This is positioned below the 4hr swap demand zone, but still within confines of the daily swap demand base mentioned above at point 1. As such, for us to consider a buy from here this week, we must see some form of lower timeframe buying confirmation before we’d feel comfortable risking capital on this idea.
Levels to watch/ live orders:
- Buys:1169.8-1162.5 [Tentative – confirmation required] (Stop loss: dependent on where one confirms this zone since a fake lower could very well take place).
- Sells:Flat (Stop loss: N/A).