
EUR/USD:
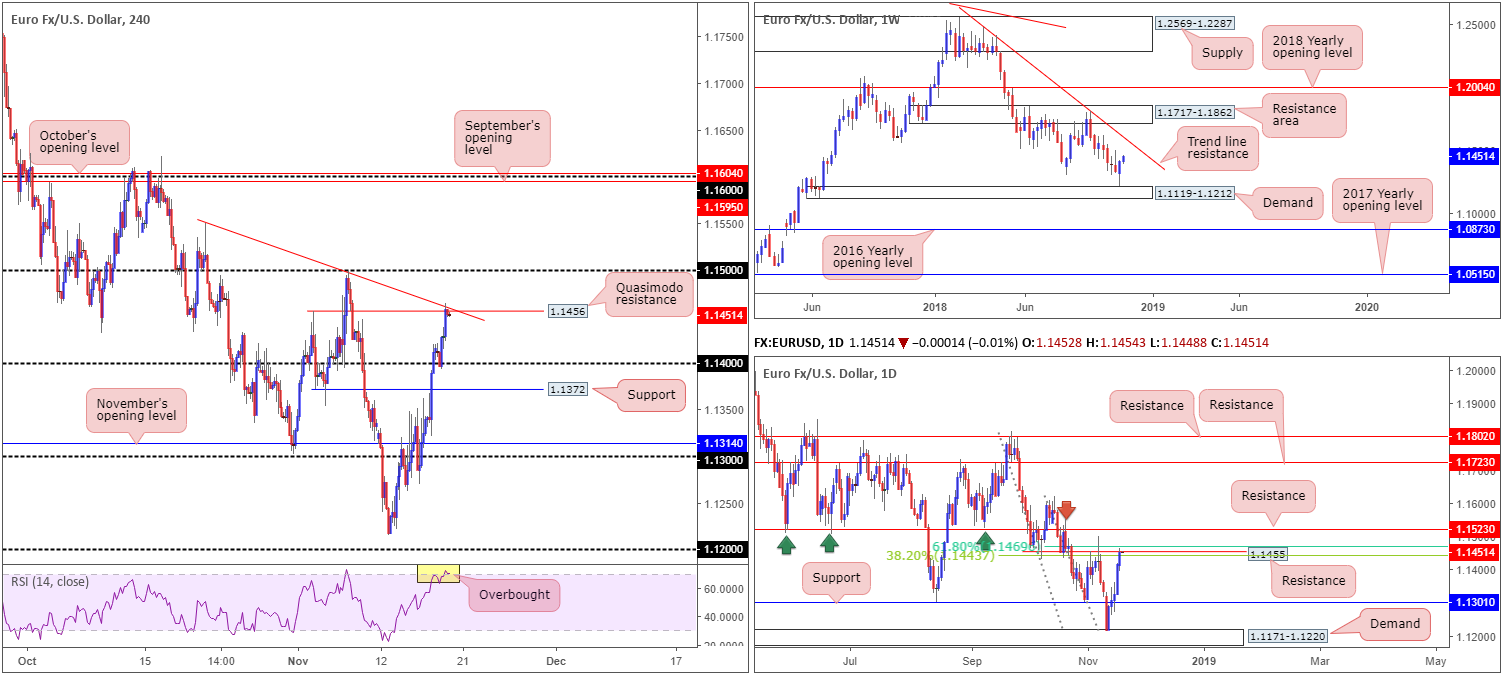
Monday witnessed the euro advance against its US counterpart, reaching highs not seen since Nov 7. The move higher was largely triggered by falling US Treasury bond yields, which pressured the US dollar index to explore ground beneath its 96.20 mark. As is evident from the H4 chart, the candles retested its 1.14 handle amid early European hours and gravitated north towards a Quasimodo resistance at 1.1456 into the closing stages of the day. Not only does this level merge with a trend line resistance (taken from the high 1.1550), it might also be worth noting the RSI indicator is currently displaying an overbought reading. Should we break beyond 1.1456, however, the 1.15 handle is likely the next barrier on the hit list.
On a wider perspective, we can also see the aforementioned H4 Quasimodo resistance level dovetails nicely with daily resistance priced in at 1.1455. Note this level is also surrounded by two Fib resistances: 38.2%/61.8% at 1.1443 and 1.1469, respectively. In the event of a break beyond here, an additional layer of resistance rests at 1.1523.
Although both H4 and daily structure encourage selling, weekly action shows a stronger-than-expected rebound developed just north of demand at 1.1119-1.1212 last week, consequently breaking a four-week bearish phase. Continued buying from this point could eventually lift the unit towards trend line resistance (etched from the high 1.2476), trailed closely by a resistance area at 1.1717-1.1862.
Areas of consideration:
Although the EUR/USD ended Monday in positive territory and, according to the weekly timeframe, shows potential to advance further, intraday traders are likely looking to fade this momentum from the H4 Quasimodo resistance level at 1.1456, given its connection to the daily timeframe. The first area of concern (support) rests nearby at 1.14.
Conservative traders may opt to wait and see how H4 price action behaves before pulling the trigger from 1.1456. A bearish candlestick formation would help confirm seller interest, and also provide entry/stop parameters. Aggressive traders, on the other hand, may have eyes on current price for a short with stop-loss orders planted a few pips beyond 1.1469 (the 61.8% daily Fib resistance). That’s a 20-pip stop (including spread), which offers in excess of a 1:2 move to 1.14 in terms of risk/reward.
Today’s data points: German Buba President Weidmann speaks; US housing data.
GBP/USD:
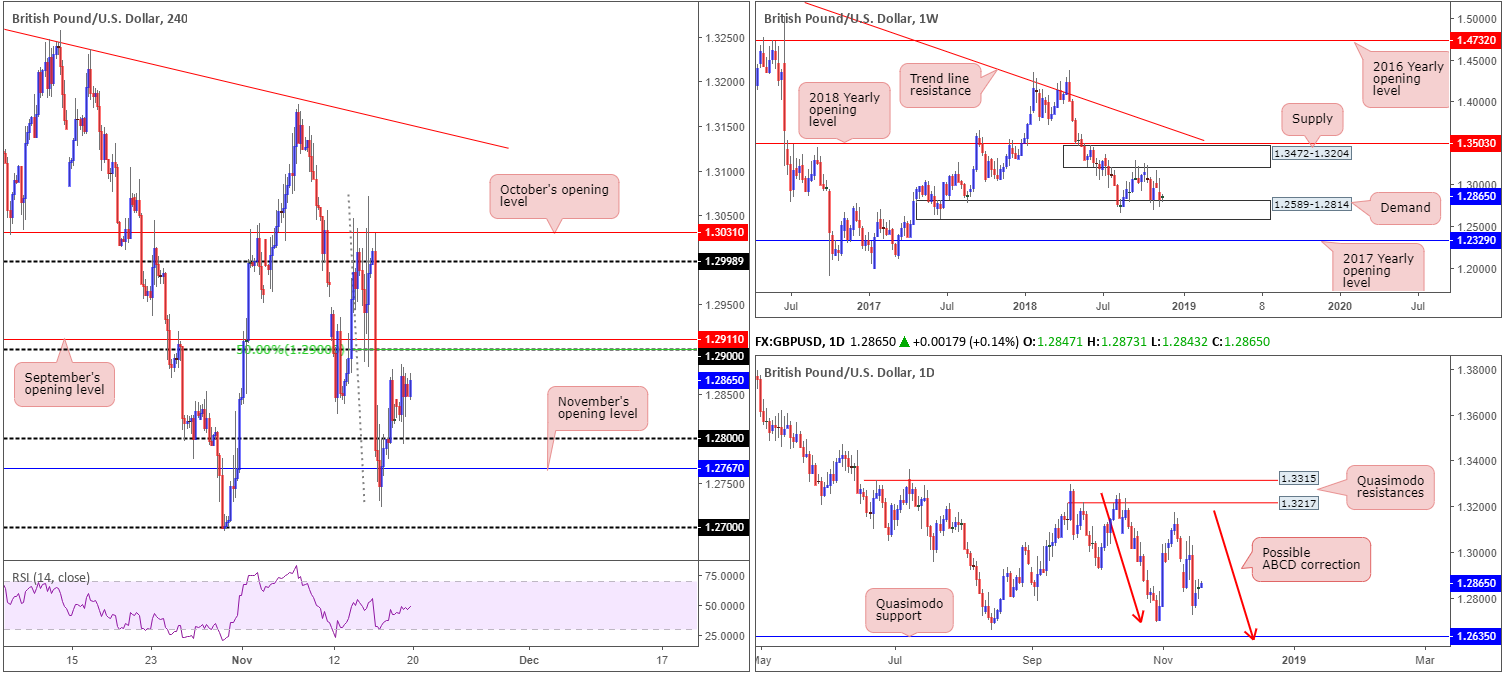
In recent sessions, traders observed the GBP/USD swiftly reverse a knee-jerk slide to its 1.28 handle amid London’s morning segment. As of current price in early Asia today, the unit is seen testing 1.2870 after recovering 47 pips off 1.28 into the closing bell Monday. Speculation is mounting with regard to further resignations from the cabinet and even a potential leadership challenge to UK Prime Minister May. With this in mind, GBP-related markets are likely to remain volatile going forward.
Should the H4 candles continue to press for higher ground today, the 1.29 handle (positioned nearby September’s opening level at 1.2911 and fusing with a 50.0% resistance value) is likely on the radar for most traders as the next upside hurdle.
Weekly price, as highlighted in Monday’s report, remains limited to a consolidation carved from demand at 1.2589-1.2814 and a supply drawn from 1.3472-1.3204 (price is currently testing the lower edge of this range). A closer look at price action on the daily timeframe, nevertheless, shows the unit positioned within close proximity to the 1.2695 Oct 30 low. While a response from this neighbourhood is possible, the Quasimodo support seen at 1.2635 remains an appealing level, given the amount of stop-loss orders likely positioned beneath the said low and the 1.2661 Aug 15 low (taking out these stops provide liquidity for pro money to buy), along with a possible ABCD approach (red arrows) terminating just south at 1.2614.
Areas of consideration:
In essence we have the weekly timeframe suggesting a move higher, the daily timeframe showing signs it may want to explore lower ground until reaching 1.2635ish and H4 price poised to retest the underside of its 1.29 handle.
Longer term, longs from the daily Quasimodo support mentioned above at 1.2635 remain appealing. Not only is the level sited within the walls of weekly demand at 1.2589-1.2814, the approach is likely to take shape in the form of a daily ABCD bullish pattern (1.2614ish).
Shorter term, however, it’s still a tricky read at the moment. Although many traders will be eyeing 1.29 as a possible resistance to trade, buying pressure from weekly demand, as well as a lack of daily resistance around this zone could overthrow any H4 sellers residing here. This – coupled with the current political situation in the UK – makes trading intraday moves challenging at the moment.
Today’s data points: UK inflation report hearings; US housing data.
AUD/USD:
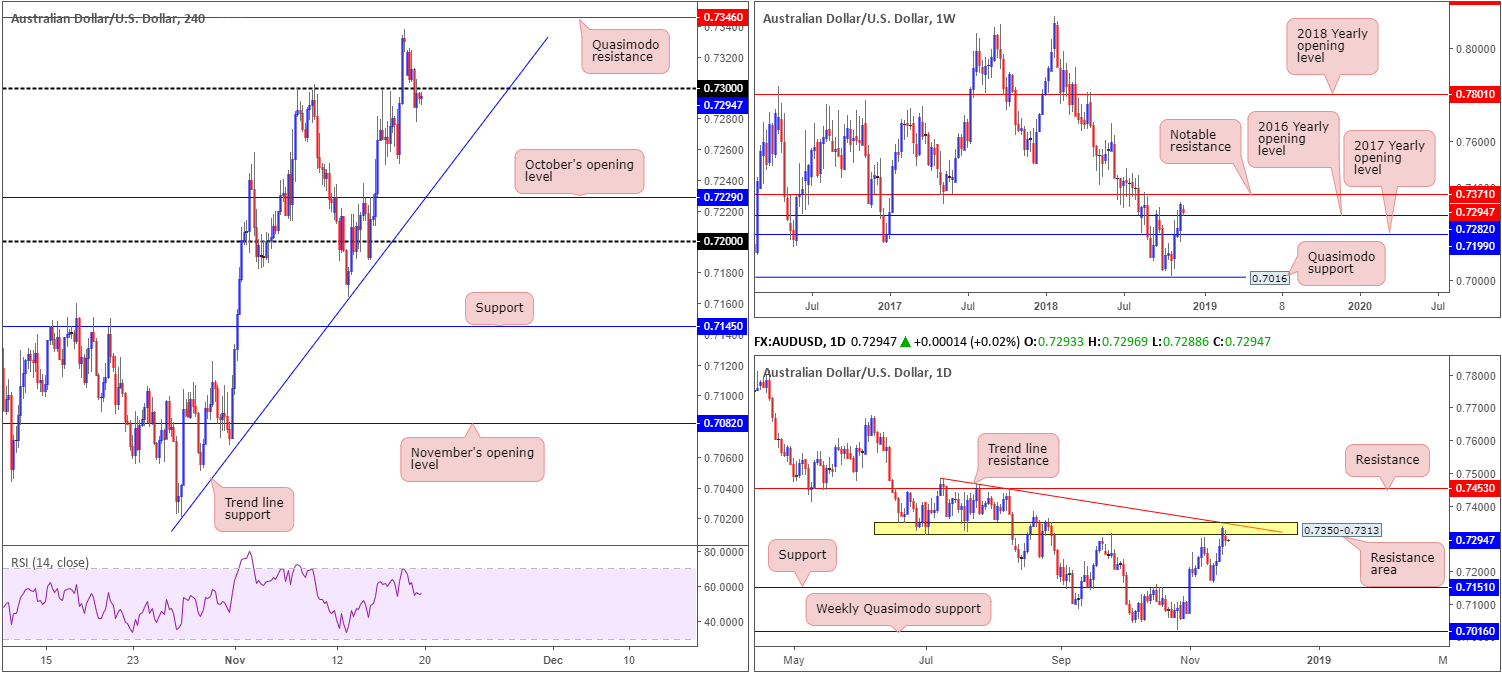
Kicking this morning’s report off from the top, we can see weekly price, after shipping price action above its 2016 yearly opening level at 0.7282 last week, retested the yearly level as support Monday. Provided buyers defend this level, notable resistance is seen priced in at 0.7371. This resistance has served as a critical level in this market for a number of years, and therefore may hinder further upside this week.
Buying based on the weekly timeframe alone, however, is a challenge. Closer analysis of the daily timeframe shows the unit flirting with a resistance area at 0.7350-0.7313, which happens to unite with a trend line resistance (extended from the high 0.7483). Although by and of itself this resistance area has enough clout to hinder upside, traders are urged to pencil in resistance at 0.7453 in the event we push for higher ground this week as the weekly timeframe suggests.
The key observation on the H4 timeframe is 0.73. After strongly breaking this number to the upside Friday, Monday’s sessions witnessed the candles grind lower and eventually reclaim the level, registering lows of 0.7277. Further selling sub 0.73 has a trend line support (extended from the low 0.7021) to target, followed closely by October’s opening level at 0.7229.
Areas of consideration:
On account of the above, a short on a retest of 0.73 as resistance could be an option today, given we’re coming from a daily resistance area mentioned above at 0.7350-0.7313. The only caveat to this forecast, however, is weekly price indicating further buying may be on the cards.
To help prove seller intent around 0.73, waiting and seeing if H4 price prints a bearish candlestick formation is recommended. While this will not guarantee a winning trade, it will display seller intent and also provide entry and stop parameters. As for an initial take-profit target, the aforementioned H4 trend line support is eyed.
In the event H4 price breaks back above 0.73, on the other hand, this could be a strong signal to consider buying, should the number be retested as support. At that point, you’ll be trading alongside weekly flow, with an upside target residing at 0.7346: a H4 Quasimodo resistance level, followed closely by the weekly resistance highlighted above at 0.7371.
Today’s data points: AUD monetary policy meeting minutes; RBA Gov. Lowe speaks; US housing data.
USD/JPY:
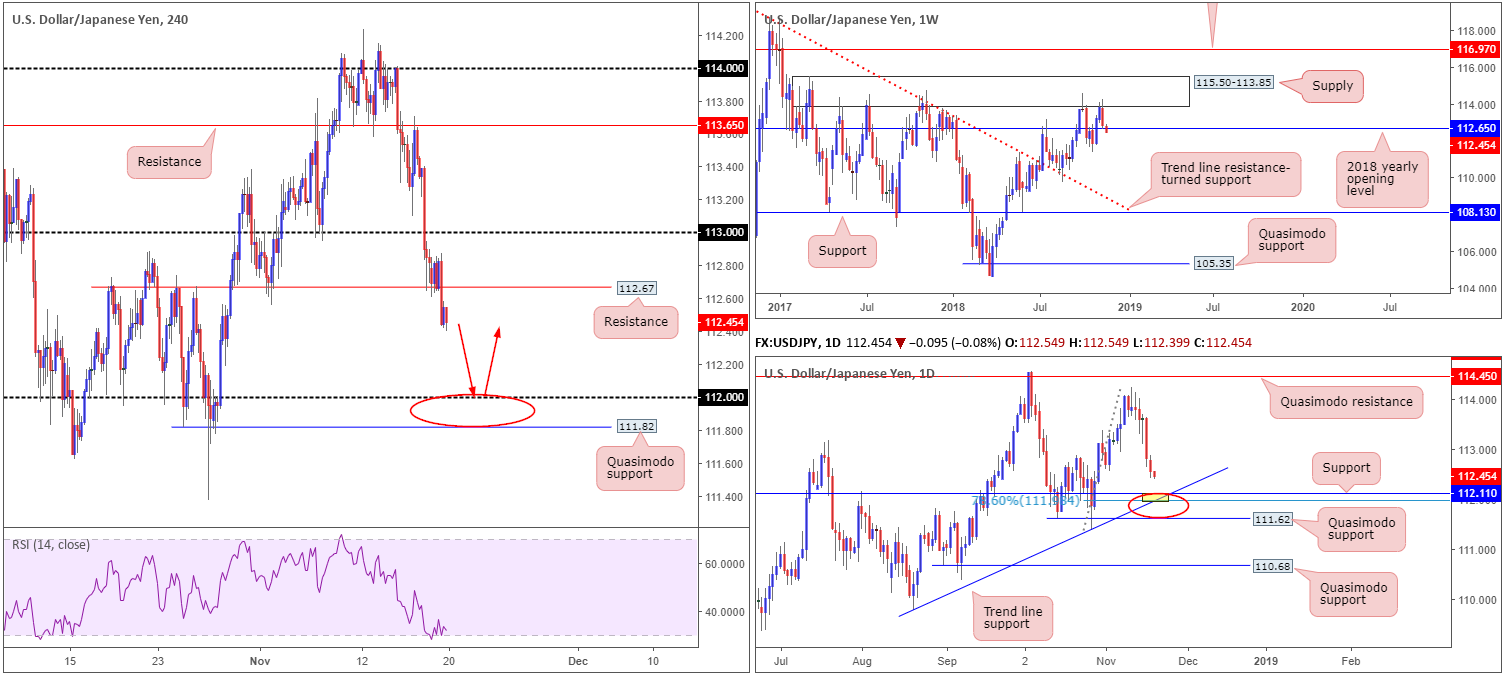
Falling US Treasury bond yields, along with US equities ending the day with sharp losses, triggered a flight to safety Monday, with the safe-haven Japanese yen clearly favoured. H4 support at 112.67 (now acting resistance), although held firmly throughout Asia and the majority of the London session, gave way amid US hours. According to the H4 scale, this has potentially set the stage for further selling towards the 112 handle, shadowed closely by Quasimodo support located nearby at 111.82.
Supporting the possibility of further selling this week, daily price shows room to potentially challenge support priced in at 112.11, followed closely by a Quasimodo support at 111.62. Note 112.11 also fuses with a trend line support (extended from the low 109.77) and a 78.6% Fib support at 111.98. In addition to daily flow, however, weekly price recently overthrew its 2018 yearly opening level at 112.65. Apart from the 111.37 Oct 22 low, the next downside target on the weekly timeframe can be seen as far south as the trend line resistance-turned support (extended from the high 123.57)/support at 108.13.
Areas of consideration:
The point at which the daily structures merge (yellow – 111.98/112.11) is attractive for a bounce higher. However, given how close Quasimodo support at 111.62 is, traders are urged to include this level as well. As a result, we have 111.62/112.11 to work with on this timeframe.
On the H4 scale, the 112 handle should ideally hold ground. A fakeout lower to 111.82 is permissible, though overall 112 should play a supportive role. A H4 bullish candlestick formation printed from 112 is considered a strong buy signal (entry/stop parameters can be defined by this candle), owing to where this psychological number is positioned on the daily timeframe. The reason behind requiring additional bullish candlestick confirmation is simply due to weekly price suggesting we may test the 111.37 Oct 22 low.
Today’s data points: US housing data.
USD/CAD:
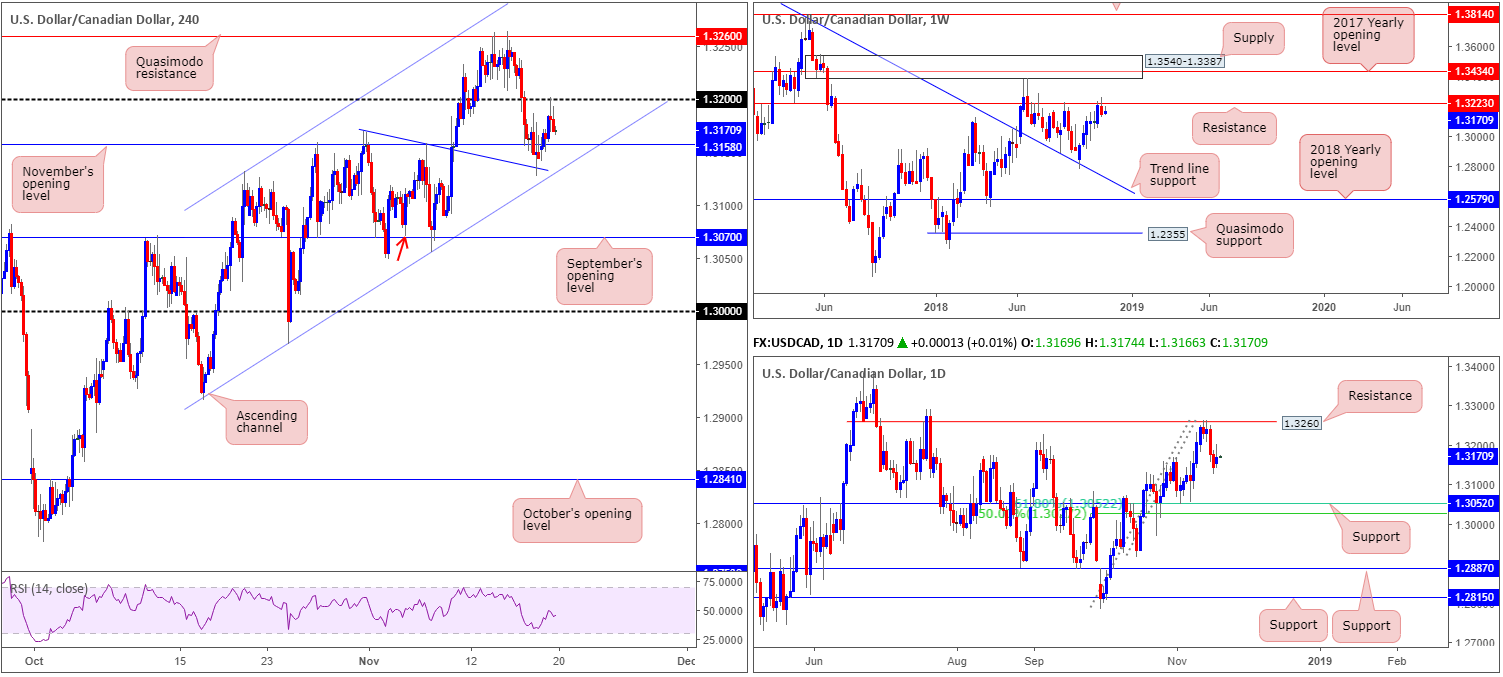
Recent action shows the USD/CAD extended its bounce from a local H4 trend line resistance-turned support (taken from the high 1.3170) Monday, consequently overthrowing November’s opening level nearby at 1.3158 and concluding the day testing/fading the 1.32 handle.
Although H4 price is poised to retest November’s opening level at 1.3158 as support, followed by a possible move to challenge channel support (extended from the low 1.2916), let’s remember where we’re coming from on the bigger picture before considering a position in this market!
USD/CAD bulls lost their flavor last week after price action sold off from weekly resistance coming in at 1.3223, consequently breaking a six-week bullish run. With respect to this timeframe, limited support is visible until the 1.2782 Oct 1 low, followed closely by trend line resistance-turned support (etched from the high 1.4689). In conjunction with the current weekly resistance level, daily action also recently encountered strong selling off resistance at 1.3260. The next support target in view from here falls in around the 1.3052 neighbourhood, placed just north of a 50.0% support value at 1.3026 and in line with a 61.8% Fib support.
Areas of consideration:
While an intraday bounce off 1.3158/H4 channel support could be observed, buying is a challenge, according to our technical studies. Pressure from higher-timeframe sellers will likely engulf any H4 buying.
Rather than trying to buy against higher-timeframe flow, traders could consider waiting and seeing if H4 price engulfs the current H4 channel support and retests it as resistance. This, in the shape of a bearish candlestick formation, would likely be enough to draw in sellers towards September’s opening level at 1.3070, which also happens to represent a Quasimodo left shoulder (red arrow). Note this level is also positioned less than twenty pips above the next downside target on the daily scale: 1.3052.
Today’s data points: US housing data; (CAD) Gov. Council Member Wilkins speaks; Gov. Council Member Lane speaks.
USD/CHF:
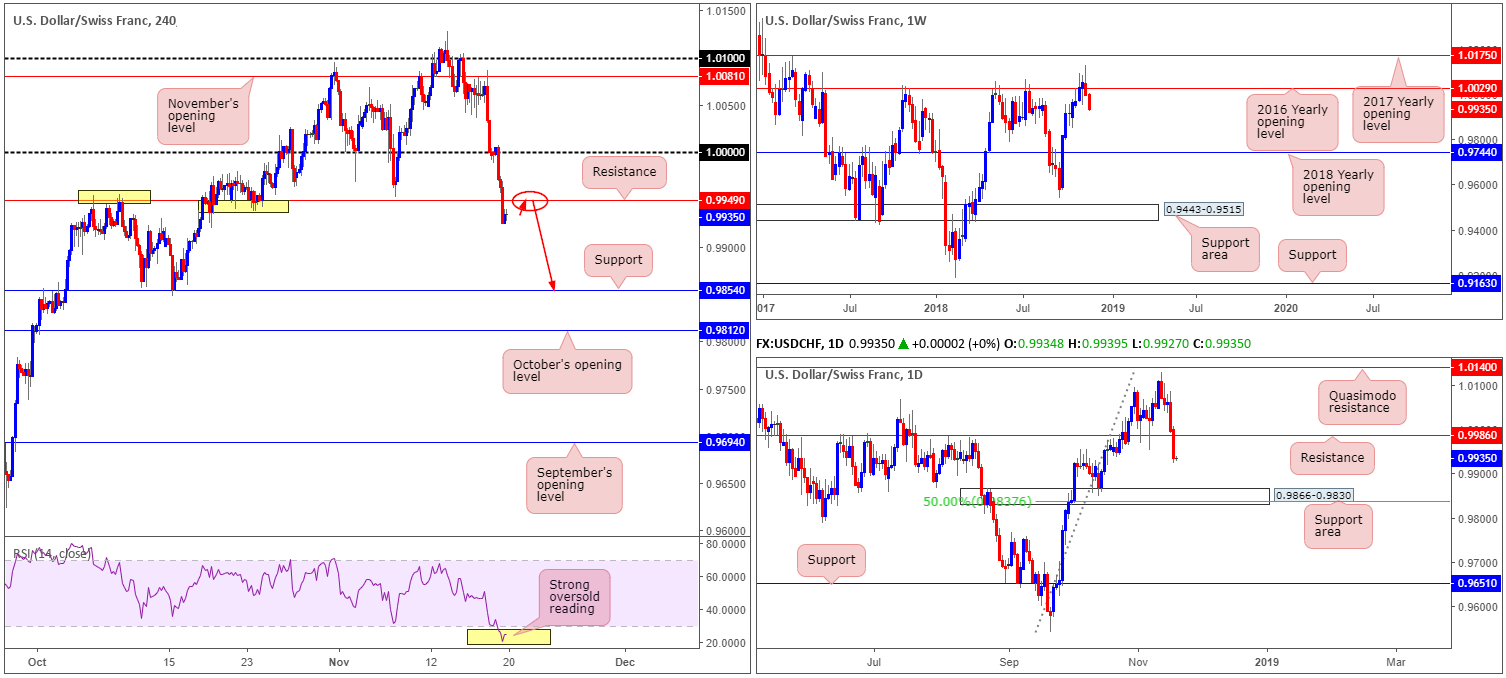
In the absence of high-impacting news events Monday, falling US Treasury bond yields along with UK political uncertainty, drew the market towards a wave of safe-haven CHF buying.
Parity (1.0000), as you can see on the H4 timeframe, struggled to hold ground in Asia and finally gave way in the early hours of Europe. In the shape of three dominant H4 bearish candles, the USD/CHF conquered support at 0.9949 (now acting resistance) and drew the spotlight towards support coming in at 0.9854. We have not marked the 0.99 handle given it has seen limited reaction over the past few months.
Against the backdrop of intraday flow, higher-timeframe structure displays room to explore lower ground this week. After a seven-week bullish run, as well as a marginal close above the 2016 yearly opening level seen on the weekly timeframe at 1.0029 the week prior, last week’s action observed a sharp change in mood. Despite clocking highs of 1.0128, weekly price turned lower and reclaimed 1.0029, possibly unlocking downside as far south as the 2018 yearly opening level at 0.9744. In terms of daily structure, support at 0.9986 offered little to the market (now acting resistance) yesterday, with daily movement now poised to challenge the support area carved from 0.9866-0.9830, which happens to converge with a 50.0% support value at 0.9837.
Areas of consideration:
Based on our technical studies, the H4 resistance level at 0.9949 is an area traders likely have marked for selling today. This base is bolstered by the fact both weekly and daily timeframes exhibit room to press lower. Should H4 price retest 0.9949 and chalk up a H4 bearish candlestick configuration (entry/stop parameters can be defined by this candle), this would be considered a high-probability sell signal, targeting the top edge of the daily support area mentioned above at 0.9866, shadowed closely by H4 support at 0.9854.
Today’s data points: US housing data.
Dow Jones Industrial Average:
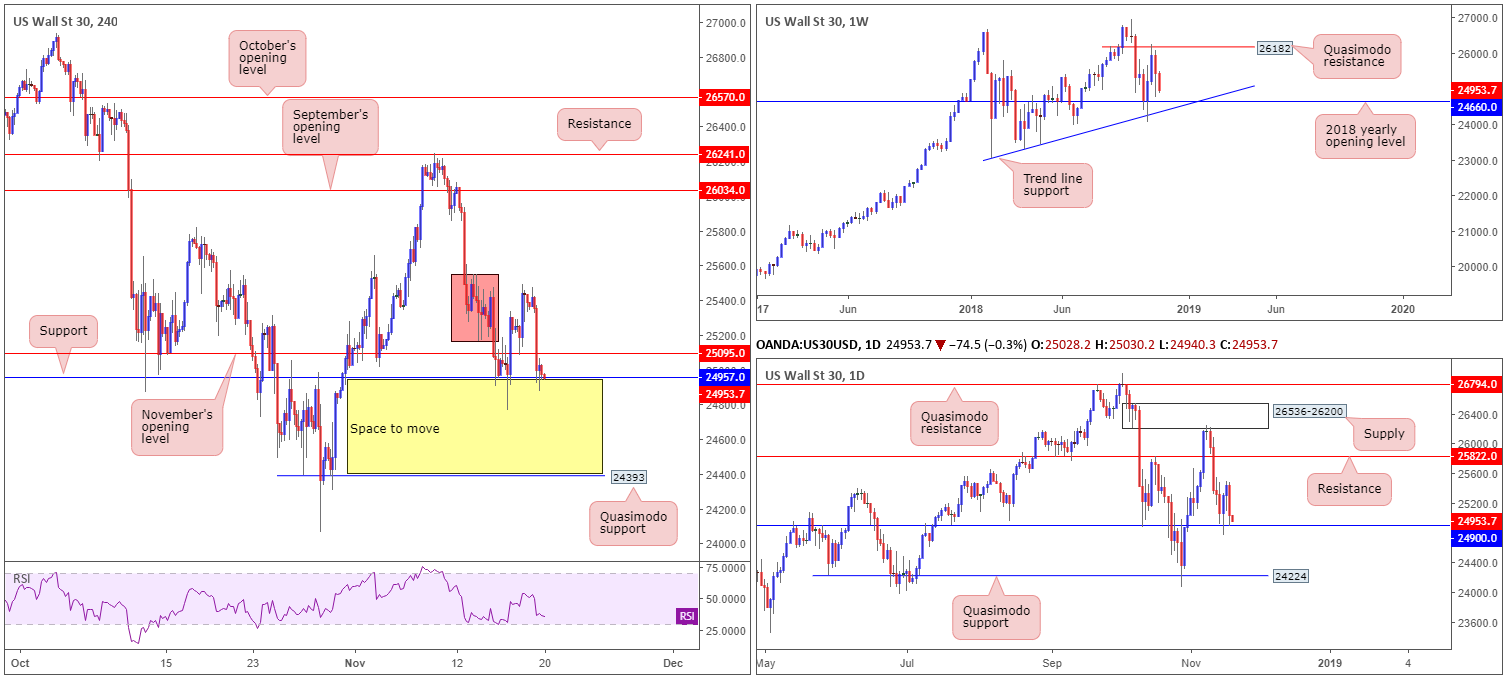
Down 1.60% on the day, Monday’s sessions observed the DJIA turn aggressively lower amid trade concerns and a selloff in the technology sector.
Technically, this brought the H4 candles through November’s opening level at 25095 into support at 24957. On the H4 timeframe, a break beyond this support shows room for the index to press lower and challenge a Quasimodo support located at 24393.
Higher up on the curve, nevertheless, weekly movement shows price action closing in on its 2018 yearly opening level at 24660. Therefore, we could potentially observe the H4 candles turn higher prior to reaching the aforementioned H4 Quasimodo support. What’s more, daily flow displays support nearby at 24900, positioned a few points beneath the current H4 support level.
Areas of consideration:
Neither a long nor short seems attractive today.
A long from the current H4 support level at 24957 has resistance resting nearby at 25095 (Nov’s opening level). A break of the H4 support, which looks like an appealing short from the H4 scale, not has only overcome daily support just beneath it at 24900, but also tackle weekly support at 24660! For that reason, both ends of this market appear capped for now.
Today’s data points: US housing data.
XAU/USD (Gold):
(Outlook remains unchanged)
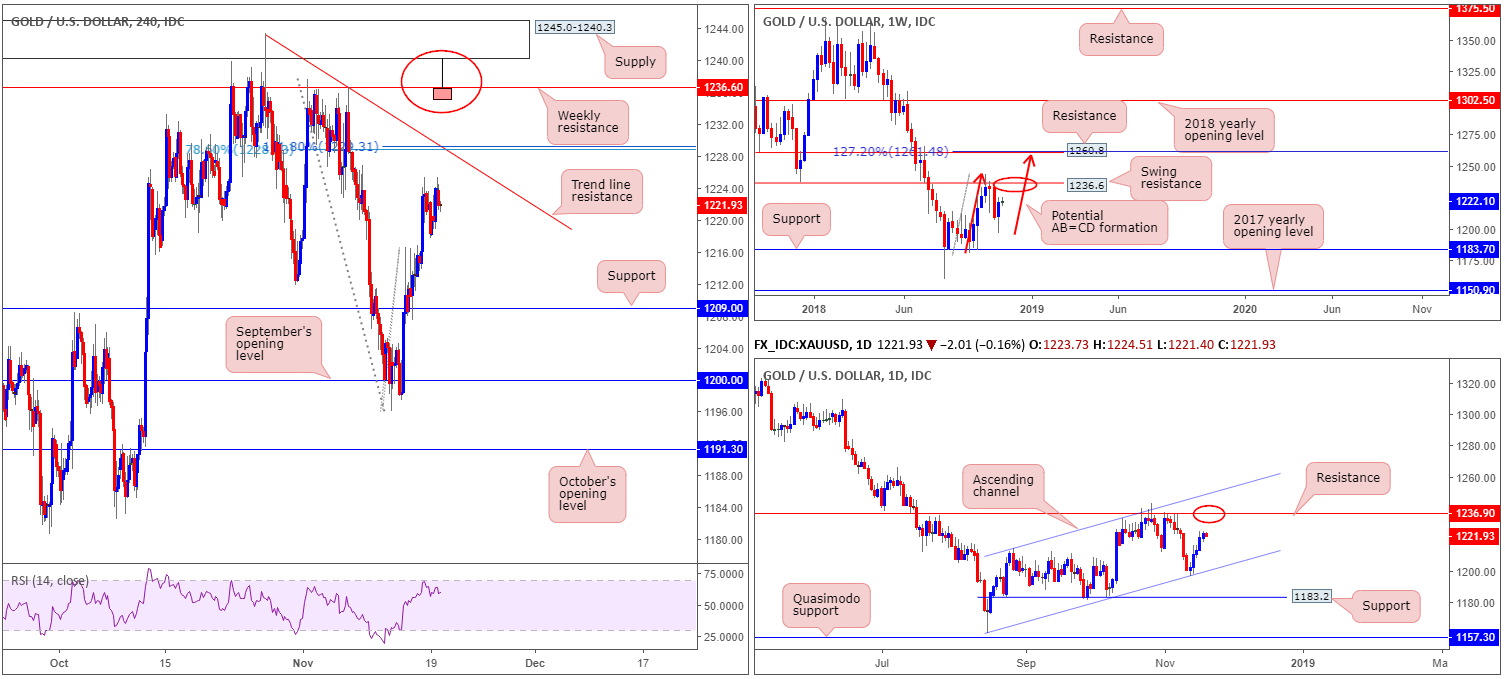
The price of gold advanced against its US counterpart Monday, recording its fifth consecutive daily gain. Further buying could also still be on the horizon, according to our technical studies on the higher timeframes. Weekly price shows space to maneuver until swing resistance priced in at 1236.6 is brought into the mix. Another consideration worth noting on the weekly timeframe is the potential for an AB=CD (red arrows) 127.2% bearish formation to complete just north of another layer of resistance (1260.8) at 1261.4.
Looking at this market in more detail, we can see the yellow metal is currently compressing within an ascending channel formation (1160.3/1214.3) on the daily timeframe, with the candles possibly working their way towards a test of resistance at 1236.9 (essentially representing the weekly swing resistance mentioned above at 1236.6) this week.
With respect to the H4 timeframe, a trend line resistance (extended from the high 1243.4) is recognized as the next upside target on this scale. In addition to this, a 78.6% Fib resistance at 1228.7 is seen nearby, along with a 161.8% Fib ext. point at 1229.3. To expect more than a bounce from the noted trend line resistance, though, would be considered chancy, knowing both weekly and daily price show room to press beyond this region towards 1236ish.
Areas of consideration:
While a bounce from the current H4 trend line resistance could be seen, the majority of traders will likely be honing in on the weekly resistance level at 1236.6. With H4 supply at 1245.0-1240.3 positioned just north of this weekly line, traders should prepare for the possibility of a fakeout play. Therefore, should a H4 bearish pin-bar formation take shape that pierces through the weekly resistance and tests the H4 supply (see H4 chart for a visual), this would be considered a high-probability shorting opportunity (stop-loss orders can be positioned either beyond the noted H4 supply or a few pips above the pin-bar’s wick), targeting the other side of the trend line resistance (at that point support) as an initial take-profit zone.
The use of the site is agreement that the site is for informational and educational purposes only and does not constitute advice in any form in the furtherance of any trade or trading decisions.
The accuracy, completeness and timeliness of the information contained on this site cannot be guaranteed. IC Markets does not warranty, guarantee or make any representations, or assume any liability with regard to financial results based on the use of the information in the site.
News, views, opinions, recommendations and other information obtained from sources outside of www.icmarkets.com.au, used in this site are believed to be reliable, but we cannot guarantee their accuracy or completeness. All such information is subject to change at any time without notice. IC Markets assumes no responsibility for the content of any linked site. The fact that such links may exist does not indicate approval or endorsement of any material contained on any linked site.
IC Markets is not liable for any harm caused by the transmission, through accessing the services or information on this site, of a computer virus, or other computer code or programming device that might be used to access, delete, damage, disable, disrupt or otherwise impede in any manner, the operation of the site or of any user’s software, hardware, data or property.


