
A note on lower timeframe confirming price action…
Waiting for lower timeframe confirmation is our main tool to confirm strength within higher timeframe zones, and has really been the key to our trading success. It takes a little time to understand the subtle nuances, however, as each trade is never the same, but once you master the rhythm so to speak, you will be saved from countless unnecessary losing trades. The following is a list of what we look for:
- A break/retest of supply or demand dependent on which way you’re trading.
- A trendline break/retest.
- Buying/selling tails – essentially we look for a cluster of very obvious spikes off of lower timeframe support and resistance levels within the higher timeframe zone.
- Candlestick patterns. We tend to only stick with pin bars and engulfing bars as these have proven to be the most effective.
EUR/USD:
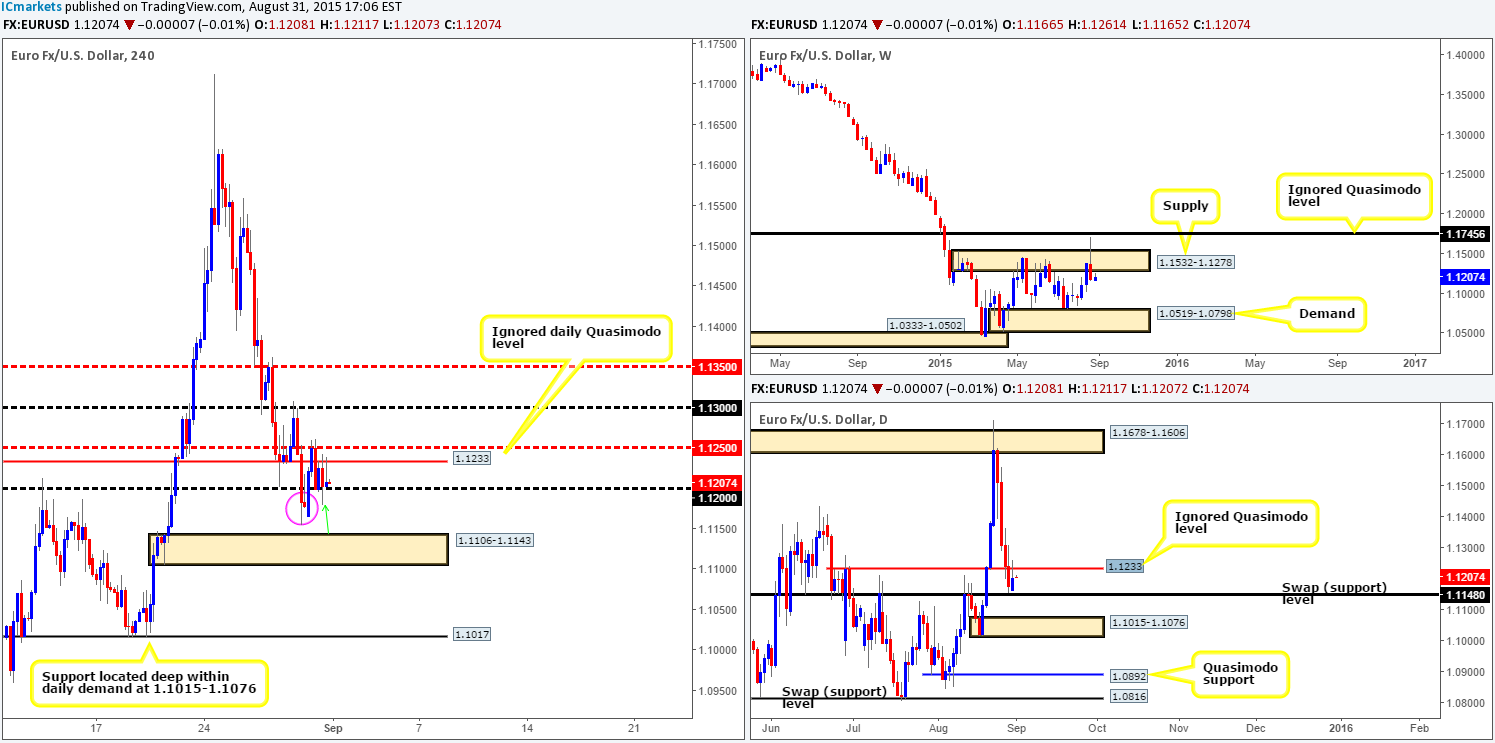
A conservative wave of bids came into the market shortly after the open at 1.1165, which, as you can see, aggressively pushed the pair back above psychological resistance 1.1200. Price then went on to connect with the mid-level number resistance 1.1250, consequently pulling the market back down to 1.1200. Following this, the EUR consolidated in a tight range between an ignored daily Quasimodo resistance level at 1.1233, and 1.1200.
In view of the market’s current position on the 4hr timeframe, what vibe are we receiving from the higher timeframe picture? Over on the weekly chart, price remains lurking below weekly supply at 1.1532-1.1278, whist down on the daily chart, the buyers and sellers are currently battling for position between 1.1233/1.1148.
Therefore, in a step-by-step fashion, here is why we believe the EUR will head south towards 4hr demand at 1.1106-1.1143 in today’s upcoming trade:
- Selling pressure from the weekly timeframe will likely weigh heavy on this pair.
- The spike below round-number support at 1.1200 (green arrow) has likely consumed a ton of bids here, and also below around minor 4hr demand (pink circle) at 1.1154-1.1183 as well, thus weakening support.
- Sellers, at the time of writing, appear to be winning the duel between 1.1200/1.1233 on the 4hr chart.
Now, in the event that our analysis is correct and price does indeed head towards 4hr demand, what next? Well, one could either look to short any retest seen at 1.1200 with lower timeframe confirmation, or simply wait until price reaches the 4hr demand base before deciding on your next move. In support of a buy from here, traders have the daily swap (support) barrier at 1.1148 backing them. On the other hand, this 4hr demand zone could give way due to weekly selling pressure, and in turn may give traders the chance to short this area as supply, targeting 4hr support at 1.1017 (located deep within a daily demand zone at 1.1015-1.1076).
Levels to watch/live orders:
- Buys: Flat (Stop loss: N/A).
- Sells: Watch for bids around 1.1200 to be consumed and then look to trade any retest seen at this level (confirmation required).
GBP/USD:
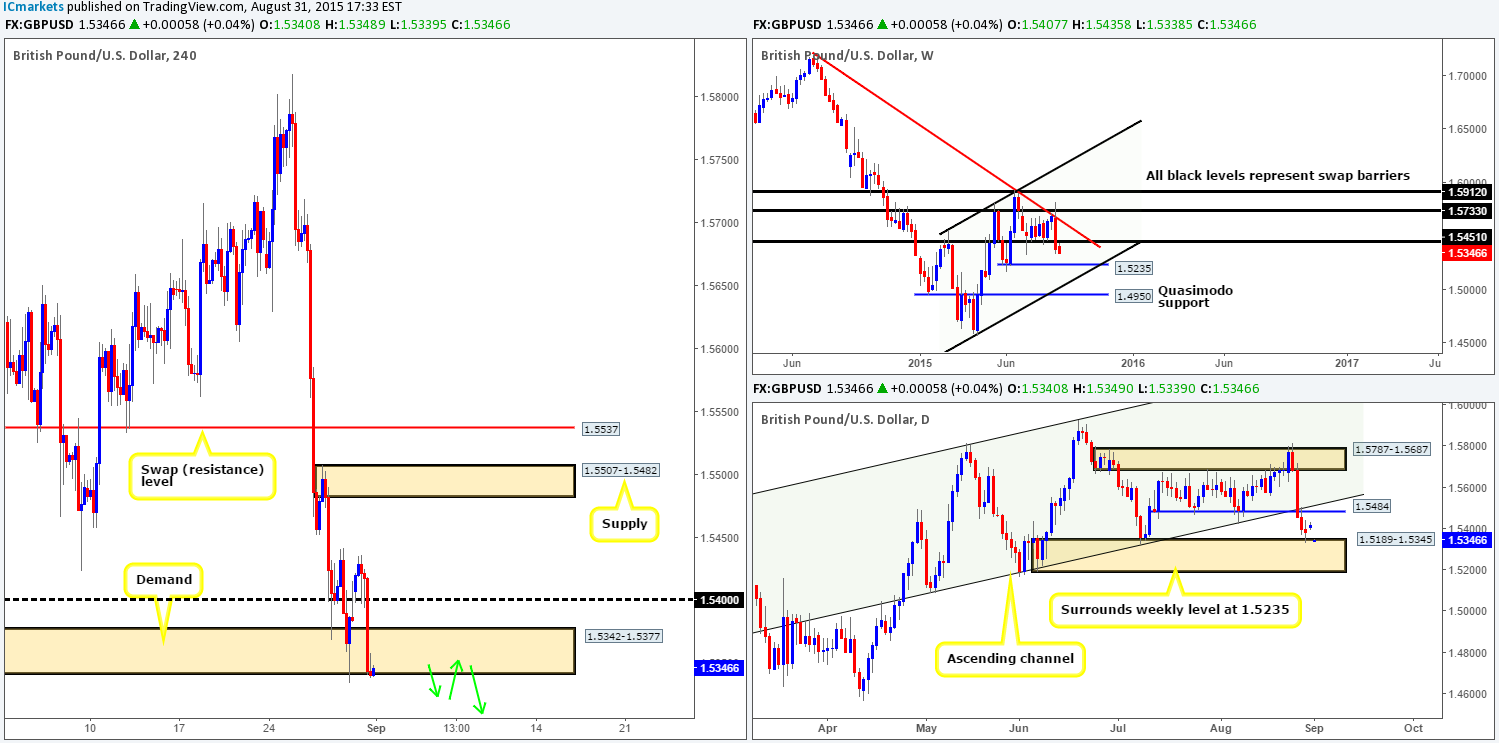
Yesterday’s open 1.5407 saw the GBP open 23 pips higher, placing price above 1.5400. Shortly after, price retested this number as support and managed to reach highs of 1.5435 before eventually plummeting lower. This sell-off drove the Pound back below 1.5400 and also just beneath 4hr demand coming in at 1.5342-1.5377.
With price currently nibbling at the lower limit of this 4hr demand area and showing very little buying interest at present, further selling may be seen going into today’s sessions down to 4hr demand at 1.5256-1.5294.
Sponsoring this possible decline, the weekly timeframe shows room to continue depreciating down towards 1.5235. Contrary to this though, daily action is trading around the top-side of a daily demand zone at 1.5189-1.5345 right now, which could be troublesome to short into. That being the case, to short this market we’d require price to not only convincingly close below current 4hr demand and retest this area as supply, but also display lower timeframe selling confirmation following the retest.
Levels to watch/ live orders:
- Buys: Flat (Stop loss: N/A).
- Sells: Watch for a convincing close below 1.5342-1.5377 and then look to trade any retest seen at this area (confirmation required)
AUD/USD:
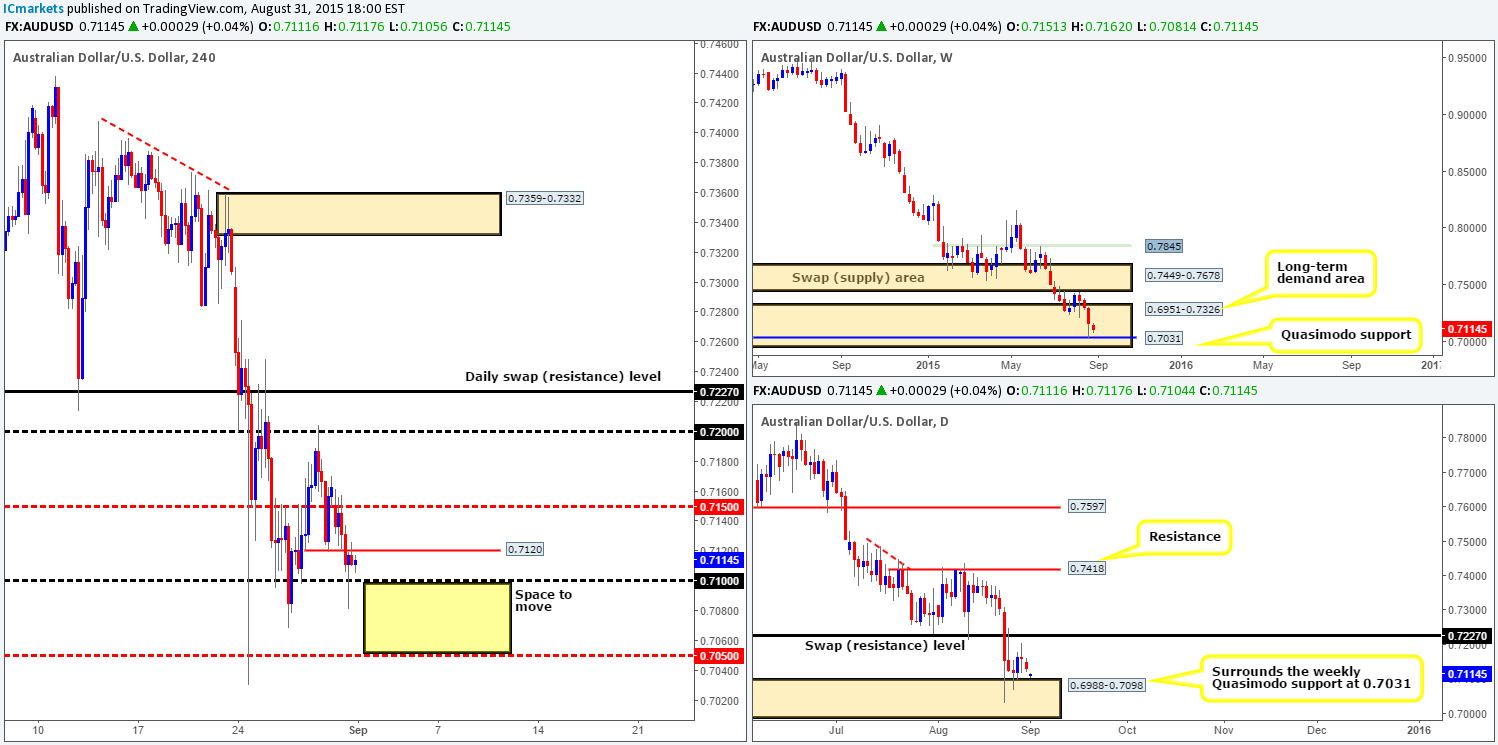
Looking at the 4hr chart, we can see that this week’s trade begun with a 12-pip gap lower bringing prices down to 0.7151. This clearly enticed further sellers into the market yesterday, as price drove south towards the psychological support 0.7100, which, as you can see, held firm.
Consequent to the recent attack on 0.7100, the AUD pair painted a relatively nice looking 4hr bullish pin-bar candle, which no doubt excited a lot of traders since it formed at recognizable support. However, minor 4hr resistance looming just above at 0.7120 is proving to be troublesome and is currently holding this market lower.
Given the fact that the buyers and sellers are battling for position within both weekly and daily demand (0.6951-0.7326/ 0.6988-0.7098) at the moment, technically price should essentially rally higher. Usually we’d agree with this, but with price still entrenched in what seems to be a never-ending downtrend, and the fact that there has been very little buying interest seen from either of the above said higher timeframe demand zones, we remain hesitant here.
It may sound illogical to some, but with the recent developments we’d only consider trading this pair now should price break below and retest 0.7100. In the event that this happens and the retest displays lower timeframe selling strength, we’ll enter short looking to target the mid-level hurdle 0.7050.
Levels to watch/ live orders:
- Buys: Flat (Stop loss: N/A).
- Sells: Watch for bids around 0.7100 to be consumed and then look to trade any retest seen at this level (confirmation required).
USD/JPY:
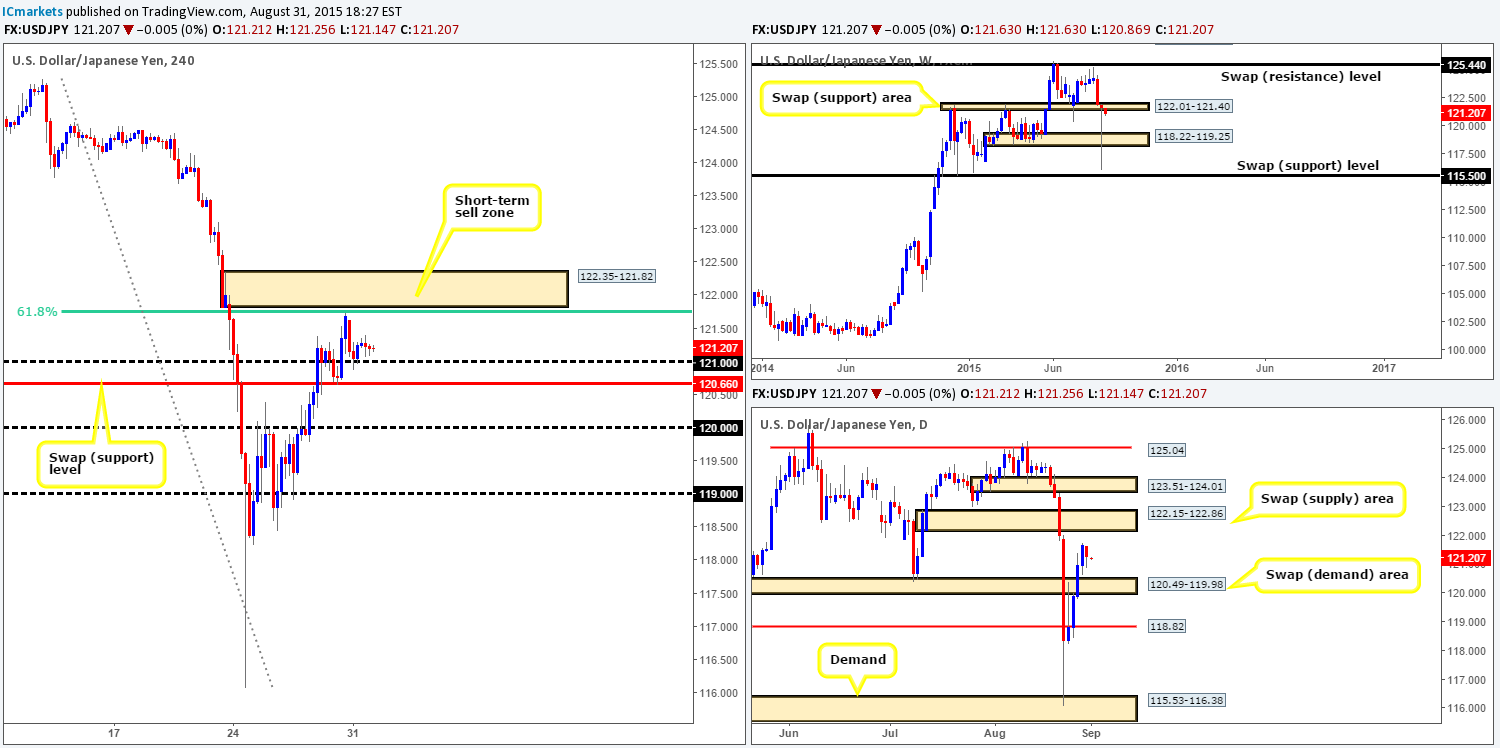
Early morning trade began at a steady pace yesterday. The market opened five pips lower at 121.63, resulting in an eventual sell-off back down to psychological support 121.00, which saw very little activity for the remainder of the trading day.
Given that price is still trading around a weekly swap (support) area at 122.01-121.40, and daily action shows that buyers and sellers remain trading mid-range between120.49-119.98/122.15-122.86, we’re currently watching the following levels:
-
With price not yet connecting with offers around 4hr supply at 122.35-121.82, this area is still potentially a zone to keep an eye on for a bounce lower. The reason being comes from it not only boasting a 61.8% Fibonacci resistance at 121.76/round-number resistance at 121.00, but also converging nicely with the underside of the aforementioned daily swap (supply) area at 122.15.
- The 4hr swap (support) level at 120.66. Assuming that price reaches this low today, a potential long opportunity may present itself. The reason for why is that not only did this level rebound prices on Friday, it also lurks only a few pips above the daily swap (demand) area at 120.49-119.98. Therefore, EXPECT a fakeout lower here guys!
Levels to watch/ live orders:
- Buys: 120.66 [Tentative – confirmation required] (Stop loss: dependent on where one confirms this level).
- Sells: 122.35-121.82 [Tentative – confirmation required] (Stop loss: 122.55).
USD/CHF:
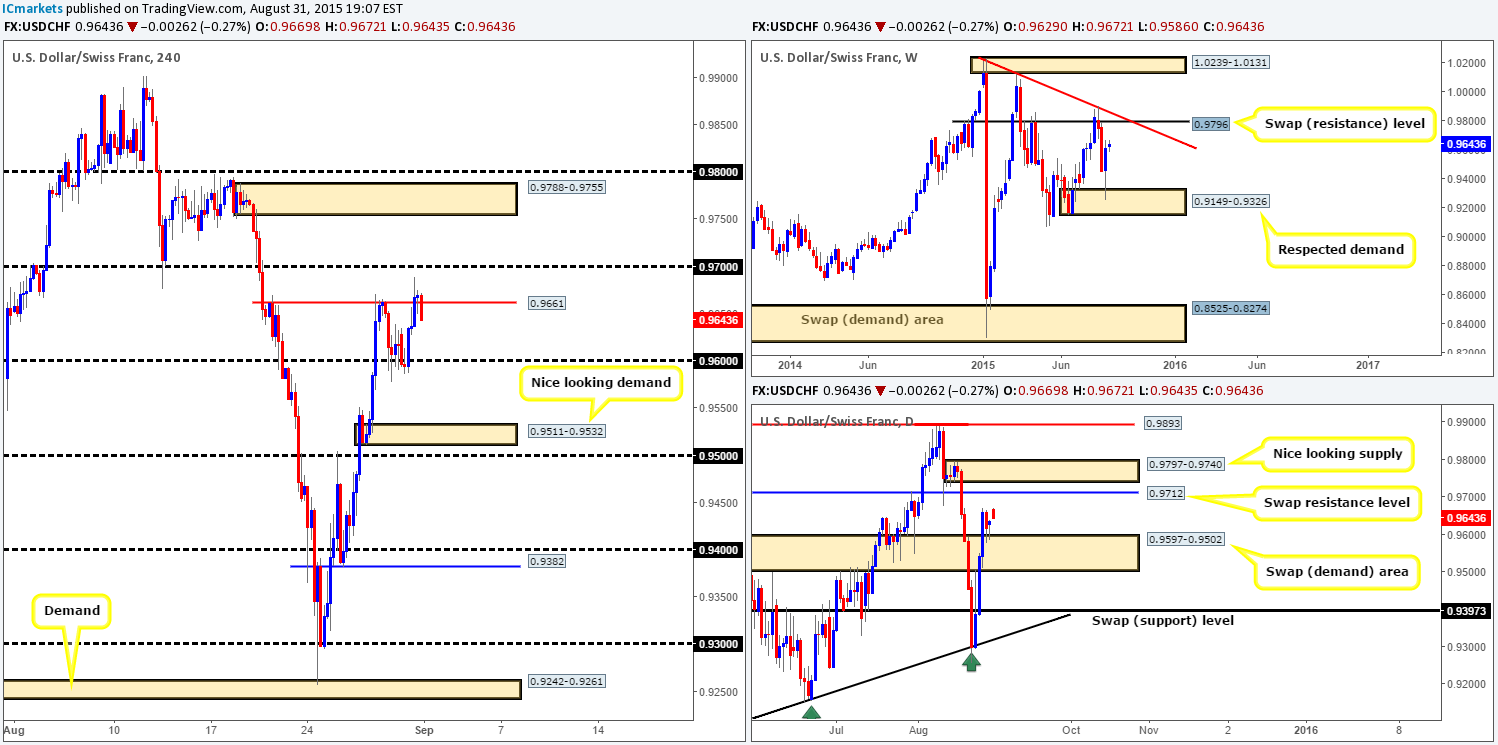
For those who read our previous report http://www.icmarkets.com/blog/monday-31st-august-weekly-technical-outlook-and-review-uk-bank-holiday-today/ you may recall us mentioning to keep an eye on the 0.9600 handle for potential (confirmed) buy trades. As you can see after a small round of selling, the buyers stepped in and sent price north, consequently pulling the USD/JPY above 4hr resistance at 0.9661. This, if you remember, was our first take-profit target. For those who took this trade long, your stops should now be at breakeven with at least 50/70% of your position booked as profits.
Going forward, we’re actually looking for the buyers to continue showing strength today due to where price is positioned on the higher timeframes. The weekly chart shows there is clear space for price to continue appreciating up to a weekly swap (resistance) level at 0.9796. Meanwhile, on the daily chart there is also room for price to appreciate until at least the daily swap (resistance) level at 0.9712.
As such, here is what we have noted so far:
- Ideally we want price to hold above 0.9661 as support today.
- From here, price should reach 0.9700.
- A break of this number would be fantastic, since there is space above this barrier to move up to 4hr supply at 0.9788-0.9755.
- Requirements for entering long: Close above/retest 0.9700 – watch for lower timeframe buying confirmation.
Levels to watch/ live orders:
- Buys: Watch for offers around 0.9700 to be consumed and then look to trade any retest seen at this level (confirmation required).
- Sells: Flat (Stop loss: N/A).
DOW 30:
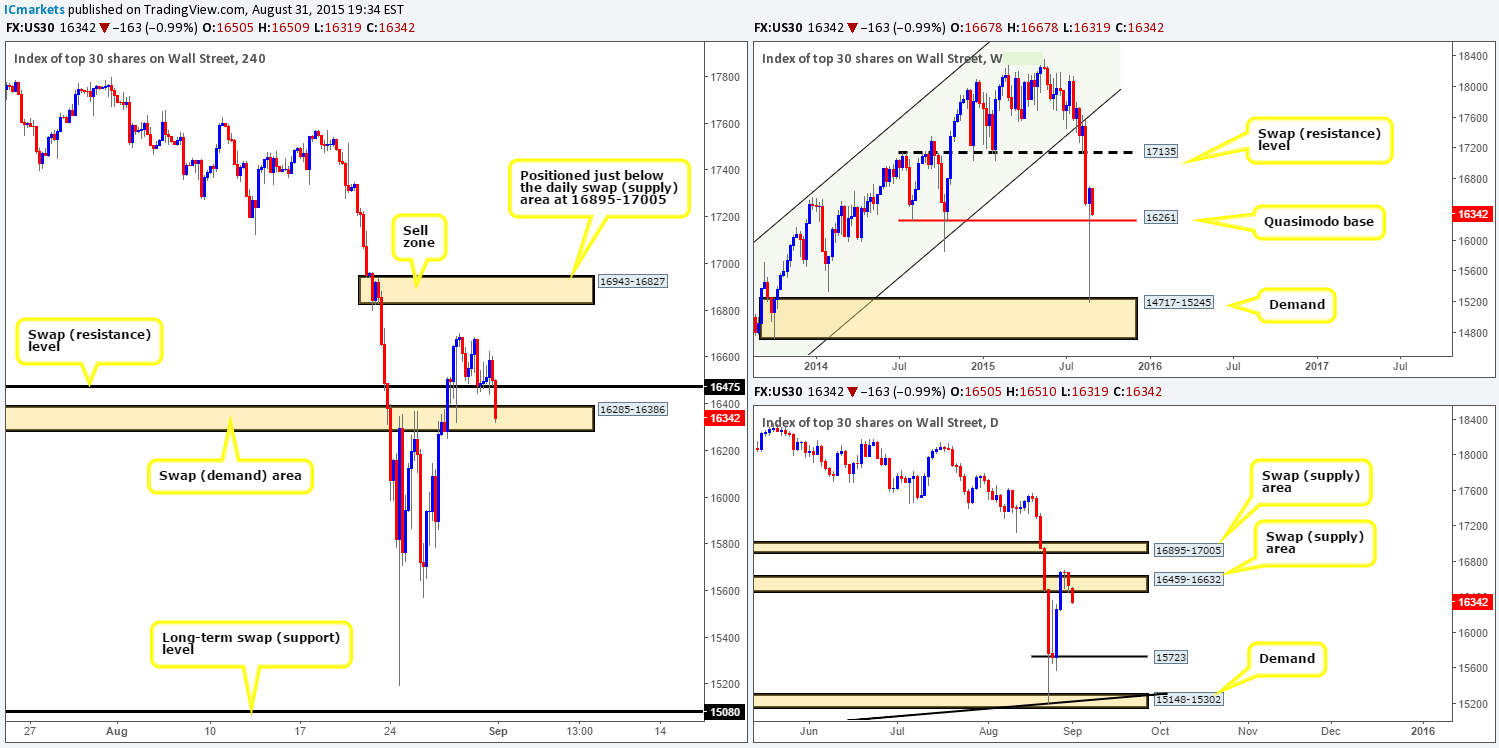
Following yesterday’s open at 16678, a strong wave of offers came into this market pulling price down to 16475. Buyers managed to hold this market higher from here for the majority of yesterday’s trade reaching highs of 16629 before aggressively selling off. This recent decline has taken out any remaining bids from 16475 and attacked fresh buyers sitting within a 4hr swap (demand) area at 16285-16386.
Considering that this 4hr demand held price higher just recently on the 27/08/15, do we believe this to be a stable enough platform to look for potential buys today? Well, considering that this 4hr area merges nicely with weekly Quasimodo support at 16621, there is a good chance a rebound will be seen from here. Despite this, one has to take into account that there is little to no daily support backing this 4hr area. In fact, from the daily timeframe, price could effectively decline all the way down the 15723 mark.
To that end, our team is going to continue watching how price develops within the current 4hr swap (demand) area at 16285-16386. In the event that lower timeframe buying confirmation is spotted, we will likely jump in long and look for price to engulf 16475 before considering moving our stop into a breakeven position.
Levels to watch/ live orders:
- Buys: 16285-16386 [Tentative – confirmation required] (Stop loss: dependent on where one confirms this area).
- Sells: Flat (Stop loss: N/A).
XAU/USD: (Gold)
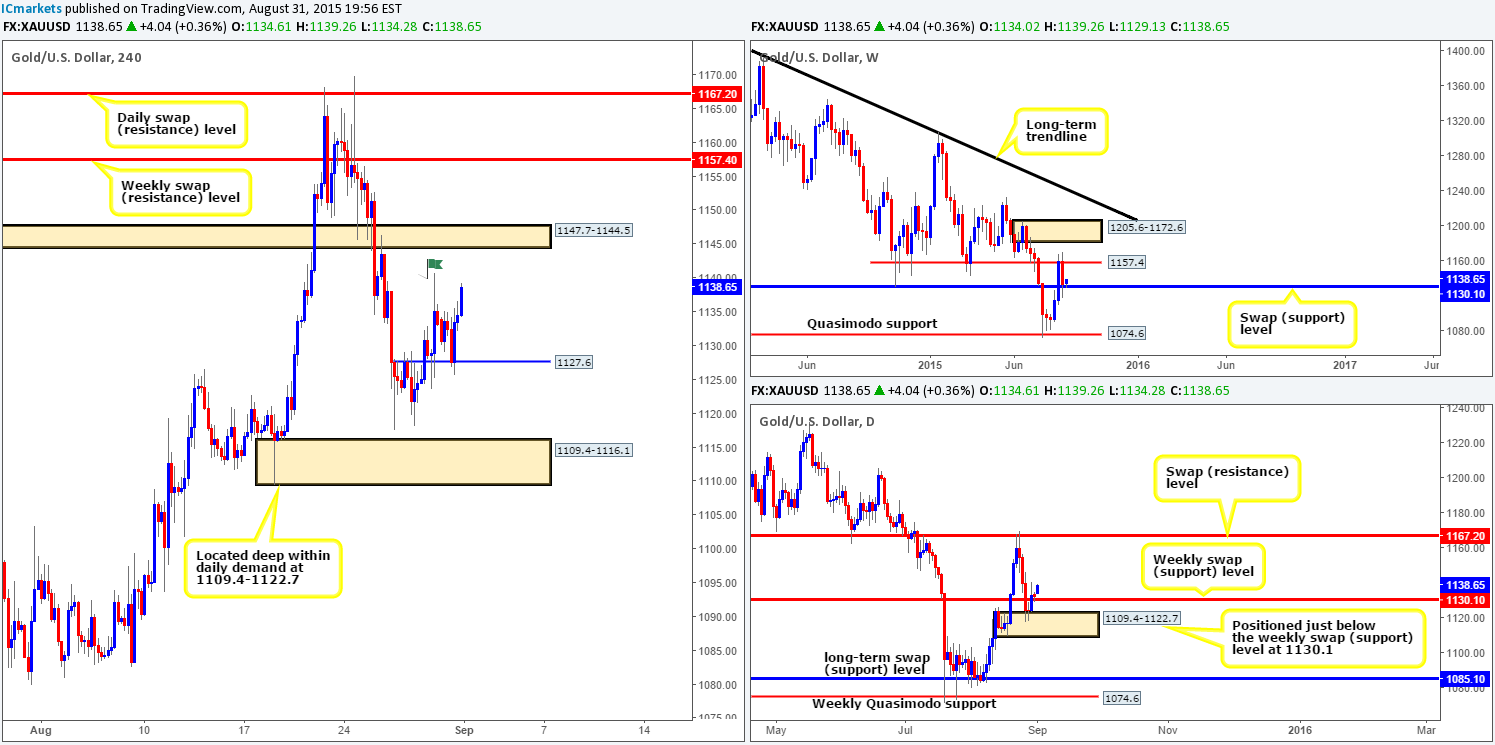
For those who read our previous report on Gold http://www.icmarkets.com/blog/monday-31st-august-weekly-technical-outlook-and-review-uk-bank-holiday-today/ you may recall that we mentioned to watch 1127.6 for a potential long entry. As you can see, price reacted beautifully to this level yesterday, and has so far rallied over 1000 pips! Well done to any of our readers who are currently long this market!
Since we see very little opportunity to trade this market right now, we’re going to assume that we managed to spot a long entry from 1127.6 and show how we’d look to manage the position. Hopefully this will help any newbie traders.
Firstly, we’d be watching how price reacts to Friday’s high marked with a green flag at 1140.8, and might, depending on what weakness the lower timeframe price action shows, liquidate part of our position and move stops to breakeven. In the event that price consumes offers here and heads towards 1147.7-1144.5 – a 4hr swap (supply) area, we’d definitely look to take off at least fifty percent of our position off here. Supposing that price continues to appreciate from here, the next upside targets fall in at the weekly swap (resistance) level at 1157.4, followed closely by a daily swap (resistance) level at 1167.2.
Trade carefully here guys and do not make the mistake of letting a clear winning trade turn into a losing one!
- Buys: Flat (Stop loss: N/A).
- Sells: Flat (Stop loss: N/A).


