A note on lower timeframe confirming price action…
Waiting for lower timeframe confirmation is our main tool to confirm strength within higher timeframe zones, and has really been the key to our trading success. It takes a little time to understand the subtle nuances, however, as each trade is never the same, but once you master the rhythm so to speak, you will be saved from countless unnecessary losing trades. The following is a list of what we look for:
- A break/retest of supply or demand dependent on which way you’re trading.
- A trendline break/retest.
- Buying/selling tails – essentially we look for a cluster of very obvious spikes off of lower timeframe support and resistance levels within the higher timeframe zone.
- Candlestick patterns. We tend to only stick with pin bars and engulfing bars as these have proven to be the most effective.
EUR/USD:
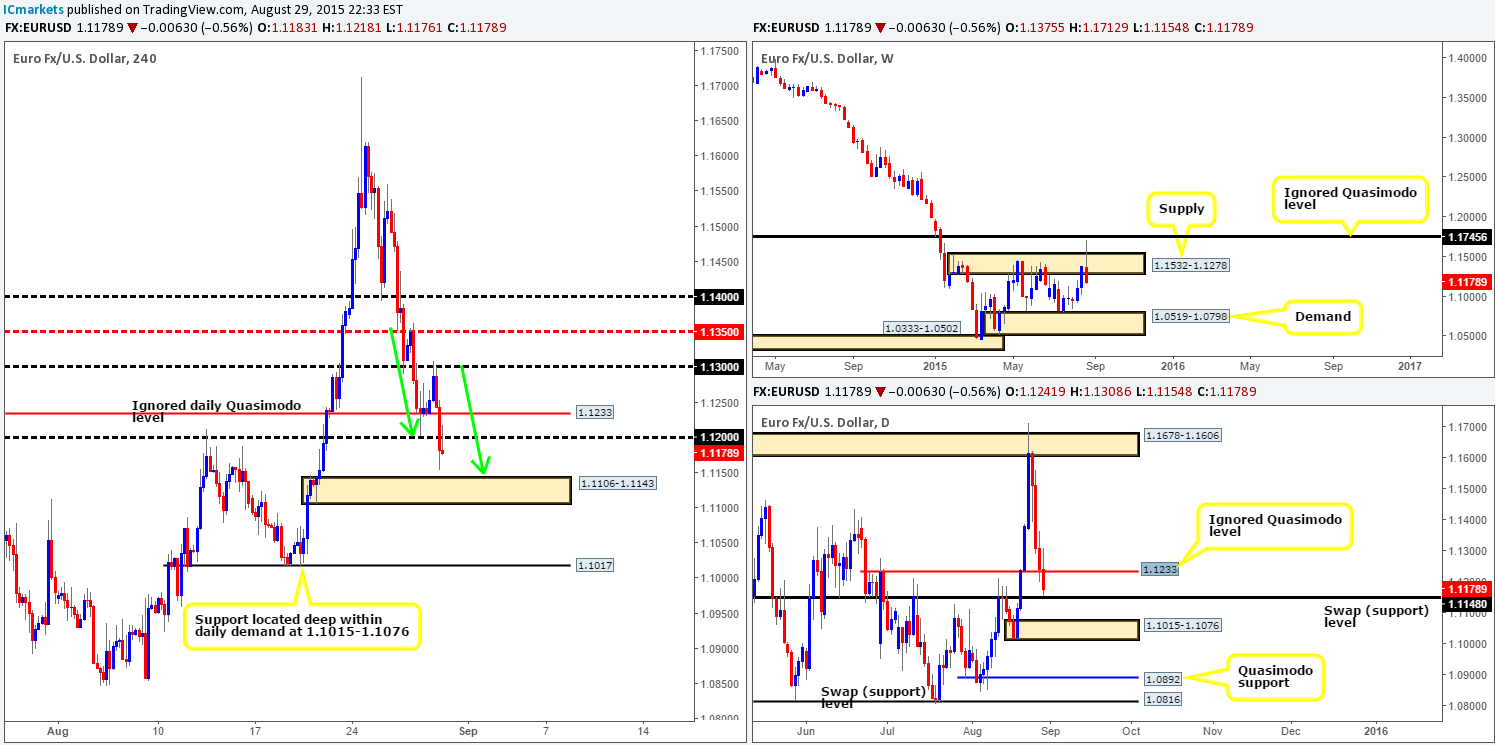
Weekly view: Weekly action shows that early on into last week’s trade the EUR/USD began positively. Price traded to fresh highs of 1.1712, breaking above a weekly supply zone at 1.1532-1.1278 which just missed connecting with an ignored weekly Quasimodo level at 1.1745. However, shortly after this the markets took a turn for the worst, dropping all in all a total of 560 pips on the week and closing back below the aforementioned weekly supply area into the close 1.1178. In the event that the sellers manage to hold the market below this supply zone this week, we may see further downside in the direction of weekly demand coming in at 1.0519-1.0798.
Daily view: it’s clear to see from this angle that the sell-off in the EUR/USD market began as early as Tuesday following a small fakeout above a daily supply area at 1.1678-1.1606. The week ended with price hitting and slightly rebounding from 1.1148 – a daily swap (support) level.
4hr view: From the 4hr chart, we can see that the ignored daily Quasimodo level at 1.1233 attempted to hold going into the European session on Friday, extending prices as high as the 1.1300 handle. For all that though, the EUR heavily sold off going into the London session, taking out not only 1.1233 but also 1.1200 as well, which, as you can see was retested as resistance going into the weekend.
Consequent to the points made above, we see very little reason why this market will not continue lower down towards 4hr demand at 1.1106-1.1143. This zone, at least in our opinion, is a critical juncture for this pair. If it holds firm, then we may see the EUR rally as it located directly beneath the aforementioned daily swap (support) level. In addition to this, there is also a ’mini’ AB=CD 4hr bullish pattern close to completing around this current 4hr demand, which could add weight to a possible bounce from here (green arrows). On the flip side, should this area give way, which is possible due to the location of price on the weekly timeframe, the EUR may head lower towards daily demand at 1.1015-1.1076.
Therefore, one could look to short from the 1.1200 region today as long as you’re ok with only a possible 1-1 risk/reward trade. Personally though, we’re going to adopt a ‘wait and see’ approach this week, and plan to analyze this market further once/if price reaches the 4hr demand zone mentioned above at 1.1106-1.1143, since there is a possibility for both a buy and sell trade from this area.
Levels to watch/live orders:
- Buys: Flat (Stop loss: N/A).
- Sells: Flat (Stop loss: N/A).
GBP/USD:
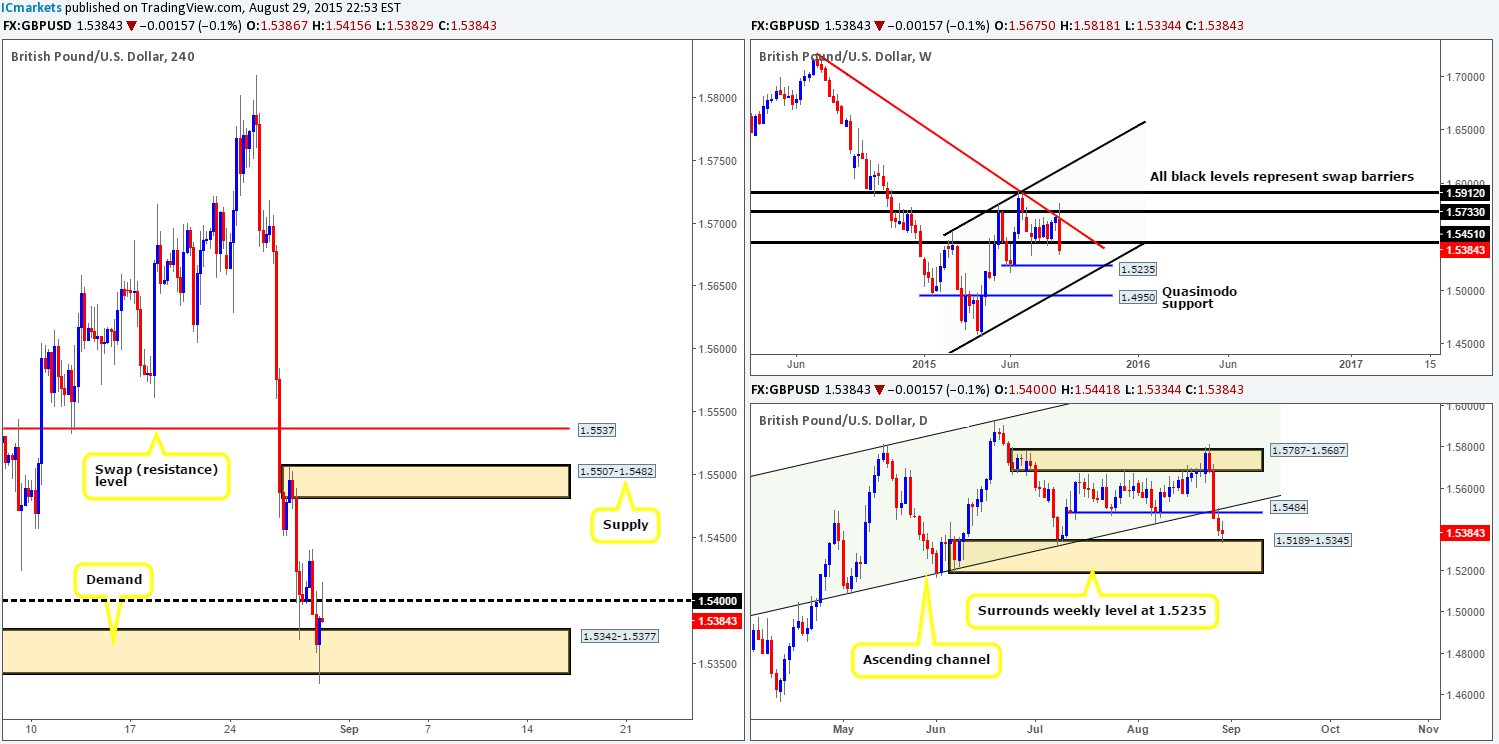
Weekly view: Pound Sterling took a turn for the worst last week; erasing a little over 300 pips of value which saw the GBP conclude trade at 1.5384. As a result of this recent downfall, the pair not only engulfed eight weekly candle bodies, but also closed below a weekly swap (support) level at 1.5451. With bids likely consumed around this weekly level, we could potentially see this market head lower this week down towards 1.5235.
Daily view: Daily action, however, shows that the recent four-day sell-off took out bids sitting around the1.5484 region, ending the week ended painting a daily indecision candle off the base of a daily demand zone at 1.5189-1.5345. This area, as you can probably see, also surrounds the weekly level mentioned above at 1.5235, so price may drive lower into the aforementioned daily demand this week before attempting to break higher from this zone. Near-term daily resistance now sits at 1.5484.
4hr view: Driving lower to the 4hr timeframe, we can see that during early trade on Friday, price attempted to extend higher from 1.5400, but only managed to reach highs of 1.5441 before tumbling lower. The move lower took out bids sitting at 1.5400 and drove below a 4hr demand zone coming in at 1.5342-1.5377, which was clearly enough to support a counter attack back up to 1.5400 into the close.
Now, from where current price is currently located on the 4hr timeframe it is very difficult to even guess which way the market will head today, let alone this week!
On the one hand, we have a 4hr bearish pin-bar candle spearing 1.5400, which could encourage sellers into this market. On top of that, the majority of traders who attempted to fade the 4hr demand area on Friday were likely stopped out by the small spike seen beneath. Therefore, along with what we’re seeing on the weekly scale (see above) the path could be clear for further selling.
On the other hand though, the 4hr bearish pin-bar candle may have been a consumption spike to rid offers around the psychological handle 1.5400, so price could potentially rally up to 4hr supply coming in at 1.5507-1.5482. This makes sense to us since let’s not forget where price is trading on the daily timeframe at the moment (see above).
As a result, our plan of attack will likely consist of waiting to see if either price closes above 1.5400 or below the 4hr demand. Should the former be seen, we’d then likely begin looking to enter long on the break/retest of 1.5400. If the latter, we’ll then look to trade the retest of this area, targeting another 4hr demand at 1.5256-1.5294. This target zone sits just above the aforementioned weekly level and also deep within current daily demand.
Levels to watch/ live orders:
- Buys: Watch for offers around 1.5400 to be consumed and then look to trade any retest seen at this number (confirmation required).
- Sells: Watch for bids around 1.5342-1.5377 to be consumed and then look to trade any retest seen at this area (confirmation required).
AUD/USD:
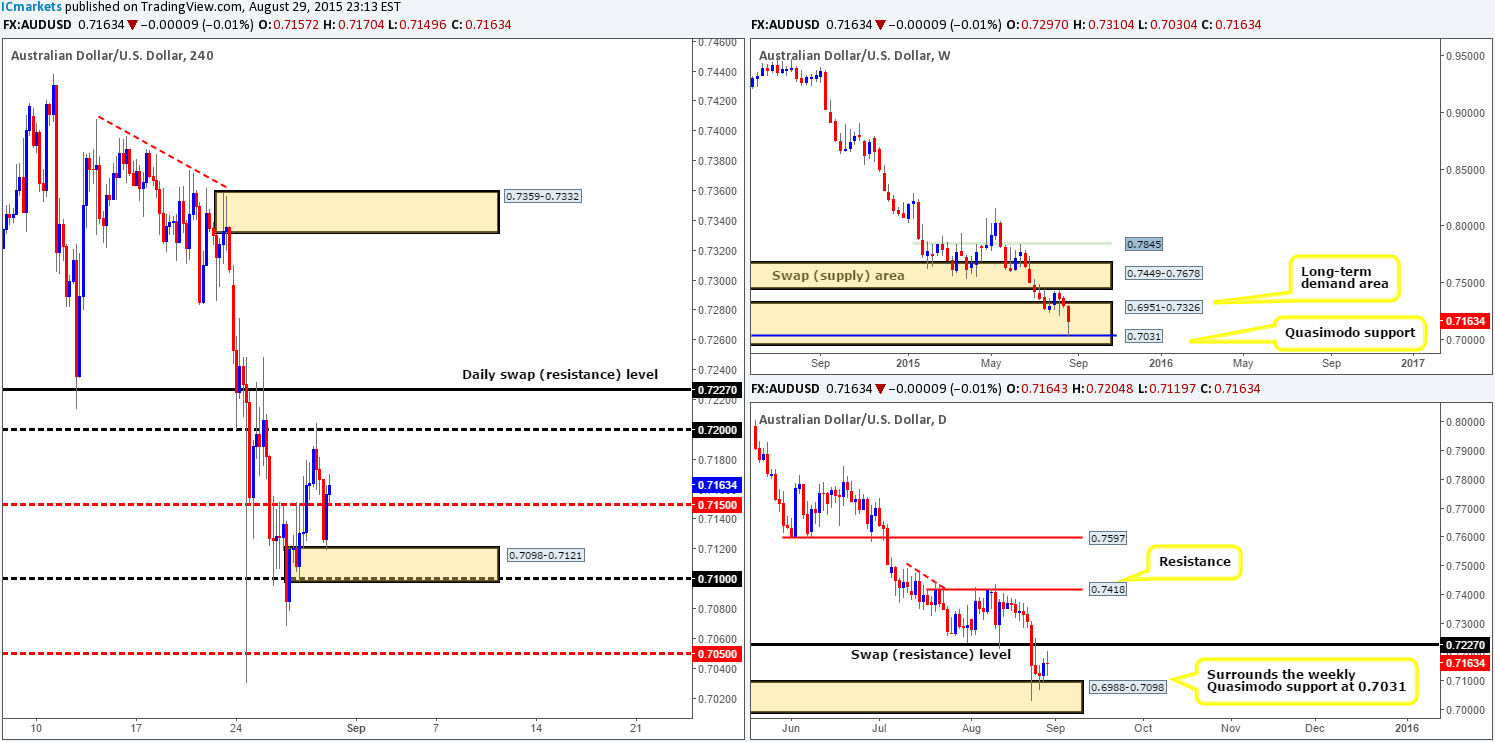
Weekly view: The Aussie dollar sustained further losses for a third consecutive week last week, erasing close to 150 pips. This sharp decline took place within the jaws of a weekly demand area at 0.6951-0.7326 and saw price connect with a weekly Quasimodo support level deep within at 0.7031. As you can see, a slight rebound was seen from this base, which, at least from this angle, is not really portraying much bullish strength at this time. Before we go making any further judgments, however, let’s see what the lower timeframes have to say on the matter…
Daily view: Moving down to the daily timeframe, recent action shows us that price sold off during Monday’s trade, which blasted through daily support at 0.7227 and connected with a daily demand zone at 0.6988-0.7098 (surrounds the aforementioned weekly Quasimodo support). Following this, the market spent the remainder of the week trading around the top-side limit of this barrier. Near-term resistance is currently sitting at the recently broken support at 0.7227. Therefore, there is not really much room for this market to appreciate until this barrier is consumed.
4hr view: After price shook hands with the underside of 0.7200 early Friday, a steady wave of offers filtered into this market. The mid-level support at 0.7150 was taken out and price collided into a 4hr demand zone coming in at 0.7098-0.7121. It was only once traders in the U.S began conducting business did we see a push higher from here, which consequently saw price close above and retest 0.7150, ending the week at 0.7163.
So, let’s see what we have here (all values for levels can be found above):
- Weekly chart shows price currently deep within demand at a weekly Quasimodo support.
- Daily chart reveals that the buyers and sellers are now trading mid-range between a daily demand zone and a daily swap (resistance) level.
- The 4hr action is trading just above mid-level support with room to move north up to 0.7200.
With this, we are relatively confident that the AUD/USD is heading higher today/this week at least until either 0.7200 or the aforementioned daily swap (resistance) level seen just above it. After that, it will once again be decision time. Therefore, our team has decided to keep a close watch on 0.7150 during Asia trade today for a potential lower timeframe buy entry at this level.
Levels to watch/ live orders:
- Buys: 0.7150 [Tentative – confirmation required] (Stop loss: dependent on where one confirms this level).
- Sells: Flat (Stop loss: N/A).
USD/JPY:
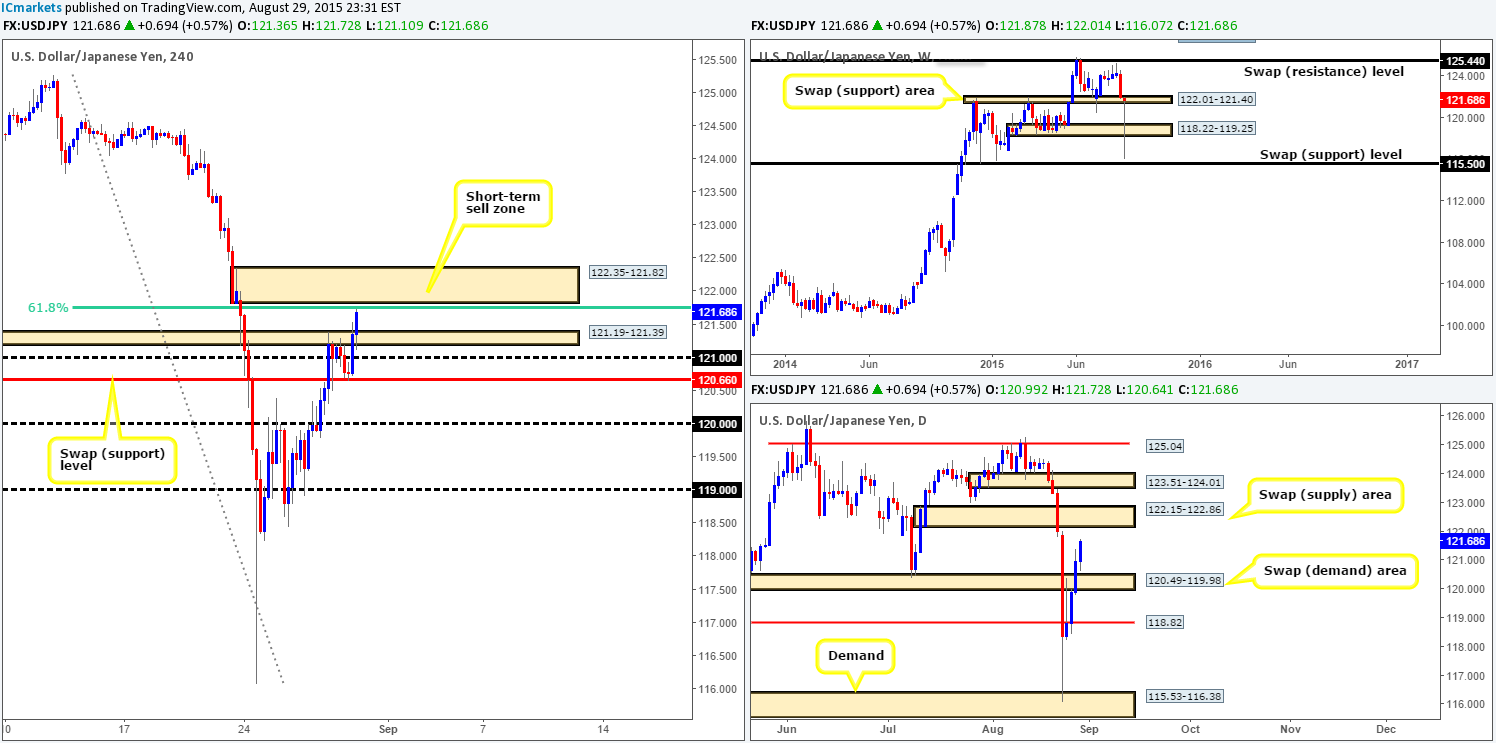
Weekly view: What a week the USD/JPY pair has had! This has to be one of the most vicious buying tails (pin-bar candles) we’ve seen in a long time! Although price was actually stretched close to 600 pips during last week’s trade, the market closed a mere thirty or so pips below the prior week’s close (122.01) at 121.68 within a weekly swap (support) barrier at 122.01-121.40.
Daily view: From the pits of the daily scale, we can see that the 600-pip sell-off spike seen on the weekly scale took place during one day’s trade – absolutely incredible! From Tuesday onwards, nonetheless, the market spent the week recouping its losses by pressing higher, forcing price to eventually wrap up the trade mid-range between a daily swap (demand) zone at 120.49-119.98, and a daily swap (supply) area at 122.15-122.86.
4hr view: For those who read our previous report http://www.icmarkets.com/blog/friday-28th-august-daily-technical-outlook-and-review/ you may recall us mentioning to keep an eye on the 4hr swap (support) level at 120.66 for a potential intraday bounce north on Friday. As we can all see, this played out perfectly and came within a small fraction of a pip of missing our take-profit level 121.73. Well done to any of our followers who managed to lock in some green pips from this move!
In view of price currently trading just below 4hr supply at 122.35-121.82, where do we see this market heading today/this week? Well, considering that the current 4hr area not only boasts a 61.8% Fibonacci resistance at 121.76/round-number resistance at 121.00, but also converges nicely with the underside of the aforementioned daily swap (supply) area at 122.15, we certainly have a bearish bias short-term. However, although price could effectively bounce south from here today, it may continue heading higher this week due to where price is presently located on the weekly timeframe (see above).
Therefore, to sum up, our team’s prime focus today will be on looking for (lower timeframe) confirmed short trades within the current 4hr supply zone. Should all go to plan, partial profits will quickly be taken within 121.19-121.39, followed closely by the 121.00/120.66 region. So all in all not great risk/reward, but depending on how high one is able to enter within the current 4hr supply, it could still yield 2:0 plus.
Levels to watch/ live orders:
- Buys: Flat (Stop loss: N/A).
- Sells: 122.35-121.82 [Tentative – confirmation required] (Stop loss: 122.55).
USD/CAD:
Weekly view: Upward momentum on this pair has certainly begun to diminish over the past six weeks. Although price moved around 220 pips during last week’s trade, the market closed only eighteen pips above the prior week’s close (1.3178) at 1.3196, once again placing current action close to the weekly swap (support) at 1.3128.
Daily view: Branching lower to the daily chart, we can see that price spent the majority of last week retesting bids around a daily swap (demand) area at 1.3246-1.3177. This area did indeed hold price, but only just! Friday’s trade, as you can see, formed a pretty heavy selling tail which could be considered an inverted pin-bar candle. The reason we say ‘could’ here simply comes down to this area’s clear deterioration from Wednesday onwards. It will be interesting to see what the 4hr timeframe has to offer…
4hr view: During the course of Friday’s sessions, price once again shook hands with the 4hr swap (demand) area at 1.3180-1.3140, which aggressively spring boarded this market over a 100 pips north up to just below 1.3300. However, sellers at this number were just as enthusiastic as price was smashed a 100 pips back down to just below 1.3200 to end the week.
So, with the points above taken on board, where do we see this market heading today and possibly into the week? Well, from Friday’s movements, it appears price is in the process of completing a D-leg of a possible 4hr AB=CD Harmonic bullish pattern around the 1.3120 region (see green circle). As such, with the market now trading below 1.3200, and the current 4hr swap (demand) area being visited for the third time in a week; we feel this market is heading lower at least in the short-term. Nevertheless, we do not consider this to be a sellers’ market due to where price is currently located on the higher timeframes (see above). Therefore, here are a list of potential buy levels we’ll be watching for confirmed buying opportunities today/this week:
- Friday’s low 1.3165. We’re not expecting much from this hurdle today, a small Asian session bounce at most.
- The 4hr AB=CD completion area around 1.3120. This may bounce price, but is not our most favored area to watch this week, as you’ll see when you read point three below.
- The psychological support 1.3100. This, along with the tasty looking 4hr demand zone coming in just below it at 1.3058-1.3091 is, in our opinion, a perfect barrier for well-funded traders to fakeout into from below the 4hr AB=CD reversal area.
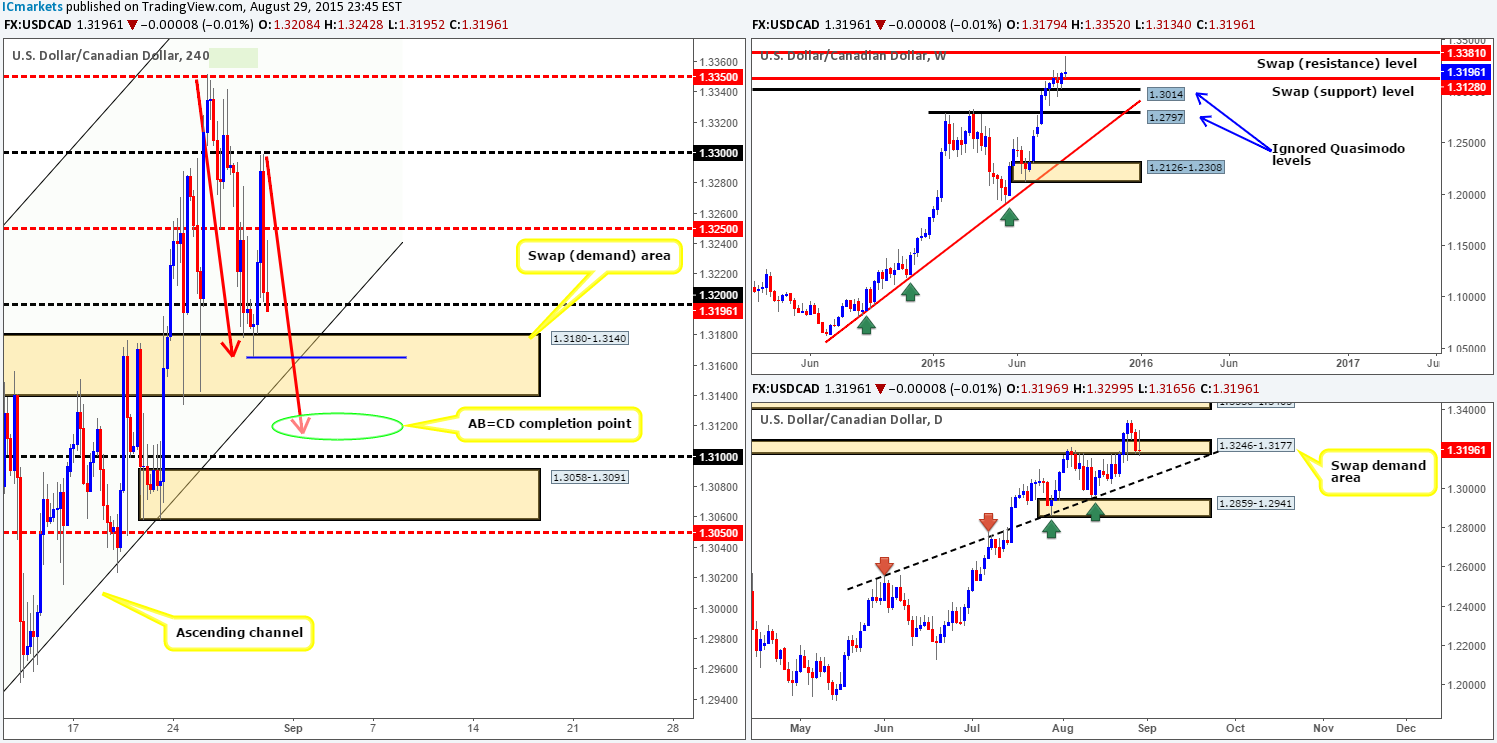
Levels to watch/ live orders:
- Buys: 1.3165 [Tentative – confirmation required] (Stop loss: dependent on where one confirms this level) 1.3120 region [Tentative – confirmation required] (Stop loss: dependent on where one confirms this area) 1.3100/1.3058-1.3091 Tentative – confirmation required] (Stop loss: dependent on where one confirms this area).
- Sells: Flat (Stop loss: N/A).
USD/CHF:
Weekly view: From this angle, we can see that price drove into weekly demand at 0.9149-0.9326 amid last week’s trade. This, as a result, propelled the USD/CHF a little over 400 pips into the close 0.9616, consequently gaining an overall 162 pips of value on the week. Should the buyers continue bidding the market this week, there is clear space for price to continue appreciating up to a weekly swap (resistance) level at 0.9796.
Daily view: Daily action on the other hand, shows that ever since price crossed swords with the daily trendline extended from the low 0.9077, the USD/CHF was clearly the place to be! The well-bid market took out not only daily resistance drawn from 0.9397, but also a daily swap (supply) base at 0.9597-0.9502, which, as you can see, ended the week with price retesting this area as demand. Like the weekly chart, there is also room on this timeframe for price to appreciate until at least the daily swap (resistance) level at 0.9712.
4hr view: Going into the early hours of Friday’s London session on the 4hr timeframe the USD/CHF sold off down to test the 0.9600 barrier, which, despite the three indecision candles that painted following this, held firm.
Given that there is room for this market to appreciate on both the weekly and daily timeframes; our team is naturally favoring longs over shorts this week. As such, here are two areas of interest we’ll be keeping a close eye on for confirmed buy trades:
- Obviously 0.9600 is of interest to us. Despite the indecision seen at this level on Friday it did still hold making it a level to keep an eye on during today’s trade. Upside targets from this number fall in at 0.9661, followed closely by 0.9700.
- The 4hr demand zone coming in below 0.9600 at 0.9511-0.9532. This is a super demand area in our opinion. It is not only fresh, but it also had fantastic momentum north from the base, and also not forgetting that is also located deep within the daily swap (demand) area mentioned above at 0.9597-0.9502. However, given that the 0.9500 number is lurking just below be PREPARED for a possible fakeout lower here!

Levels to watch/ live orders:
- Buys: 0.9600 [Tentative – confirmation required] (Stop loss: dependent on where one confirms this level) 0.9511-0.9532 [Tentative – confirmation required] (Stop loss: dependent on where one confirms this area).
- Sells: Flat (Stop loss: N/A).
DOW 30:
Weekly view: Like the USDJPY pair, the DOW 30 index had one very volatile week! In spite of price closing only 190 points above the prior week’s close (16489) at 16678, the market stretched a little over 1500 points all in all forming a humongous bullish weekly pin-bar candle in the process. This pin-bar not only pierced through a weekly Quasimodo level at 16261, but also tapped into bids sitting within weekly demand at 14717-15245. With this recent buying, and price now free of resistance until the weekly swap (resistance) level at 17135, it appears the DOW may continue to appreciate this week.
Daily view: Shifting a gear lower, price action on the daily timeframe shows that after Monday’s decline, price advanced higher recouping its losses and taking out two daily swap (supply) areas at 16078-15849/16459-16632. However, it was actually Friday’s candle close that was of most interest to our team. See how price retested the second daily area as support and printed a nice looking bullish buying tail (pin bar). This – along with room to move higher up to the next daily swap (supply) zone at 16895-17005 certainly adds weight to further buying being seen this week. Nonetheless, let’s see what the 4hr timeframe has to say on the matter…
4hr view: For those who read Friday’s report on the DOW http://www.icmarkets.com/blog/friday-28th-august-daily-technical-outlook-and-review/ you may recall us mentioning to watch for possible confirmed buy trades from 16475. As you can see, price just missed retesting this boundary by only a few points before rallying higher. Well done to any of our readers who are either still long this market or closed up shop with profits on Friday.
With both the weekly and daily timeframes appearing to still be in ‘buy-mode’, price will likely appreciate up to at least the 4hr supply at 16943-16827. Therefore, with all the points above taken on board, here is how we intend to approach this market this week:
- Unless offers around Thursday’s high 16705 push this market back down to the 16475 region, it will be difficult to enter long here with a favorable risk/reward. Should 16475 get tested again, however, we’ll then once again try to attempt to enter long from this base targeting 16789 just below the aforementioned 4hr supply zone.
- Once/ if price reaches this 4hr supply zone, entering long in this market or not closing out some of your current long positions could be a risky move. The reason comes from this supply area not only being fresh, but is also lurking just beneath a daily swap (supply) area at 16895-17005. Let’s put it this way we’d much prefer to be sellers here than buyers!
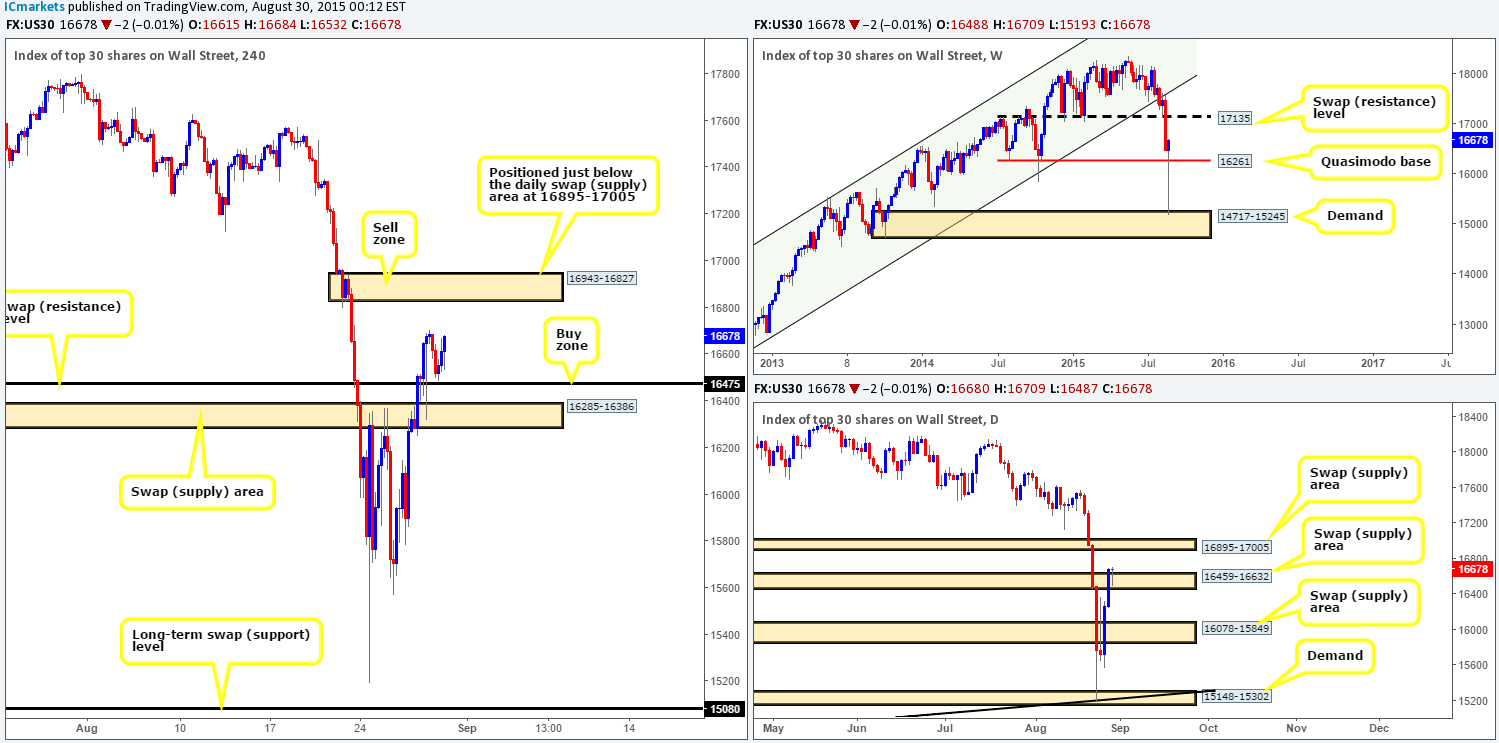
Levels to watch/ live orders:
- Buys: 16475 [Tentative – confirmation required] (Stop loss: dependent on where one confirms this level).
- Sells: 16943-16827 [Tentative – confirmation required] (Stop loss: 16989).
XAU/USD: (Gold)
Weekly view: Following two weeks of gains, renewed selling interest came into the Gold market last week from a weekly swap (resistance) level at 1157.4, bringing price down to test a weekly swap (support) level at 1130.1. As a result, Gold suffered around a $26 decline in value closing the week out at 1134.0.
Daily view: Rolling a page lower to the daily timeframe, however, shows us that despite the recent drop in value, buying pressure was seen coming into the market during Friday’s session from a fresh daily demand at 1109.4-1122.7. From this area, bids were able to push prices back above the aforementioned weekly swap (support) level, creating an almost perfect fakeout scenario.
4hr view: As already mentioned above, unlike the rest of last week, Friday’s session was the only bullish day. Price began this day well-bid taking out intraday 4hr resistance at 1127.6, which shortly after was retested as support twice (see black arrows) before climbing higher to consume offers around two 4hr supply zones at 1139.5-1133.0/1146.3-1139.8 (red arrows).
Taking into account the current location of price on the higher timeframe (see above) and the fact that offers are now likely weak overhead, Our team naturally favors the bulls this week. With that, here are some likely scenarios that may play out in the days to come:
- A third retest of 1127.6 could be seen. If this hurdle holds firm, a potential long entry from here may be possible, targeting the 4hr swap (supply) area at 1147.7-1144.5. Considering this level has already been stabbed twice, we’d advise waiting for lower timeframe confirming price action before risking capital to this idea.
- In the event that offers are indeed weak overhead, price could simply continue to appreciate during today’s trade and connect with the aforementioned 4hr swap (supply) area at 1147.7-1144.5. In this case we’ll remain flat due to the risk/reward being only a little over 1:0.
- Should 1127.6 give way this week, price will likely grind south down to 4hr demand at 1109.4-1116.1 (located deep within daily demand at 1109.4-1122.7). Now, even though we favor the bulls this week, we’re not one to pass up on an opportunity to trade. There could be, if price cleanly breaks below 1127.6 and retests this level as resistance, a short trade targeting 1117.2 – a few pips above the 4hr demand. Just to be on the safe side here though, we’d not sell without confirmation from the lower timeframes and only trade with 50% of our usual position.
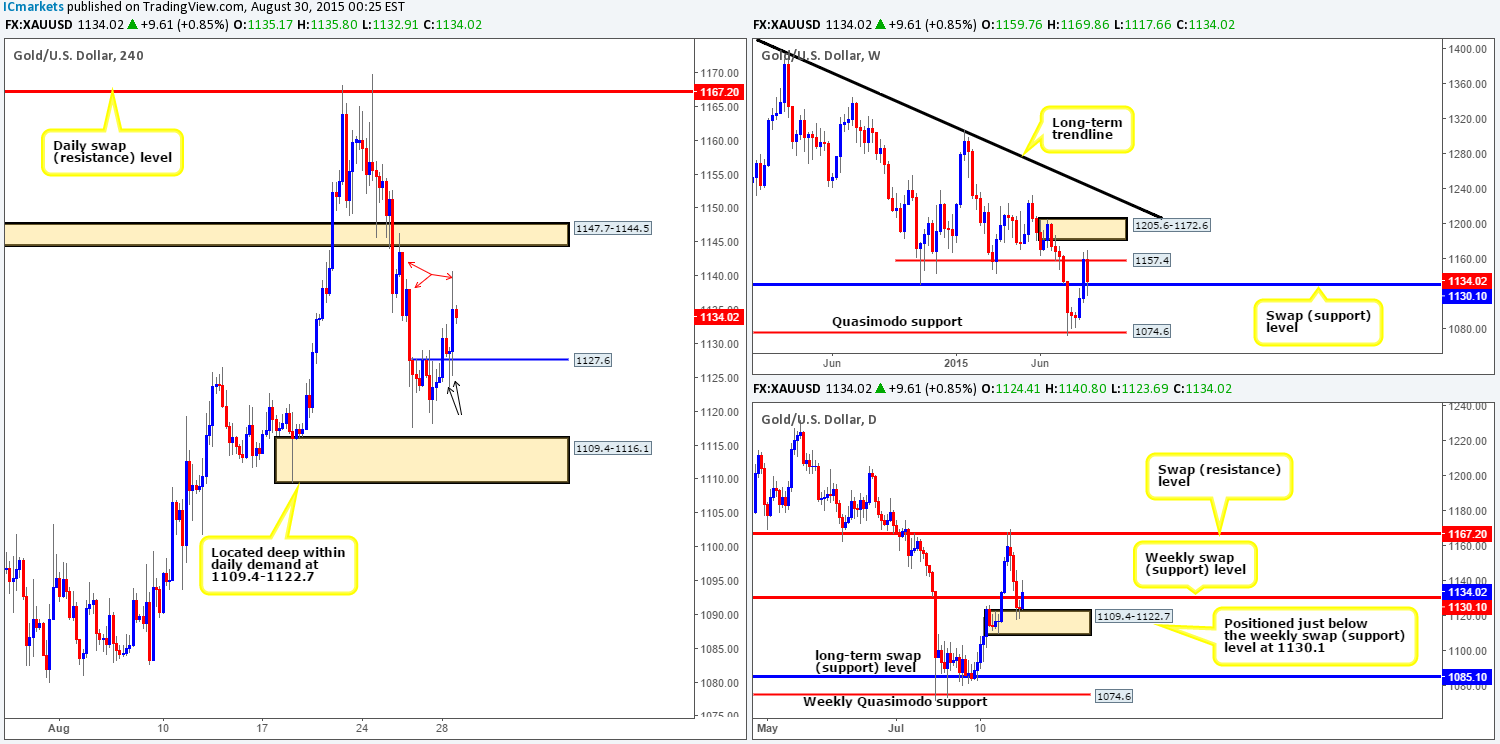
Levels to watch/ live orders:
- Buys: 1127.6 [Tentative – confirmation required] (Stop loss: dependent on where one confirms this level).
- Sells: Watch for bids around 1127.6 to be consumed and then look to trade any retest seen at this number (confirmation required).