
Key risk events today:
Australia Building Approvals m/m; Australia Cash Rate and RBA Rate Statement; FOMC Members Evans, Clarida, Bullard and Bowman Speak; UK Manufacturing PMI; EUR CPI Flash Estimate y/y; RBA Gov Lowe Speaks; Canadian GDP m/m; US ISM Manufacturing PMI; German Buba President Weidmann Speaks.
EUR/USD:
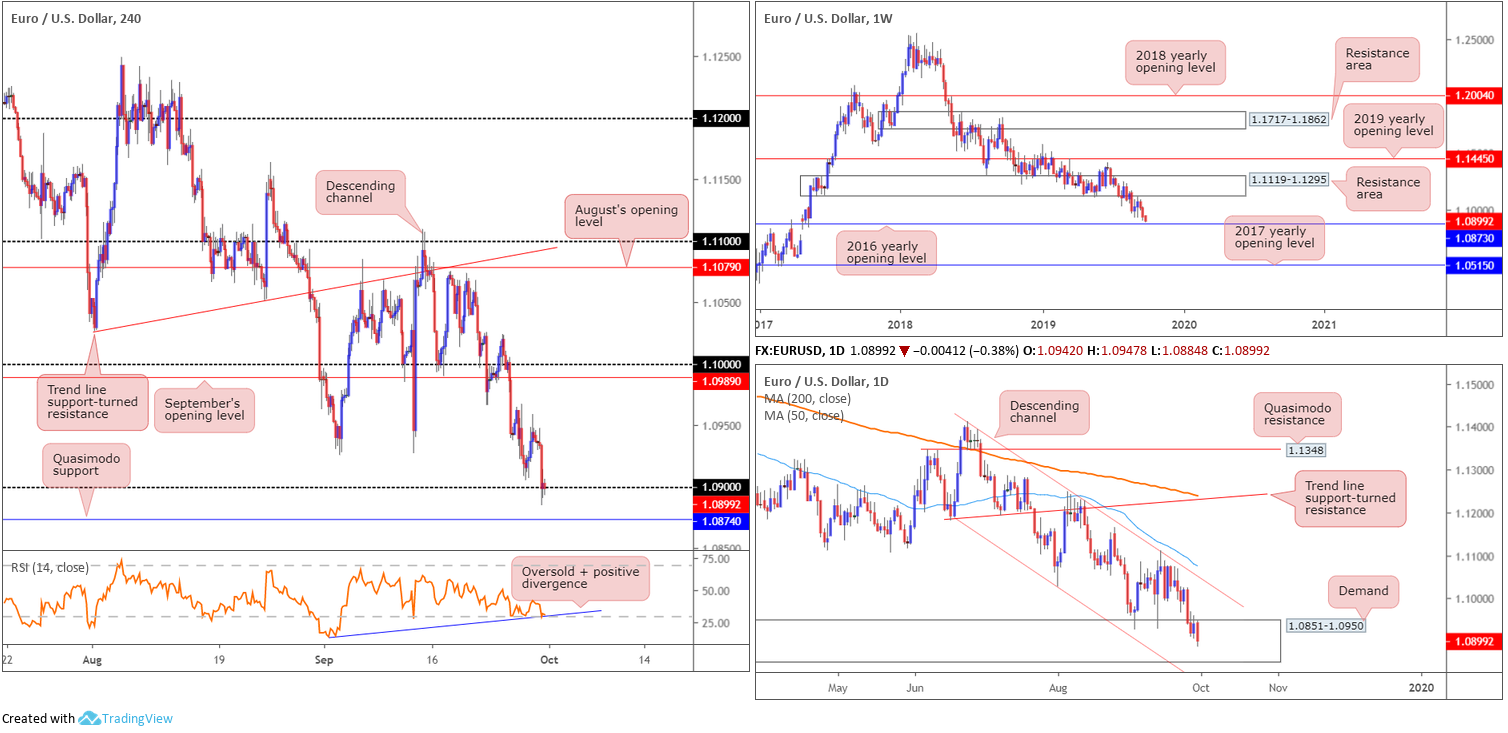
Europe’s single currency kicked off a fresh week ceding ground to its US counterpart, clocking levels not seen since May 2017 following less-than-stellar German inflation data.
Technical research reveals 1.09 suffered a whipsaw beneath its base Monday, likely tripping sell stops from traders attempting to fade the level and those seeking a breakout play. H4 Quasimodo support at 1.0874 remains the next viable floor sub 1.09. Indicator-based traders may wish to note the RSI is crossing swords with its oversold value and producing positive divergence.
Higher-timeframe analysis shows weekly price poised to approach notable support priced in at 1.0873, the 2016 yearly opening level. This follows a breach of long-standing demand-turned resistance area at 1.1119-1.1295 in August. Concerning long-term trend direction, since topping in early 2018 at 1.2555, the trend remains facing a southerly bearing.
Daily action finds itself back within the parapets of demand at 1.0851-1.0950 – formed April 2017 and houses the 2016 yearly opening level inside its lower bounds. In addition to this, price has remained compressing within a descending channel formation since late June (1.1412/1.1026), with the 50-day SMA (blue – 1.1081) trailing the upper limit.
Areas of consideration:
Based on the technical studies, as aired within Monday’s technical briefing, the following scenario remains in the offing:
With a well-placed weekly support at 1.0873 in sight, together with daily action testing demand, the H4 Quasimodo support level highlighted above at 1.0874 is likely of interest for longs. The key observation here, aside from higher-timeframe confluence, is the psychological number 1.09. This figure naturally entices stop-loss orders, which, in this situation, are asking to be filled. The break of 1.09 will fill sell stops, therefore providing liquidity for traders long out of 1.0874. Entering long is considered a countertrend trade, so strict trade management is essential.
Traders likely eye 1.0874 as an entry point, with protective stop-loss placement eyed beneath the low of the Quasimodo formation at 1.0839 (see May 2017).
GBP/USD:
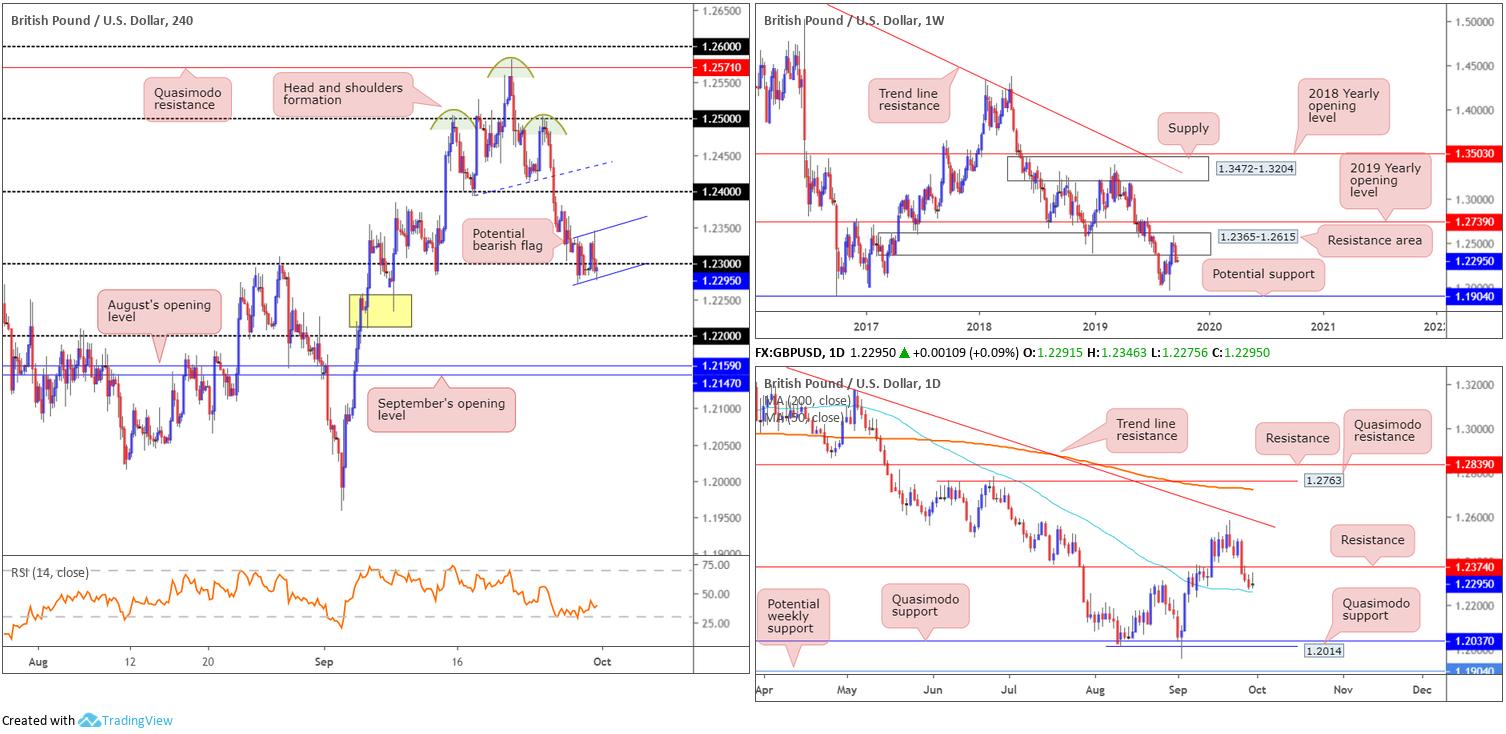
Despite ranging more than 70 points, GBP/USD movement concluded unchanged Monday as traders digested UK GDP data and ongoing Brexit-related drama.
The 1.23 handle on the H4 timeframe remains under siege, with a large portion of sell stops beneath its base possibly triggered. Considering the lacklustre close, much of the following analysis will air thoughts put forward in Monday’s technical research.
Beneath 1.23, traders face possible support off the 50-day SMA (blue – 1.2262) on the daily timeframe, with a break of this barrier perhaps exposing the 1.22 angle. The H4 demand marked in yellow at 1.2230/1.2256 is in a vulnerable position, according to chart studies, given 1.22 likely to act as a magnet to price. Above the 50-day SMA, resistance on the daily scale resides at 1.2374. In addition to this, recent H4 candlesticks begun forming a bearish flag (blue lines – 1.2336-1.2270).
Weekly flow, on the other hand, is seen exiting a long-term resistance area coming in at 1.2365-1.2615. Shedding more than 180 points last week, the near-full-bodied bearish close positions the spotlight back on support at 1.1904 – held price action strongly higher in October 2016.
Areas of consideration:
Having weekly action suggest further downside, traders may find use in the close beneath 1.23. Followed up with a retest, preferably by way of a H4 bearish candlestick signal (entry and risk can then be determined according to this pattern), this move has an initial target set at the 50-day SMA, with a break of this region likely clearing the pathway to 1.22.
Alternatively, a H4 bearish close formed beneath the current H4 bearish flag could be considered a trigger signal to short. Entry and risk can be set either based on the breakout candle’s construction, or entry on the back of the breakout candle close with a protective stop-loss order placed above the upper edge of the bearish flag (see above).
AUD/USD:
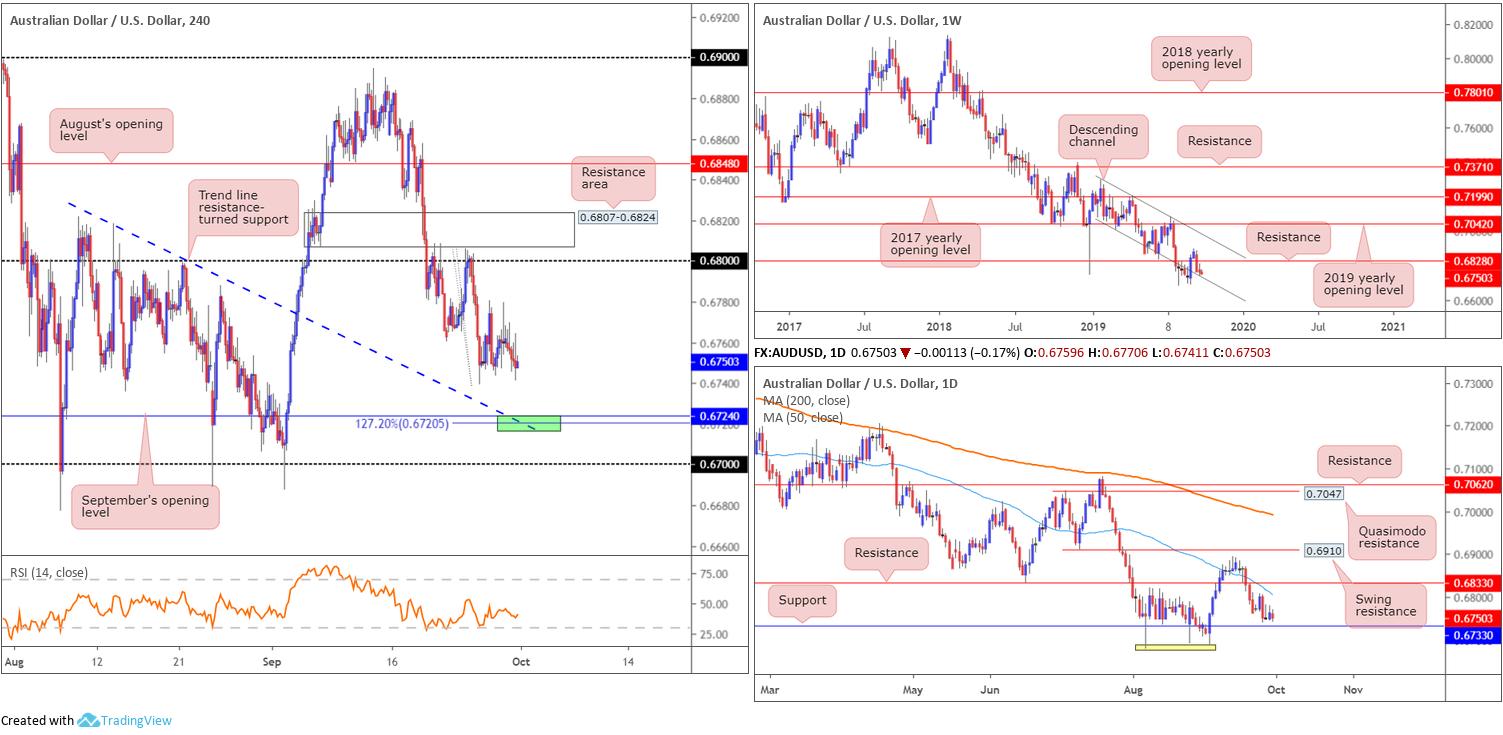
Monday had the Australian dollar a shade lower vs. the buck, down 0.18% ahead of today’s RBA rate decision. Having witnessed most of Monday’s movement form within Friday’s range, Monday’s outlook remains valid going forward.
From a weekly perspective:
The Australian dollar wrapped up the week unmoved against the buck last week, unable to overthrow channel support taken from the low 0.7003. To the upside, resistance resides close by at 0.6828, with a break of the aforementioned channel possibly exposing 0.6677, the YTD low. As is painfully obvious on the weekly chart, the long-term downtrend remains in full swing, and has done since early 2018.
The daily timeframe:
Support at 0.6733 remains a key fixture on the daily timeframe, as does resistance plotted at 0.6833. Also of interest is the 200/50-day SMAs both facing south. A break of the said support has a bottom formation to target around 0.6687 (yellow), followed by support at 0.6301 (not visible on the screen).
H4 perspective:
Traders appear wavering at present, buoyed currently by the weekly channel support (see above). Despite this, research on the H4 timeframe has September’s opening level at 0.6724 on the radar as potential support this week. Intersecting closely with a trend line resistance-turned support (taken from the high 0.6818) and a 127.2% Fibonacci extension point at 0.6720, the chances of a reaction forming off here is reasonably high. In addition to H4 confluence, daily support resides just north of the 0.6724 region at 0.6733.
To the upside, however, the 0.68 handle is in sight, shadowed by a resistance area at 0.6807-0.6824. Note this zone is sited just south of the daily resistance at 0.6833 and weekly resistance at 0.6828, and currently intersects with the 50-day SMA mentioned above on the daily timeframe.
Areas of consideration:
Outlook unchanged.
Should the H4 candles test 0.6724 this week, active buyers may make an appearance. For that reason, keep eyes on this area for signs of buying, preferably in the form of a H4 bullish candlestick formation (traders then have the choice of calculating entry and risk based on this structure).
A move higher, on the other hand, could see a test of the 0.68 handle and the H4 resistance area at 0.6807-0.6824, though sellers in this vicinity must be prepared for a fakeout to nearby higher-timeframe resistances, 0.6833 and 0.6828.
USD/JPY:
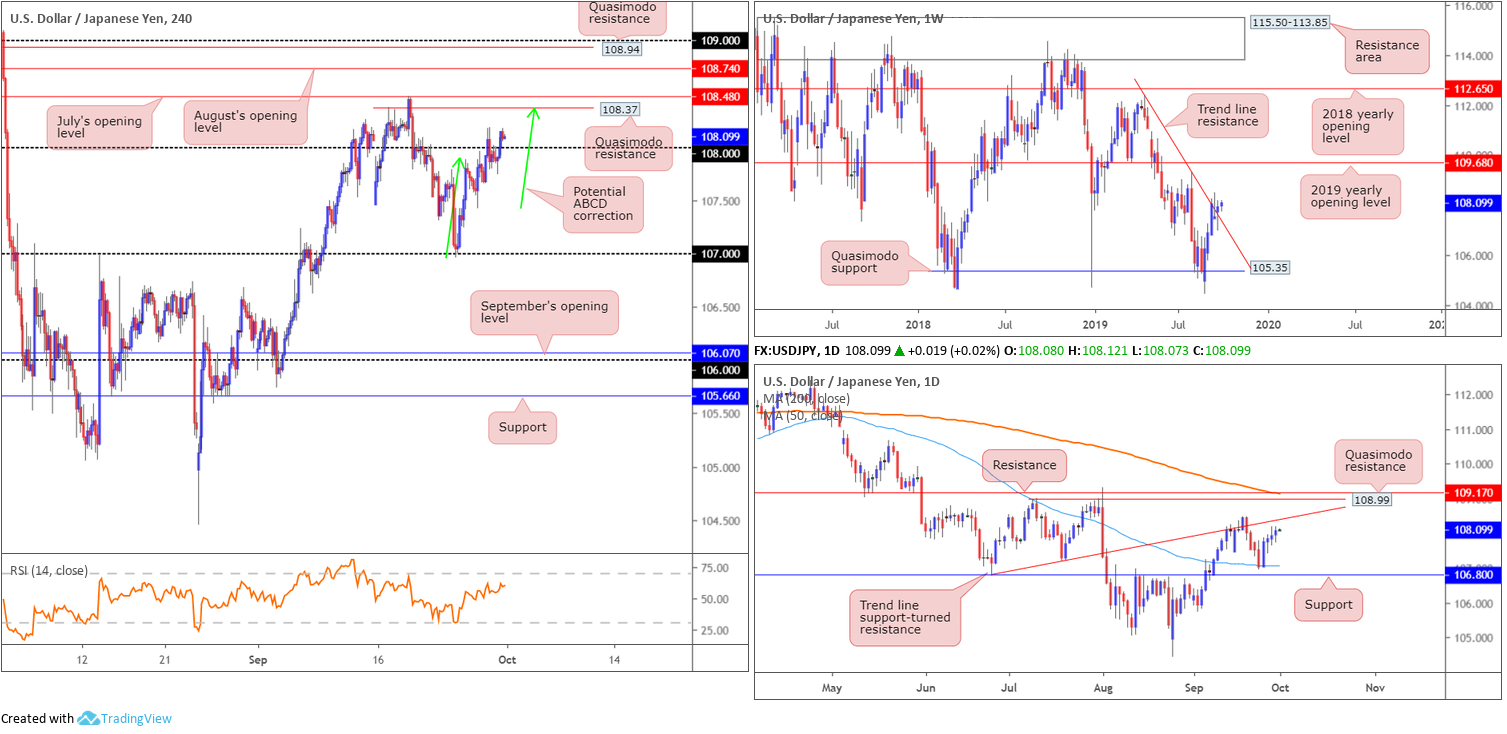
Although unable to conquer Friday’s range, the USD/JPY closed higher for a fourth consecutive session Monday, adding 14.8 points. US equities also rallied as did the US dollar index.
In terms of longer-term price, Monday’s technical report stated the following:
Trend line resistance (extended from the high 112.40), which held price action lower in the early stages of September, was mildly unseated last week. Entering long based on this breakout is likely of interest to many traders this week, though until the unit engulfs (closes above) the upper boundary of the prior week’s range (108.47), this could simply be a run of stops for a move lower.
Additional upside, nonetheless, could have the 2019 yearly opening level at 109.68 enter the mix, but a reaction off the 109.31 high may also occur.
Daily timeframe:
The 50-day SMA (blue – 107.07), sited a few points north of well-placed support at 106.80, held price action strongly higher Wednesday last week, placing trend line support-turned resistance (extended from the low 106.78) in view as the next upside target on the daily timeframe.
Structure positioned beyond the said trend line falls in at Quasimodo resistance at 108.99, closely trailed by another film of resistance at 109.17 and the 200-day SMA (orange – 109.15).
According to the H4 timeframe, the unit overthrew 108 to the upside Monday, placing the Quasimodo resistance level coming in at 108.37, followed by July’s opening level at 108.48 and August’s opening level at 108.74, in sight.
Areas of consideration:
Outlook unchanged.
Buy stops above 108, both from traders attempting to short the figure and those bidding a breakout, are likely of interest for a possible short off H4 Quasimodo resistance at 108.37. 108.37 also boasts a clear connection to the daily trend line support-turned resistance and a potential H4 ABCD correction (green arrows).
As underscored in Monday’s technical research, entry at 108.37 is an option, with a protective stop-loss order positioned either above July or August’s opening levels at 108.48 and 108.74, respectively, dependent on risk appetite. Downside expectation falls on a break back beneath 108: a cue to think about reducing risk to breakeven and liquidating a portion of the position.
USD/CAD:
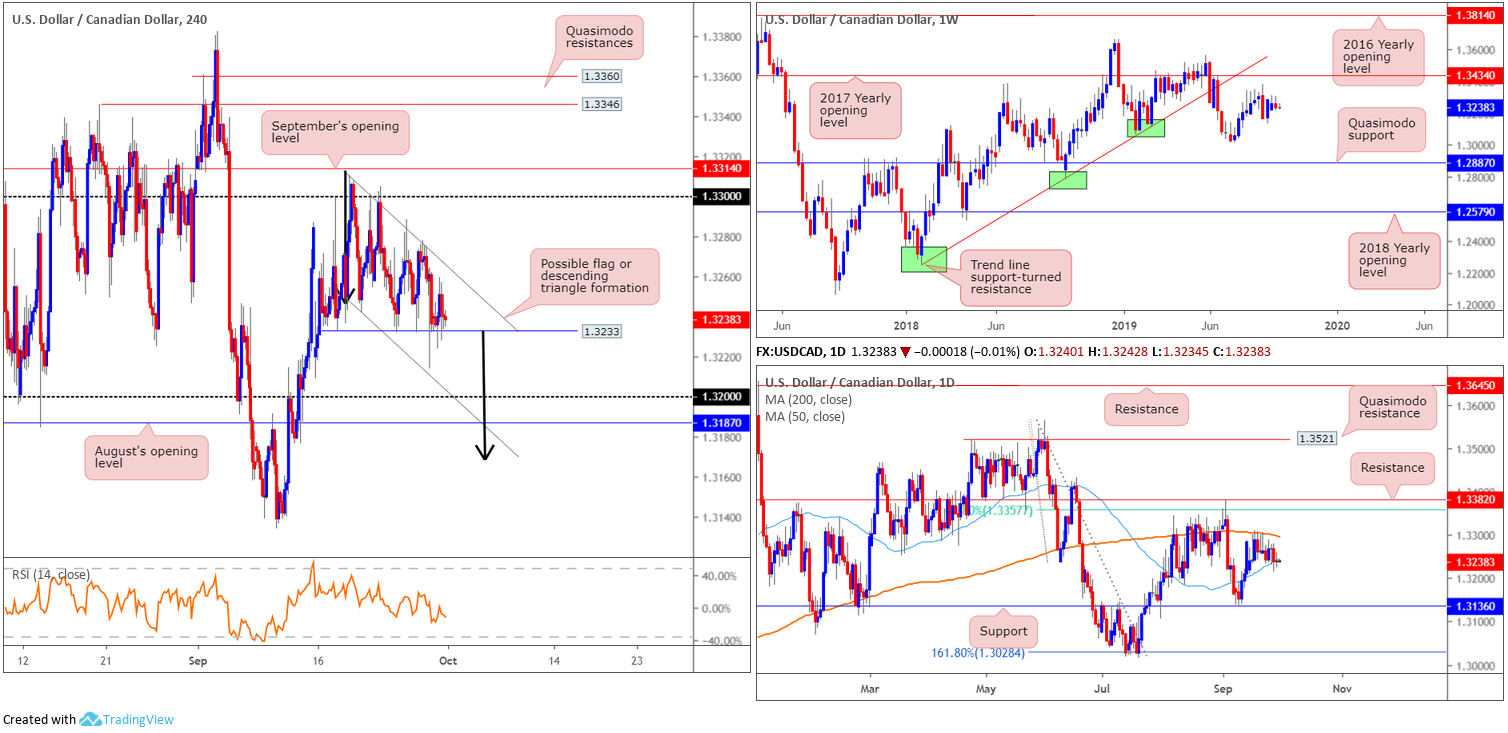
USD/CAD prices wrapped up Monday’s segment unmoved, with action confined within Friday’s range. As reported in Monday’s technical research, since September 19, the H4 candles have been carving out either a bullish flag (1.3310/1.3242) or a potential descending triangle formation, with support sited at 1.3233. H4 supports to be aware of beyond the said ranges can be seen at the 1.32 handle and nearby August’s opening level at 1.3187. Overhead, we have the 1.33 handle and September’s opening level at 1.3314 to contend with.
Looking at weekly price, the pair remains within last week’s range, which formed an inside bearish candle formation. Resistance is fixed at the 2017 yearly opening level drawn from 1.3434, closely lagged by trend line support-turned resistance extended from the low 1.2247. To the downside, the 1.3016 July 15 low represents potential support, followed by a Quasimodo formation at 1.2887.
Daily action, on the other hand, settled yesterday marginally beneath the 50-day SMA (blue – 1.3244), with the 200-day SMA plotted just above (orange – 1.3296) also slightly turning lower. Outside of these lines, traders likely have eyes fixed on support coming in at 1.3136 and resistance drawn from 1.3382, sited just north of a 61.8% Fibonacci ratio at 1.3357.
Areas of consideration:
Outlook unchanged.
Based on the technical chart studies, weekly price suggests a lower move this week, as does daily price after marginally closing beneath the 50-day SMA. This implies H4 price may continue to fill its current flagging formation and possibly complete the descending triangle pattern, with its take-profit target positioned beyond 1.32/1.3187 at 1.3168 (black arrows). Therefore, sellers, on the break of the H4 support level at 1.3233, are likely looking to get involved, targeting 1.3168, followed by a potential run to daily support at 1.3136.
USD/CHF:
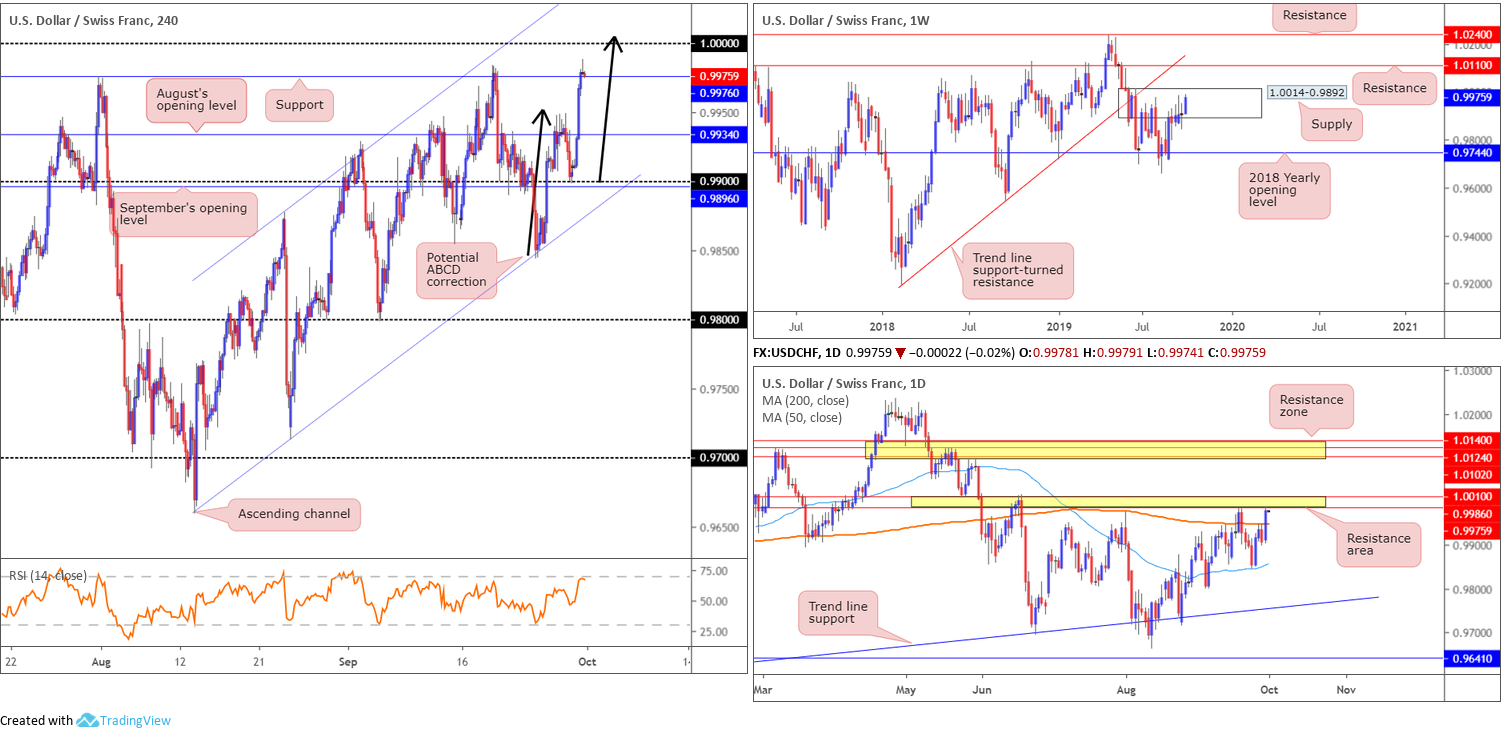
The Swiss franc, an underperformer against the buck, euro and pound, fell sharply Monday. Data out of Switzerland revealed the KOF Economic Barometer dropped to its lowest level since 2015. It now stands at 93.2 points, 2.3 points lower than in August (revised from 97.0 to 95.5 points). This – coupled with upbeat market sentiment and broad dollar bidding – drew the USD/CHF to a session high at 0.9987.
According to the H4 timeframe, recent upside dethroned August’s opening level at 0.9934 and resistance at 0.9977, with the latter currently being retested as support. The next upside target lies at the key figure 1.0000 (parity), which, as you can see, unites closely with a potential ABCD formation (black arrows) at 1.0006. Against the backdrop of medium-term activity, weekly price remains confined within the upper boundary of supply at 1.0014-0.9892, while daily price is seen shaking hands with a resistance area coming in at 1.0010/0.9986 (yellow).
Areas of consideration:
Many traders likely have 1.0000 on the radar this morning for probable shorts. Entry is possibly eyed at 1.0000, with stops set above weekly supply at 1.0014 (this then also covers the top edge of the daily resistance area as well [1.0010]). Conservative traders, nevertheless, may feel inclined to wait for additional candlestick confirmation before pulling the trigger. As a consequence, this will help identify seller intent and deliver entry/risk levels to trade.
Dow Jones Industrial Average:
Wall Street nudged higher in the last trading day of the quarter amid optimism surrounding US/China trade talks. The Dow Jones Industrial Average added 96.58 points, or 0.36%; the S&P 500 also added 14.94 points, or 0.50% and the tech-heavy Nasdaq 100 advanced 67.87 points, or 0.88%.
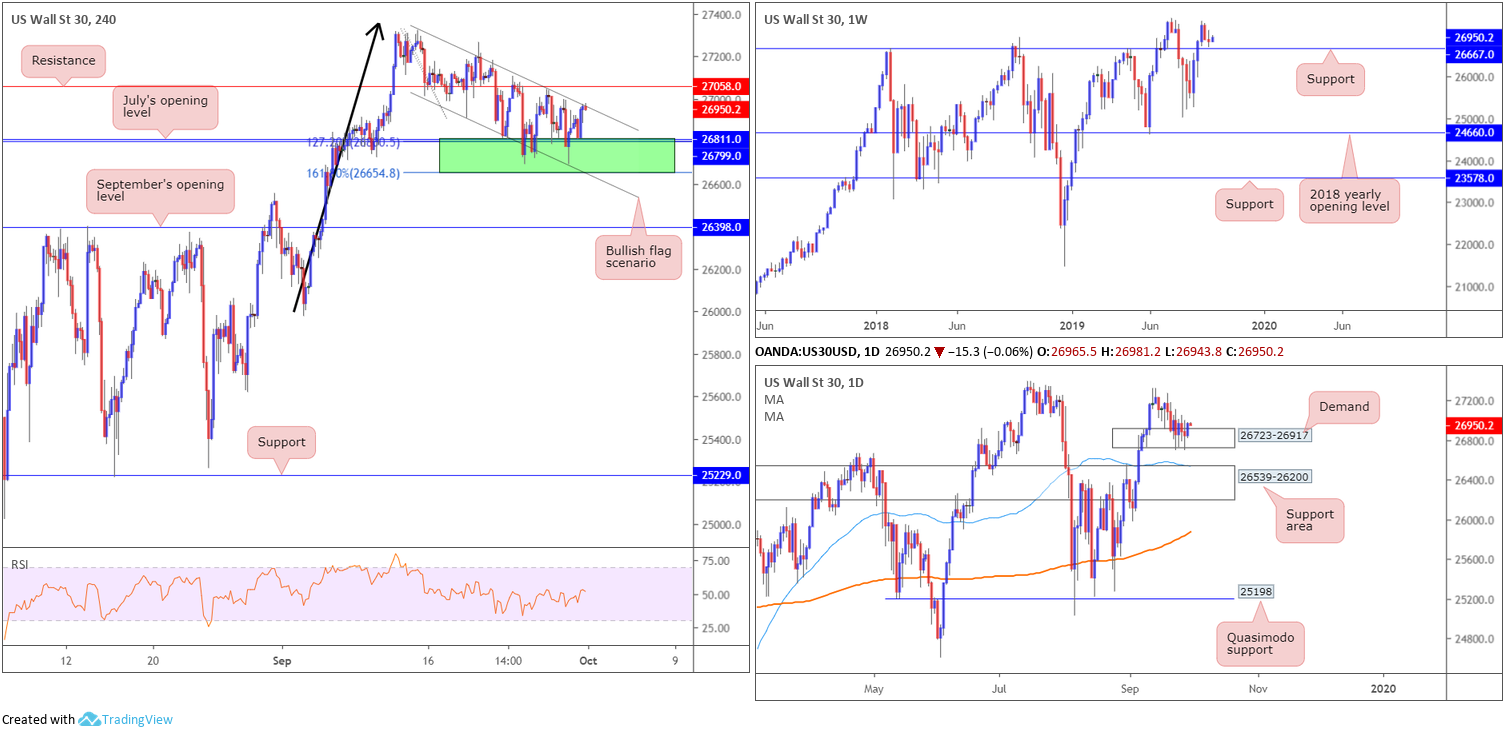
From a technical standpoint, the H4 support zone marked in green at 26654/26811, comprised of August and July’s opening levels at 26799 and 26811, respectively, the 127.2% Fibonacci extension value at 26800 and the 161.8% Fibonacci extension at 26654, remains intact. In addition to this, since topping mid-September the candles have been compressing within what appears to be a H4 bullish flag scenario (27321/26908). A firm breakout above this pattern, preferably followed by a run above H4 resistance parked at 27058, all-time highs at 27388 are then likely in the offing as the next upside target.
Much Like H4 flows, higher-timeframe structure remains pretty much unchanged (repeated from Monday’s technical briefing):
Weekly timeframe:
Down more than 300 points and forming a bearish inside candle formation the week prior, US equities extended losses last week, erasing more than 50 points ahead of prominent support coming in at 26667.
A decisive retest of the said support this week may entice buying, with an objective to challenge the all-time high 27388.
Daily perspective:
In response to recent selling, daily activity entered the parapets of fresh demand priced in at 26723-26917 and clipped the lower edge of the zone on a couple of occasions.
Failure to hold prices higher from here could result in the support area at 26539-26200 entering the fray, which aligns closely with a 50-day SMA (blue – 26542).
Areas of consideration:
Outlook unchanged.
A test of weekly support at 26667 could inspire a move higher this week. Confirmation of buyer intent, though, according to H4 structure, may materialise in the shape of a H4 candle close above the bullish flag and preferably resistance, highlighted above. Stop-loss orders can conservatively be positioned beneath the bullish flag’s lower limit, as the take-profit target, measured as the size of the preceding move (the black arrow) added to the breakout point, offers a favourable risk/reward ratio.
Traders, however, are still urged to consider the all-time high 27388 as the initial take-profit target, even if only as a cue to reduce risk to breakeven.
XAU/USD (GOLD):
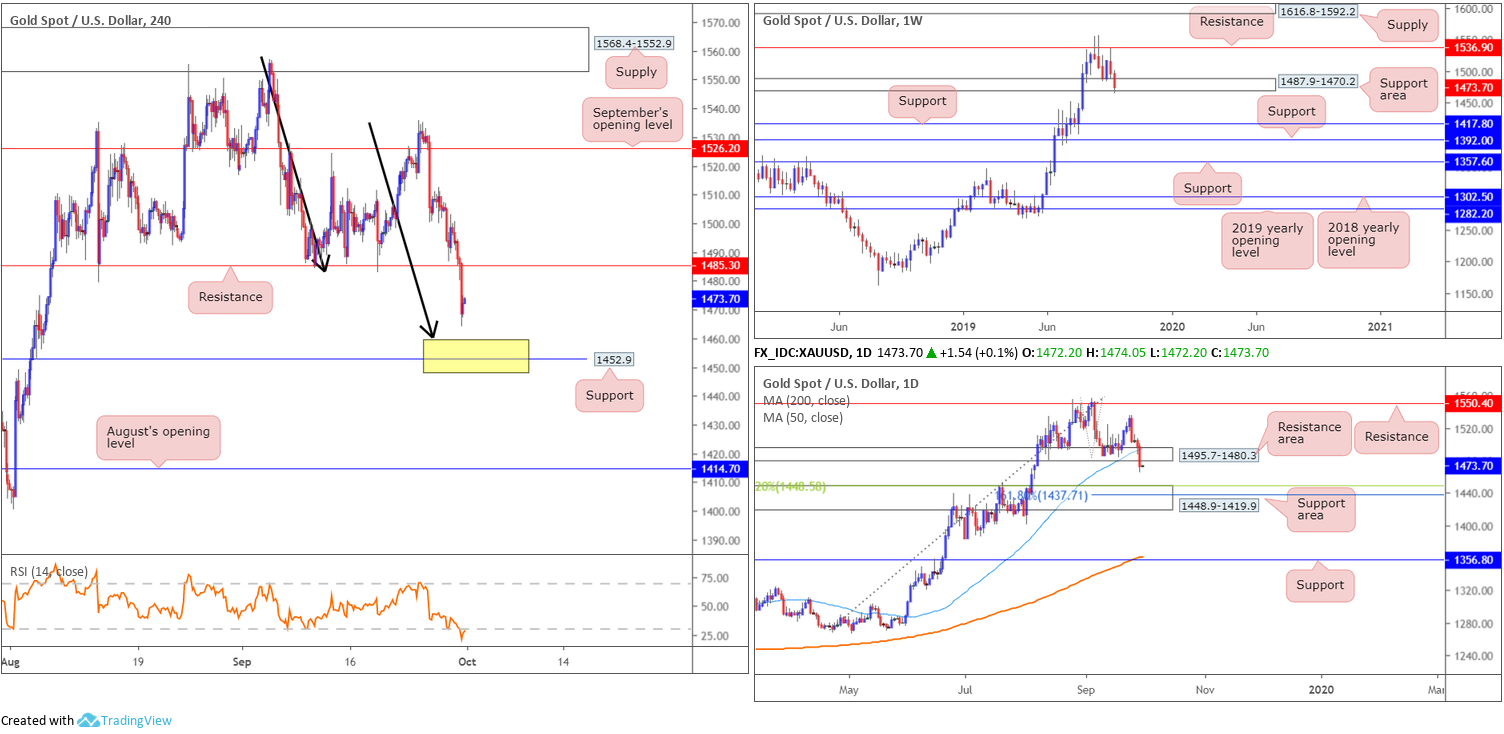
With US equities modestly rising across the board amid recovering market sentiment, and the US dollar index powering to fresh YTD highs of 99.46, the market witnessed the precious metal decline sharply Monday. Down 1.64% against the buck, weekly price clipped the lower edge of its support zone coming in at 1487.9-1470.2, albeit unlikely enough to trip a large portion of sell stops on this timeframe, though plenty to have buyers concerned.
Daily price engulfed its support area at 1495.7-1480.3 (now acting resistance zone) and also closed beneath the 50-day SMA (blue – 1494.9), suggesting a bearish vibe may be ahead. A move lower could bring in the support area at 1448.9-1419.9, which aligns with a 38.2% Fibonacci ratio at 1448.5 and a 61.8% Fibonacci ratio at 1437.7.
Across the page on the H4 timeframe, recent selling pressured the candles through support at 1485.3 (now acting resistance). Although the yellow metal partially bottomed into the close yesterday, it did so ahead of a rather attractive area of support: support at 1452.9 and an AB=CD completion point at 1460.2 (black arrows). Included within the yellow zone (marks the bottom of the base actually) is also the top edge of the daily support area at 1448.9-1419.9, which, as underlined above, holds a 38.2% Fibonacci ratio, too.
Areas of consideration:
The yellow H4 zone highlighted above at 1448.9/1460.2 is a potential reversal zone, boasting strong odds of hauling price to 1485.3 if tested. Entry at the top edge of the zone is, of course, an option, with a stop-loss order sited beneath 1448.9. This offers nearly 1:2 risk/reward. Alternatively, conservative traders might opt to wait for additional confirmation to form before pulling the trigger. Either way, the first upside target resides at 1485.3.
The accuracy, completeness and timeliness of the information contained on this site cannot be guaranteed. IC Markets does not warranty, guarantee or make any representations, or assume any liability regarding financial results based on the use of the information in the site.
News, views, opinions, recommendations and other information obtained from sources outside of www.icmarkets.com.au, used in this site are believed to be reliable, but we cannot guarantee their accuracy or completeness. All such information is subject to change at any time without notice. IC Markets assumes no responsibility for the content of any linked site.
The fact that such links may exist does not indicate approval or endorsement of any material contained on any linked site. IC Markets is not liable for any harm caused by the transmission, through accessing the services or information on this site, of a computer virus, or other computer code or programming device that might be used to access, delete, damage, disable, disrupt or otherwise impede in any manner, the operation of the site or of any user’s software, hardware, data or property.


