Waiting for lower timeframe confirmation is our main tool to confirm strength within higher timeframe zones, and has really been the key to our trading success. It takes a little time to understand the subtle nuances, however, as each trade is never the same, but once you master the rhythm so to speak, you will be saved from countless unnecessary losing trades. The following is a list of what we look for:
- A break/retest of supply or demand dependent on which way you’re trading.
- A trendline break/retest.
- Buying/selling tails/wicks – essentially we look for a cluster of very obvious spikes off of lower timeframe support and resistance levels within the higher timeframe zone.
- Candlestick patterns. We tend to stick with pin bars and engulfing bars as these have proven to be the most effective.
We typically search for lower-timeframe confirmation between the M15 and H1 timeframes, since most of our higher-timeframe areas begin with the H4. Stops are usually placed 1-3 pips beyond confirming structures.
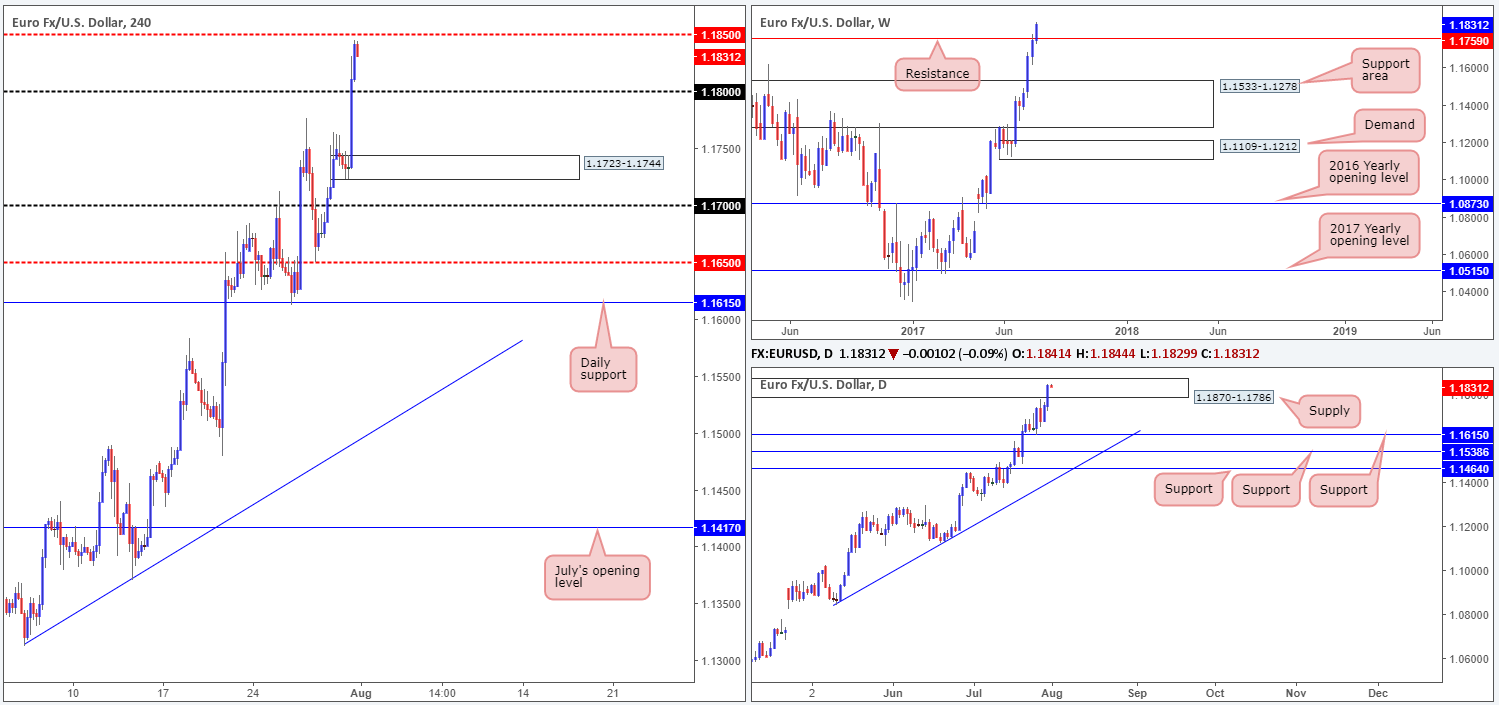
EUR/USD:
In recent trading, the single currency climbed to a high of 1.1845. The 1.18 handle was, as you can see, taken out with relative ease, allowing daily price to gravitate higher into the walls of supply coming in at 1.1870-1.1786. While this daily supply zone is considered strong, we are a tad anxious at the moment. Weekly price recently crossed above resistance at 1.1759, which could, if the bulls remain in a dominant position, further encourage buying up to a weekly resistance planted at 1.2044.
Our suggestions: For those who have shorted this market, with stops conservatively placed above the current daily supply zone, there’s still a chance the bears may make an appearance, despite the strong weekly push above weekly resistance. We decided to pass here and focus our efforts more on the GBP/USD, as you’ll see below.
Data points to consider: US ISM manufacturing PMI at 3pm GMT+1.

Levels to watch/live orders:
- Buys: Flat (stop loss: N/A).
- Sells: Flat (stop loss: N/A).
GBP/USD:
Of late, we can see that the GBP/USD extended higher, reaching fresh highs of 1.3223 in the process. As a result of this, weekly price is now seen trading beyond the walls of supply at 1.3120-1.2957. However, technically speaking, it is far too early in the week to tell if this move north suggests further upside to the Quasimodo resistance planted at 1.3371.
Down on the daily picture, yesterday’s move brought the unit into contact with supply drawn from 1.3278-1.3179, which as we mentioned in Monday’s analysis, is overflowing with confluence. We have a trendline resistance taken from the high 1.3477, a channel resistance drawn from the high 1.2903 and two converging AB=CD (green/orange arrows) 127.2 Fib extensions at 1.3222/1.3223 (taken from the lows 1.2811/1.2365). Also, for you RSI fans, there is daily divergence in play, as well.
Moving across to the H4 timeframe, price recently tested an AB=CD bearish pattern (black arrows) that completes a few pips above the 1.32 handle at 1.3207 (the 127.2% Fib ext.). This – coupled with the daily structures mentioned above – forms incredibly attractive confluence.
Our suggestions: In light of the above, our team is now short from 1.3209, with conservative stops planted at 1.3280 (two pips above the top edge of daily supply). Ultimately, we’re now looking for H4 price to cross back below the 1.32 handle, and touch gloves with the mid-level number 1.3150. It will be here that we’ll consider reducing risk to breakeven.
Data points to consider: UK manufacturing data at 9.30am. US ISM manufacturing PMI at 3pm GMT+1.

Levels to watch/live orders:
· Buys: Flat (stop loss: N/A).
· Sells: 1.3209 ([live] stop loss: 1.3280).
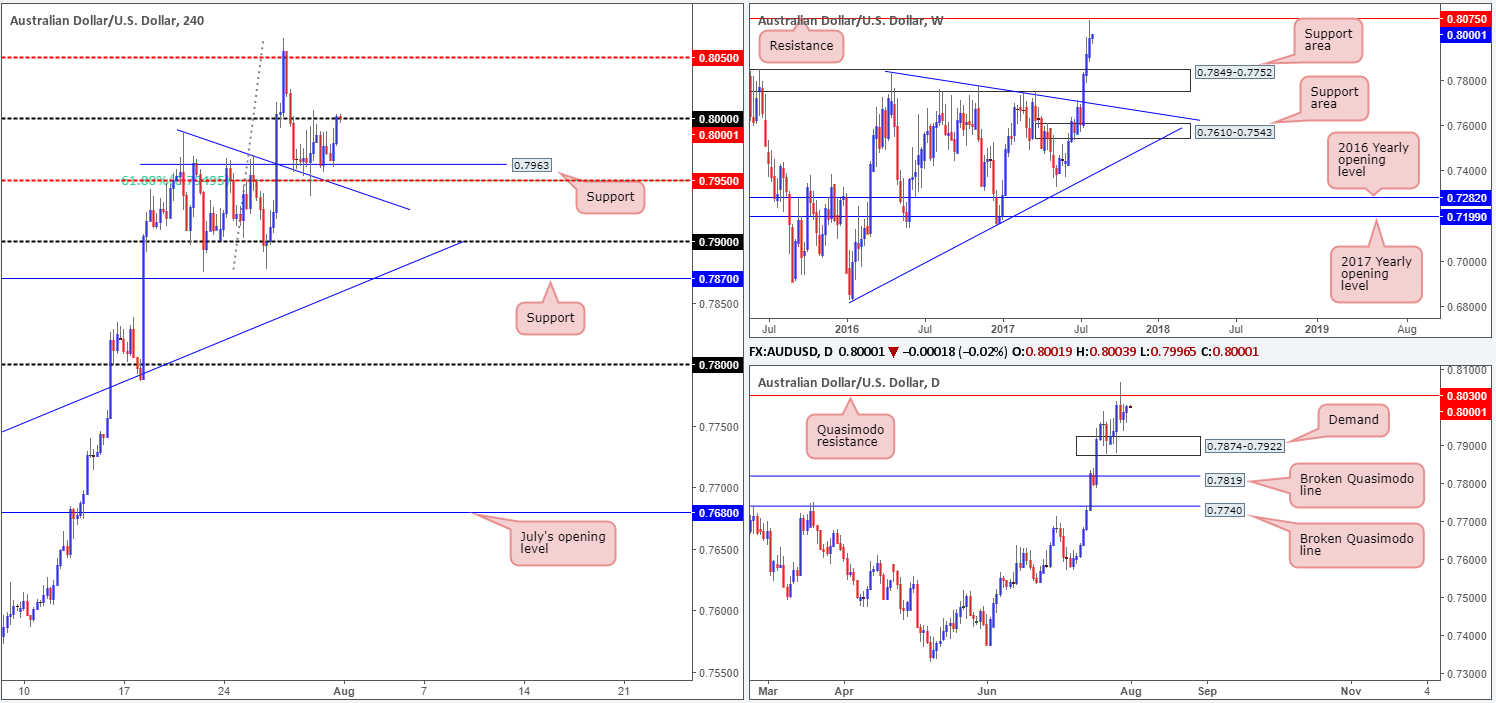
AUD/USD:
Since Thursday, the commodity currency has been seen consolidating between the 0.80 handle and a H4 support at 0.7963 (converges with a H4 trendline support taken from the high 0.7987, a nearby H4 mid-level support at 0.7950 and also a H4 61.8% Fib support at 0.7950 drawn from the low 0.7877). As can be seen from the H4 window, the bears are beginning to make an appearance around 0.80 which could signal a downside move to the 0.7963 neighborhood.
On the weekly timeframe, the pair came within touching distance of a weekly resistance pegged at 0.8075 last week. Should this encourage sellers into the market, we could see price trade as low as the weekly support area marked at 0.7849-0.7752. In conjunction with the weekly timeframe, the daily Quasimodo resistance at 0.8030 managed to cap upside on Thursday, which could lead to a move being seen down to daily demand located nearby at 0.7874-0.7922. A break below this area, nonetheless, would almost immediately bring one into close contact with the top edge of the said weekly support area, which, as you can see, also holds a daily broken Quasimodo line at 0.7819 within.
Our suggestions: Ultimately, we do believe the Aussie is heading lower and will eventually close below this current H4 range. Usually, this would signal a potential sell trade, but with top edge of the current daily demand sited at 0.7922, we will likely pass. Therefore, for now at least, our team has decided to remain on the sidelines.
Data points to consider: RBA Rate statement at 5.30am. US ISM manufacturing PMI at 3pm GMT+1.
Levels to watch/live orders:
· Buys: Flat (stop loss: N/A).
· Sells: Flat (stop loss: N/A).
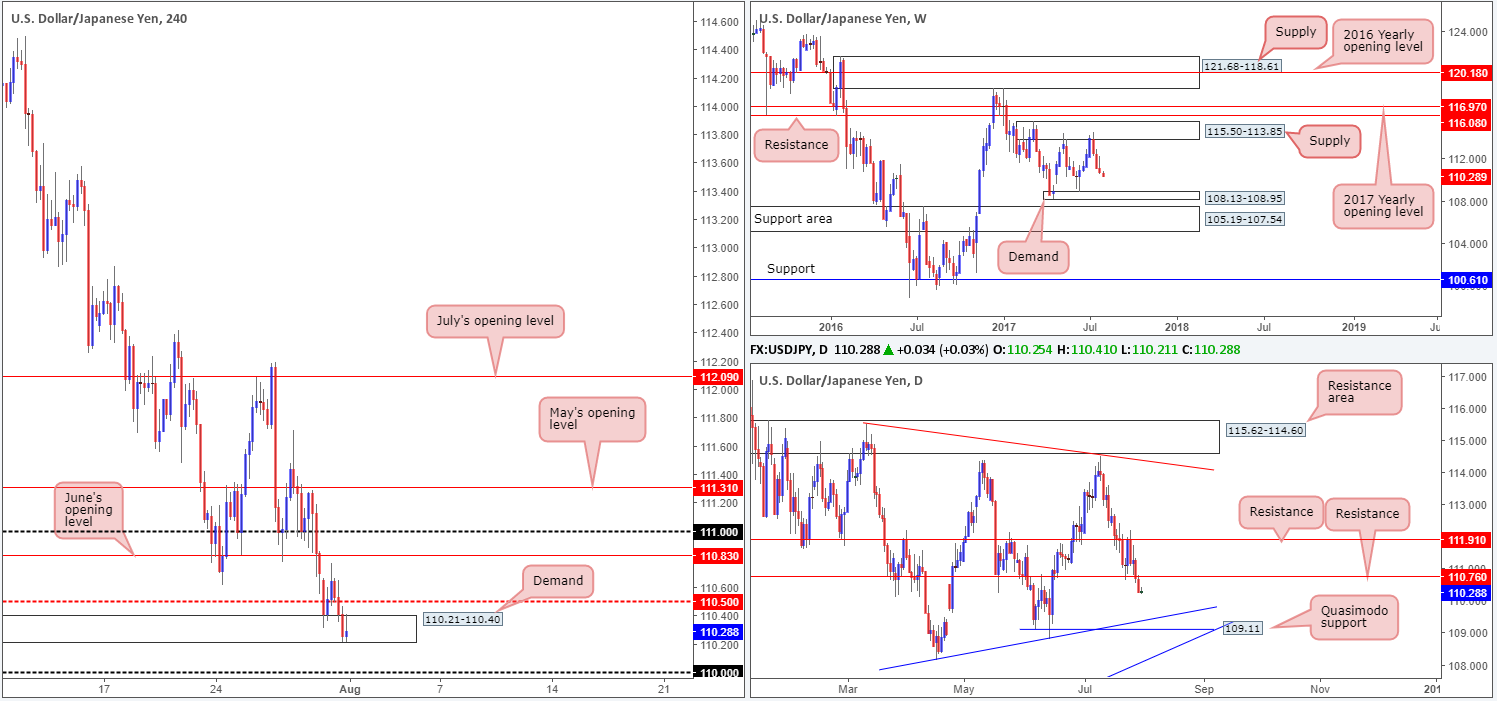
USD/JPY:
For those who read Monday’s report, you may recall us underscoring the H4 demand area at 110.21-110.40 as a high-probability buy zone. As you can see, price did respond nicely to this area, but fell short ten pips of the overall take-profit target: June’s opening level at 110.83. The demand itself, although appears to be under pressure at the moment, remains intact for the time being. For how long though is difficult to judge.
From the weekly timeframe, the market looks as though it could continue to press lower until we reach the small demand base seen at 108.13-108.95.Zooming in and looking at the daily picture shows us that price concluded Monday’s segment closing beyond support at 110.76. In theory, this move could have potentially cleared the river south down to a Quasimodo support logged at 109.11, which happens to unite closely with a trendline support etched from the low 108.13.
Our suggestions: With the higher-timeframe picture suggesting that further selling could be on the cards, we would not advise buying this market right now. Selling is also challenging given that the 110 handle is lurking just below the current H4 demand base.
Data points to consider: US ISM manufacturing PMI at 3pm GMT+1.
Levels to watch/live orders:
· Buys: Flat (stop loss: N/A).
· Sells: Flat (stop loss: N/A).
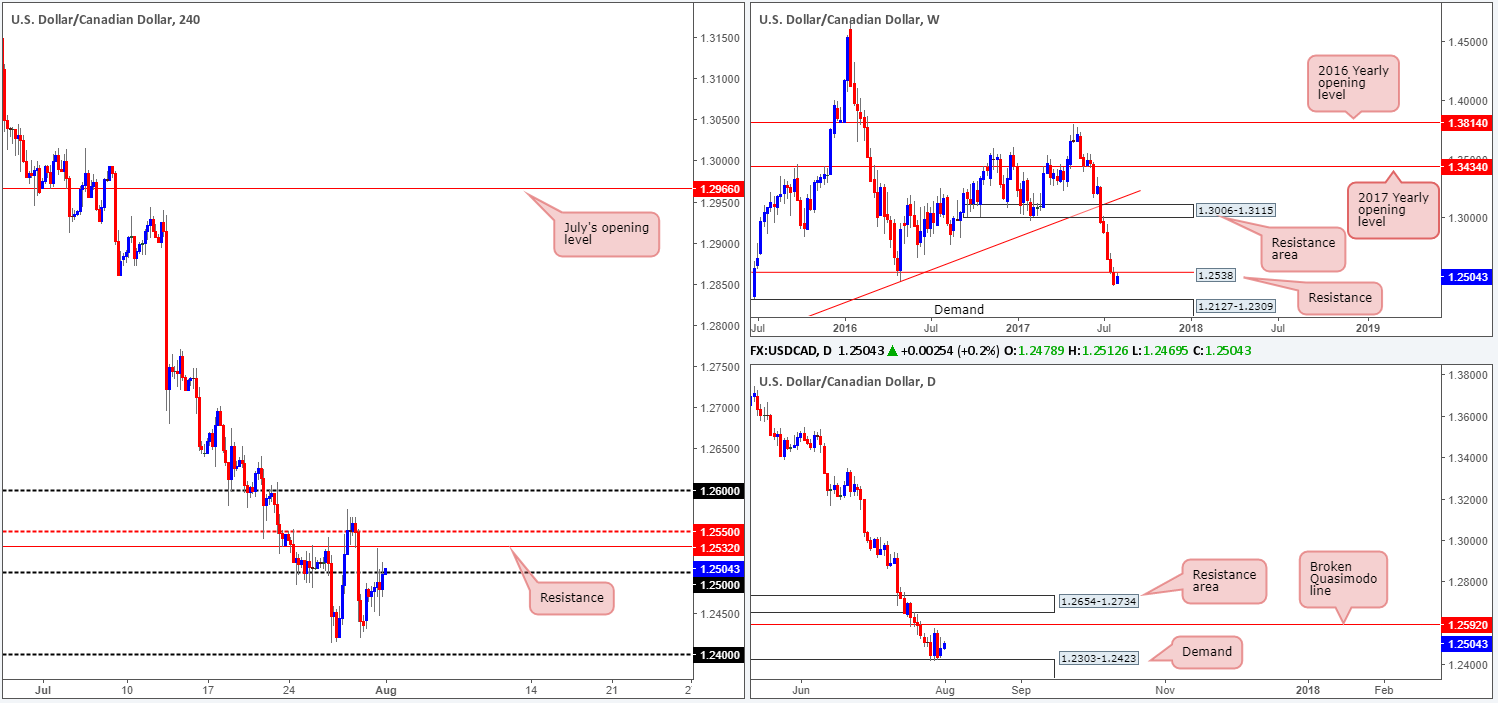
USD/CAD:
Kicking this morning’s report off from the weekly timeframe, we can see that the pair is hovering beneath resistance at 1.2538 at the moment. Assuming that this level remains firm, we do not see a whole lot of support on this scale until the demand base registered at 1.2127-1.2309. Despite this, a closer look at price action reveals that daily price is currently supported by demand coming in at 1.2303-1.2423, which happens to be glued to the top edge of the weekly demand mentioned above.
Crossing over to the H4 chart, we see price toying with the 1.25 handle. The next upside target beyond this number is seen nearby at 1.2532 (resistance), followed closely by a mid-level resistance at 1.2550. Therefore, buying this market is likely going to be difficult, despite daily price coming from demand. Along the same vein, selling from weekly resistance at 1.2538 will also be just as difficult given the current daily demand in play.
Our suggestions: At the time of writing, we do not see much to hang our hat on. Therefore, we have decided to hold fire for the time being and remain on the sidelines.
Data points to consider: US ISM manufacturing PMI at 3pm GMT+1.
Levels to watch/live orders:
- Buys: Flat (Stop loss: N/A).
- Sells: Flat (Stop loss: N/A).
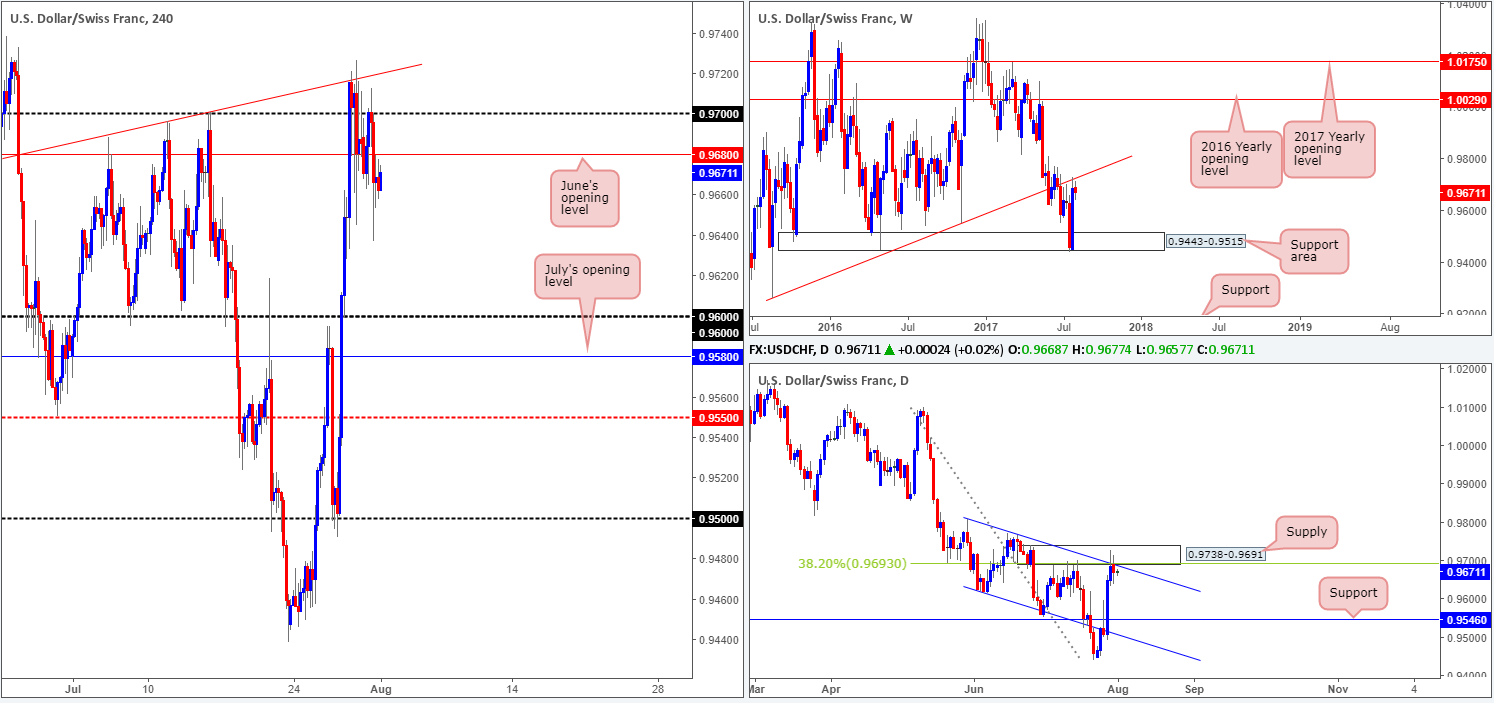
USD/CHF:
On the whole, weekly, daily and H4 structure collectively implies that shorting this market is the way to go.
What’s interesting from the weekly timeframe is that the Swissy recently interacted with a trendline resistance extended from the low 0.9257, which remains firm as we write. Turning over a page to the daily timeframe, price connected with supply logged at 0.9738-0.9691that happens to converge with a channel resistance extended from the high 0.9808 and a 38.2% Fib resistance at 0.9693 taken from the high 1.0099. And finally, across on the H4 timeframe, we can see that the candles are now trading below June’s opening level at 0.9680. As we mentioned in Monday’s report, a close below here would likely clear the path south down to the 0.96 handle, followed closely by July’s opening level at 0.9580 and then daily support positioned at 0.9546.
Our suggestions: For us to pull the trigger here, however, we would like to see the H4 candles retest June’s opening level at 0.9680 and form a full, or near-full-bodied candle. This would, in our humble opinion, be enough evidence to enter short, targeting 0.96 as an initial take-profit zone.
Data points to consider: US ISM manufacturing PMI at 3pm GMT+1.
Levels to watch/live orders:
- · Buys: Flat (stop loss: N/A).
- · Sells: 0.9680 region ([waiting for a full or near-full-bodied bearish candle to emerge is advised] stop loss: ideally beyond the candle wick).
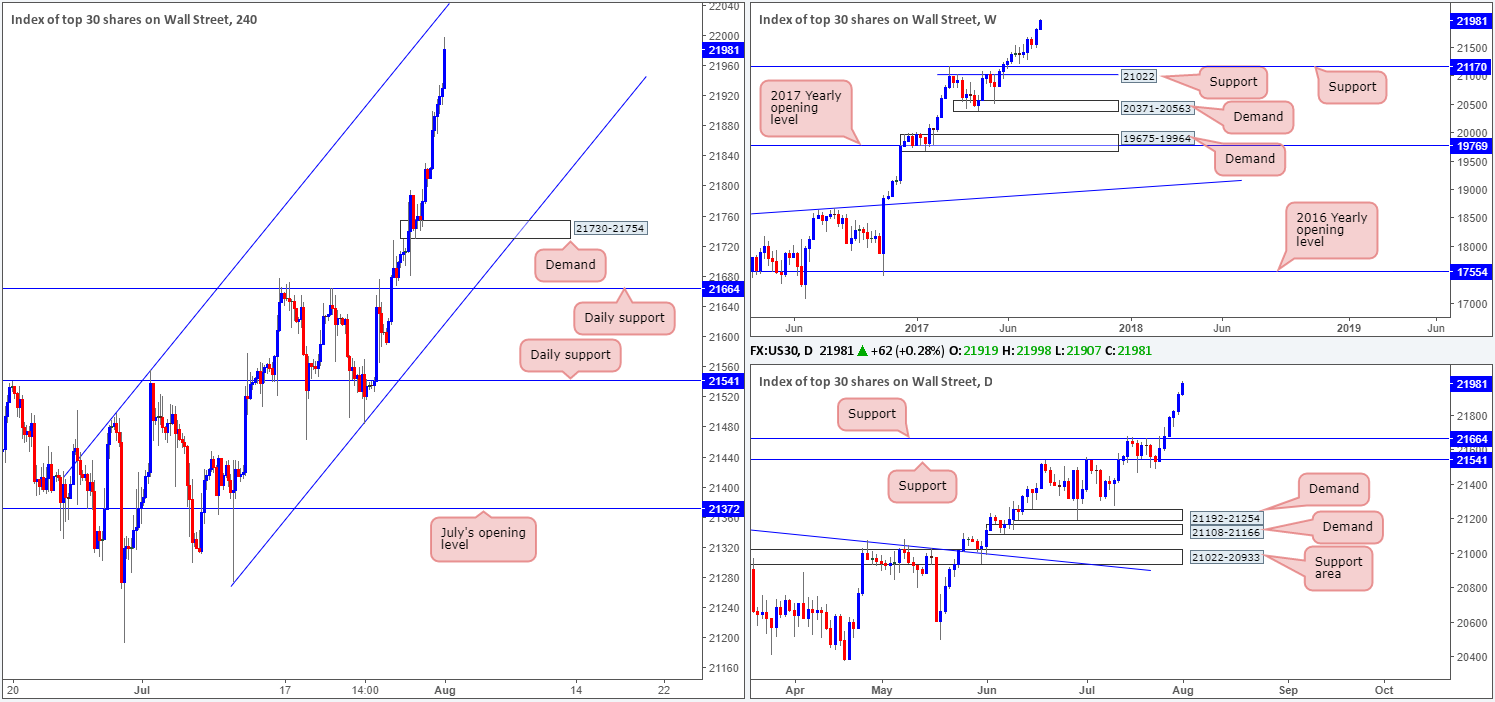
DOW 30:
For five consecutive sessions, the US equity market has advanced north. This places the index at record highs and also within striking distance of a H4 channel resistance extended from the high 21493. However, selling at this angle, in our humble opinion, is a chancy move given the strength of the bulls and lack of higher-timeframe resistances.
Our suggestions: Personally, we have very little else to comment on this market at the moment, as there are unfortunately no supports seen nearby for a buy trade.
Data points to consider: US ISM manufacturing PMI at 3pm GMT+1.
Levels to watch/live orders:
- · Buys: Flat (stop loss: N/A).
- · Sells: Flat (stop loss: N/A).
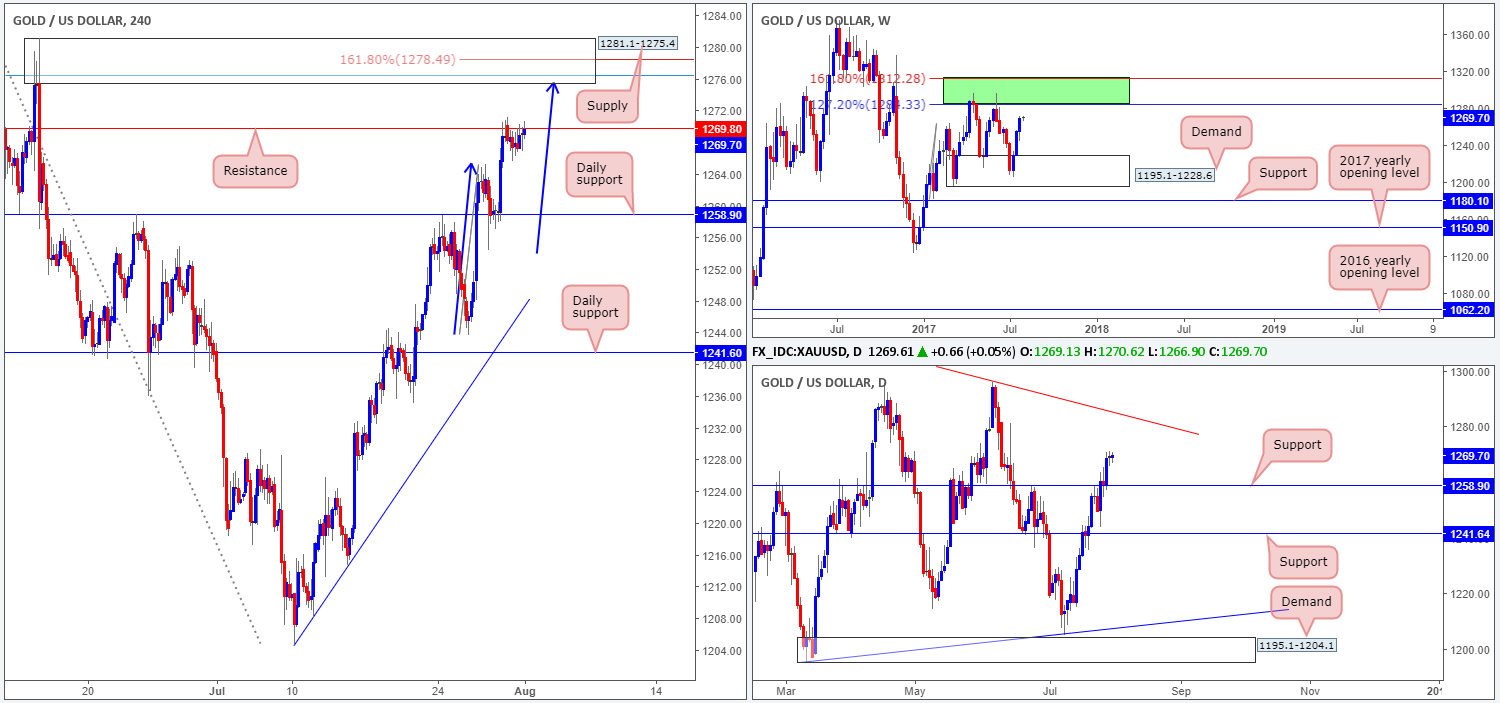
GOLD:
As of current price, the H4 chart shows the unit spent yesterday clinging to the underside of resistance at 1269.8. As we highlighted in yesterday’s report, the H4 supply at 1281.1-1275.4 seen above this line is interesting. Encased within the area is a H4 AB=CD (blue arrows) 161.8% Fib ext. at 1278.4 drawn from the low 1243.6, and a H4 78.6% Fib resistance (blue line) at 1276.5 taken from the high 1296.0. The question is, will this H4 supply be enough to halt further buying?
As can be seen from the weekly timeframe the gold market remained strongly bid last week, placing the metal within striking distance of an area comprised of two Fibonacci extensions 161.8/127.2% at 1312.2/1284.3 taken from the low 1188.1 (green zone). Already capping upside on two occasions, will we see history repeat itself from the green area this week? A closer look at price action on the daily timeframe shows price used support at 1258.9 to trade higher on Friday. Should the bulls remain in position, the next upside hurdle in the firing range will likely be the trendline resistance extended from the high 1337.3.
Our suggestions: So, taking into account that both the weekly and daily charts show room to extend north, we are going to refrain taking shorts from the said H4 supply. The feeling of going against higher-timeframe buyers from the H4 area just doesn’t sit right with us.
Levels to watch/live orders:
- · Buys: Flat (stop loss: N/A).
- · Sells: Flat (stop loss: N/A).


