
DXY:
The DXY is showing a bearish trend, with the possibility of a bearish reaction off the 1st resistance level at 102.00 that could lead the price to drop towards the 1st support level at 101.46. This resistance level is significant due to its role as an overlap resistance and its alignment with the 61.80% Fibonacci retracement and 78.60% Fibonacci projection levels, suggesting a Fibonacci confluence.
The 1st support level is considered strong due to its role as an overlap support. Should the price fall below this level, the 2nd support at 10.53, another overlap support, could halt further decline.
On the flip side, if the price increases, it would meet the 2nd resistance level at 102.74, which has functioned as a pullback resistance in the past and aligns with the 50% Fibonacci retracement level. This level could pose a challenge to the price movement.

EUR/USD:
The EUR/USD pair is displaying a bullish trend, with the potential to make a bullish bounce off the 1st support level at 1.0975 and move towards the 1st resistance level at 1.1040. The 1st support level is significant due to its role as a pullback support and its alignment with the 61.80% Fibonacci retracement level.
If the price falls further, the 2nd support level at 1.0920, another pullback support aligning with the 78.60% Fibonacci retracement level, could prevent further price decline.
On the upside, the 1st resistance level is notable for its role as an overlap resistance and alignment with the 50% Fibonacci retracement level. If the price moves past this level, the 2nd resistance level at 1.1146, known as a swing high resistance, could pose a challenge for further price increase.

EUR/JPY:
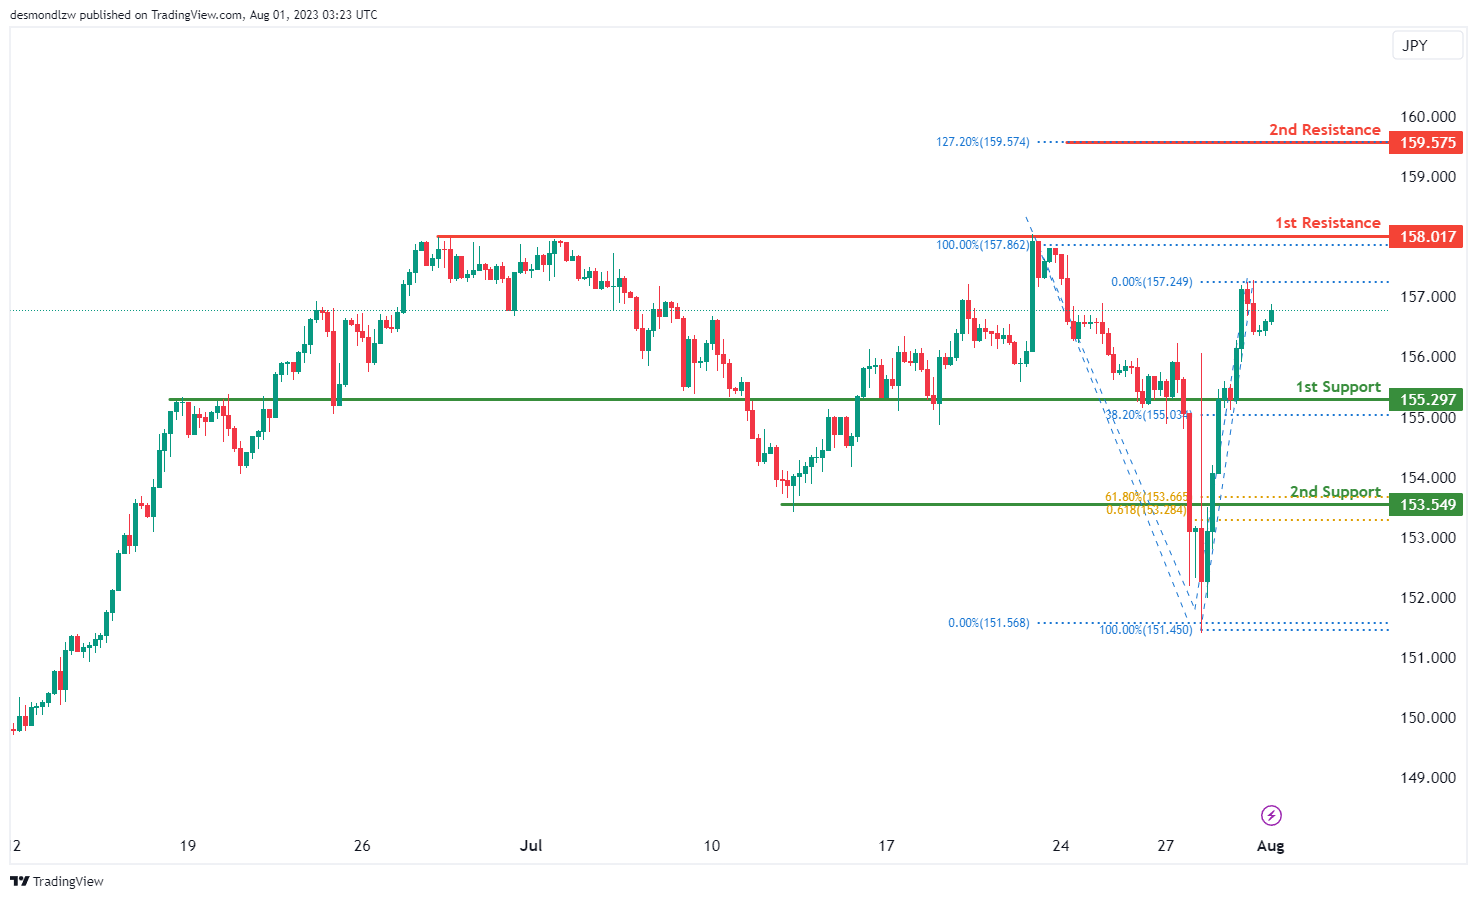
The EUR/JPY chart shows a neutral momentum, suggesting the potential for price to fluctuate between the 1st resistance and 1st support levels.
The 1st support at 155.30 is considered a significant level as it coincides with the 38.20% Fibonacci retracement, making it a relevant area for potential bounce or reversal.
Furthermore, the 2nd support at 153.54 is an important level to watch as it aligns with both the 61.80% Fibonacci retracement and the 78.60% Fibonacci projection, indicating a Fibonacci confluence that may act as strong support.
On the upside, the 1st resistance at 158.01 represents a multi-swing high resistance, which could potentially cap the price’s upward movement.
Additionally, the 2nd resistance at 159.57 corresponds to the 127.20% Fibonacci retracement, providing another key level to observe for potential resistance.
EUR/GBP:
The EUR/GBP chart displays a neutral momentum, suggesting the potential for price to fluctuate between the 1st resistance and 1st support levels.
The 1st support at 0.8554 is an essential level as it corresponds to multi-swing high resistance, indicating its significance as a potential bounce area.
Similarly, the 2nd support at 0.8524 is another key level as it is an overlap support, making it a relevant area for potential price reversals.
On the upside, the 1st resistance at 0.8586 represents another multi-swing high resistance, which could limit the price’s upward movement.
Furthermore, the 2nd resistance at 0.8636 is identified as an overlap resistance, providing another significant level to watch for potential price reactions.

GBP/USD:
The GBP/USD pair currently exhibits a bearish trend, with a potential scenario of a bearish reaction off the 1st resistance level at 1.2876 and a subsequent fall towards the 1st support level at 1.2756. The 1st support level is notable due to its role as an overlap support and alignment with the 61.80% Fibonacci projection level.
If the price drops further, the 2nd support level at 1.2675, another overlap support, could prevent further downward movement.
On the bearish side, the 1st resistance level is significant for its role as an overlap resistance and alignment with the 50% Fibonacci retracement level. If the price breaks through this level, the 2nd resistance level at 1.2992, which has served as a swing high resistance in the past, could hinder further price decline.

GBP/JPY:
The GBP/JPY chart exhibits a bullish momentum, indicating the potential for a bullish continuation towards the 1st resistance level at 183.81. This resistance level is significant as it aligns with multi-swing high resistance and also coincides with the 127.20% Fibonacci Extension level, suggesting its importance in potential price movements.
For potential downward movements, the chart has 1st and 2nd support levels at 182.15 and 179.88, respectively. Both of these support levels are recognized as overlap supports, indicating their potential significance in providing a bounce for the price.
On the upside, the 2nd resistance at 185.35 represents another relevant level as it is an overlap resistance and corresponds to the 161.80% Fibonacci Extension level, adding to its importance as a possible barrier for further upward movement.

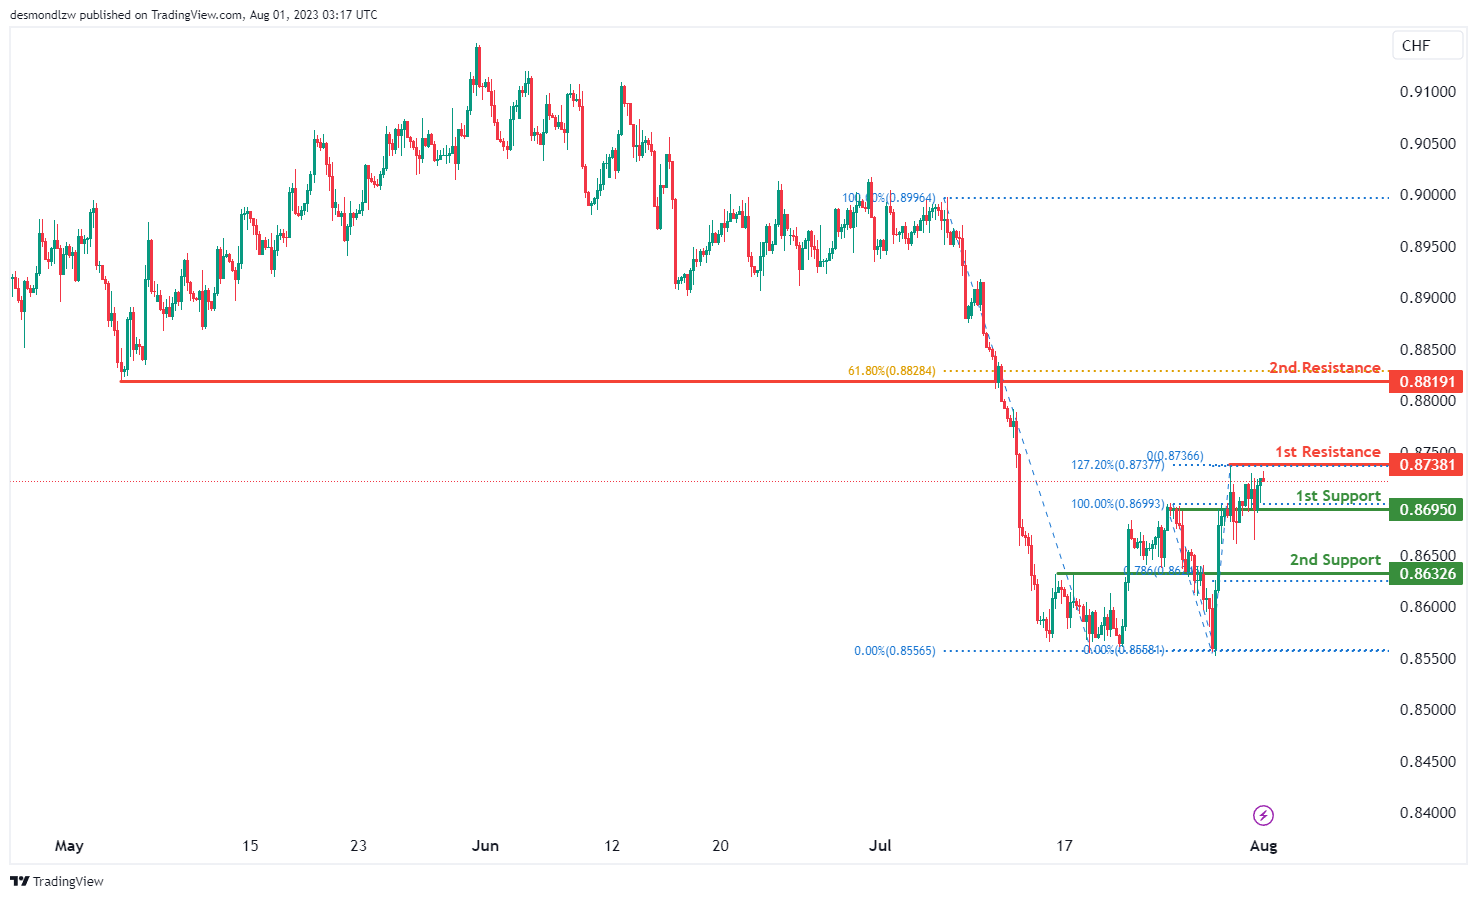
USD/CHF:
The USD/CHF pair currently indicates a bearish trend, with potential for a bearish reaction off the 1st resistance level at 0.8738, which could cause the price to drop towards the 1st support level at 0.8695. This support level is significant due to its role as an overlap support.
If the price declines further, the 2nd support level at 0.8632, which acts as a pullback support, could play a crucial role in halting further downward movement.
On the bearish side, the 1st resistance level is noteworthy for its role as a swing high resistance and its alignment with the 127.20% Fibonacci Extension. If the price attempts to rise above this level, the 2nd resistance level at 0.8819, which has served as a pullback resistance and aligns with the 61.80% Fibonacci retracement, could hinder further price progression.
USD/JPY:
The USD/JPY pair is presently indicating a bearish momentum, with the potential for a bearish reaction off the 1st resistance level at 142.74. This could cause the price to drop towards the 1st support level at 142.03, a significant area due to its role as an overlap support.
If the price decreases further, the 2nd support level at 139.93, functioning as a pullback support, could serve as a key level to halt further bearish movement.
On the resistance side, the 1st resistance level at 142.74 is notable for its role as a swing high resistance and its alignment with the 127.20% Fibonacci Extension and 100% Fibonacci Projection, suggesting a Fibonacci confluence. If the price attempts to break past this level, the 2nd resistance level at 143.87 could present a challenge. This level has acted as a pullback resistance and aligns with the 145.00% Fibonacci Extension.
In addition to these levels, the Relative Strength Index (RSI) is showing bearish divergence compared to the price, suggesting that a reversal may occur soon.

USD/CAD:
The USD/CAD chart displays a bullish momentum, supported by the fact that the price is above a major ascending trend line, suggesting the potential for further upward movement.
A possible scenario indicates a potential bullish continuation towards the 1st resistance level at 1.3257. This resistance is considered significant as it represents a swing high resistance. Additionally, the 2nd resistance at 1.3342 serves as another crucial area of potential price resistance. It corresponds to an overlap resistance and coincides with the 78.60% Fibonacci retracement level.
On the downside, the 1st support at 1.3153 and the 2nd support at 1.3117 are both identified as important overlap areas providing support to the price.

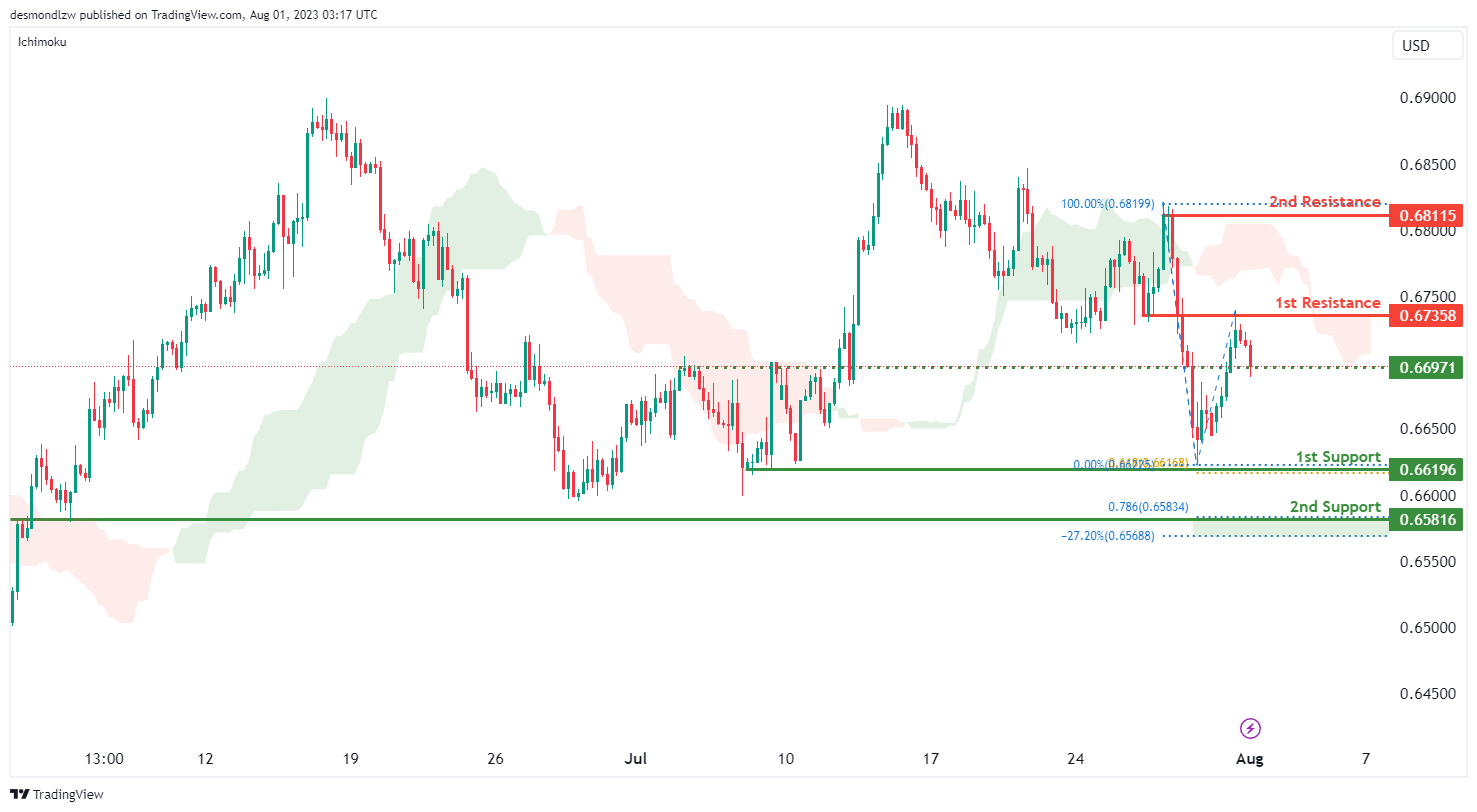
AUD/USD:
The AUD/USD chart indicates a bearish momentum, supported by the fact that the price is below the bearish Ichimoku cloud. A potential scenario suggests a bearish continuation towards the 1st support level at 0.6619, should price break below the intermediate support at 0.6697.
The 1st support level is considered significant as it represents an overlap support and coincides with the 61.80% Fibonacci projection level. Furthermore, the 2nd support at 0.6582 is another important area, providing additional support to the price. This level aligns with an overlap support that represents a confluence of Fibonacci levels i.e. the 78.60% projection and the -27% expansion levels.
On the upside, the 1st resistance at 0.6736 serves as a crucial area of potential price resistance, while the 2nd resistance at 0.6812 represents a significant swing high resistance.
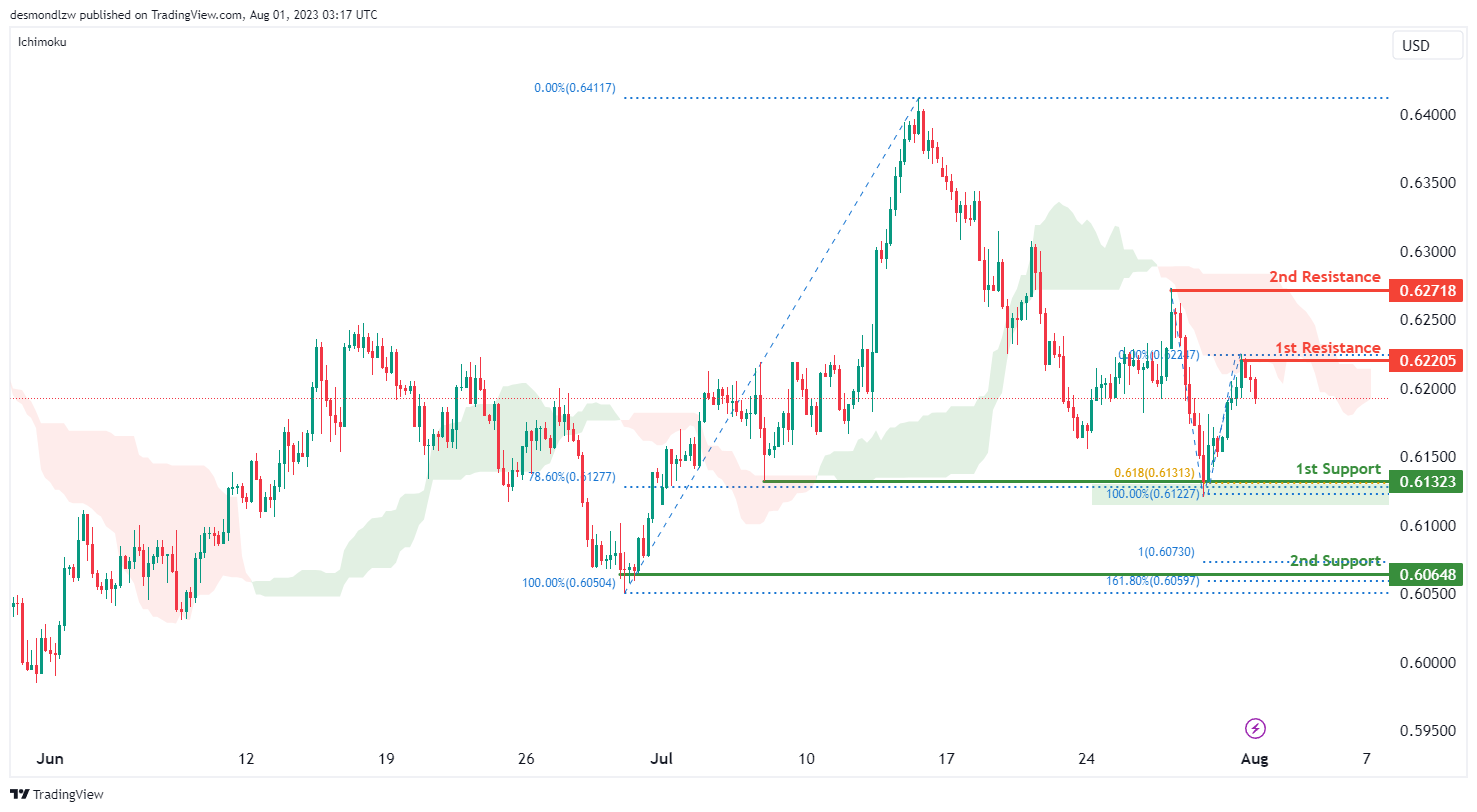
NZD/USD
The NZD/USD chart displays a bearish momentum, as the price remains below the bearish Ichimoku cloud.
A potential scenario indicates a bearish continuation towards the 1st support level at 0.6132, which holds significant importance as it aligns with an overlap support as well as with the 61.80% Fibonacci projection and the 78.60% Fibonacci retracement levels, suggesting Fibonacci confluence.
Moreover, the 2nd support at 0.6065 is another critical area, providing substantial support to the price. This level corresponds to an overlap support, the 100% Fibonacci projection, and the 161.80% Fibonacci extension levels, indicating Fibonacci confluence.
On the upside, the 1st resistance at 0.6221 represents a notable area of potential price resistance, while the 2nd resistance at 0.6272 serves as a significant swing high resistance.
DJ30:
The DJ30 chart indicates a bullish momentum, suggesting a potential bullish continuation towards the 1st resistance level.
For this scenario, the 1st support at 35228.58 is a significant area as it coincides with the 23.60% Fibonacci retracement, serving as an overlap support. Additionally, the 2nd support at 34938.35 acts as a pullback support, corresponding to the 38.20% Fibonacci retracement.
On the upside, the 1st resistance at 35728.64 represents a crucial swing high resistance. Furthermore, the 2nd resistance at 35867.78 is identified as the 127.20% Fibonacci extension, potentially acting as another significant level.

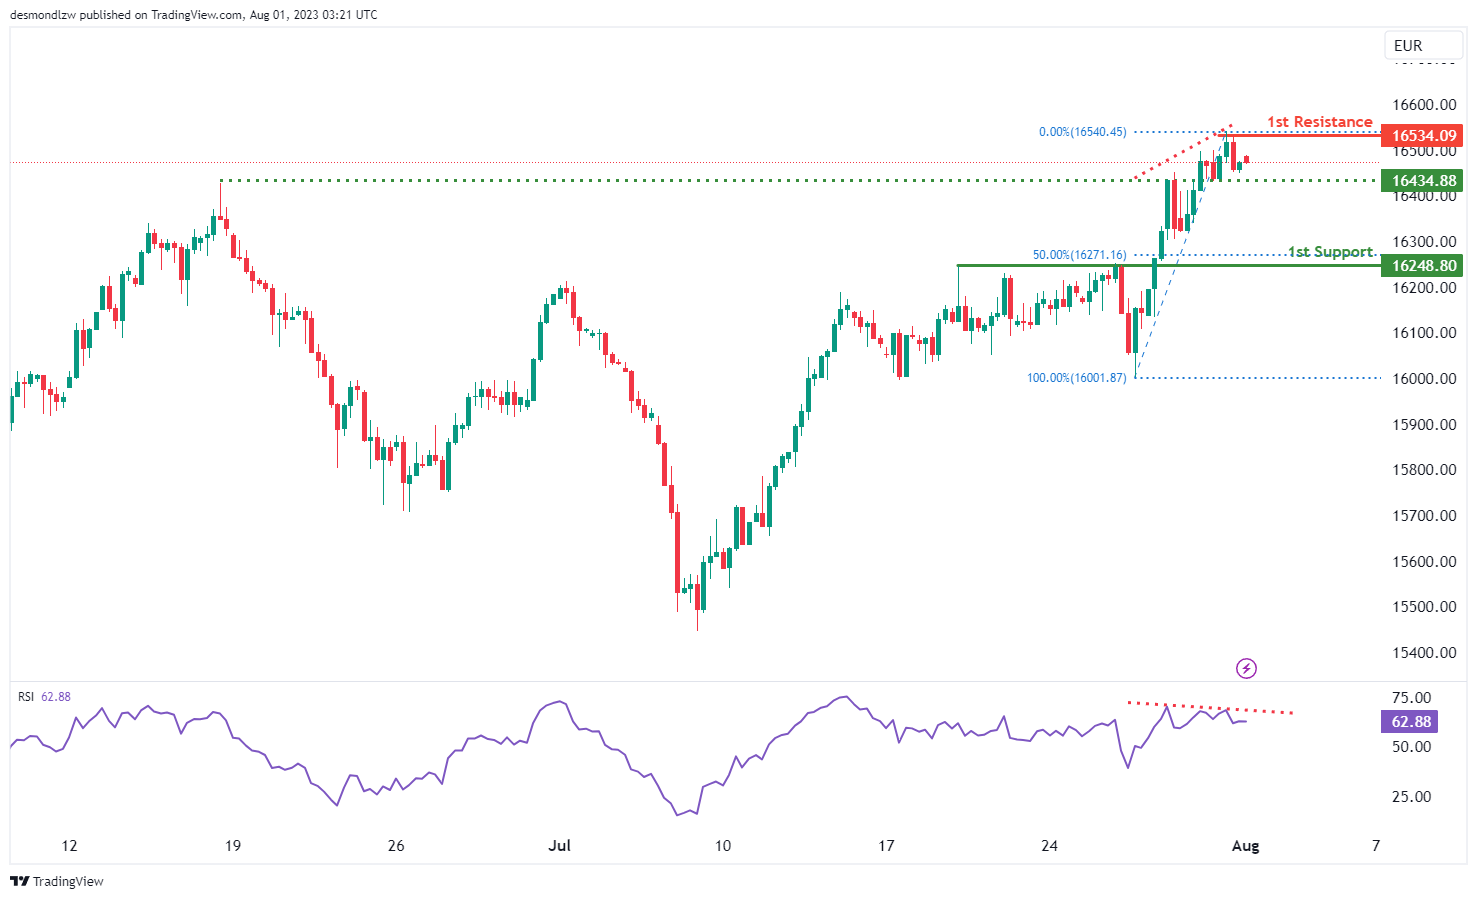
GER30:
The GER30 chart shows a bearish momentum, with potential factors contributing to this decline not specified in the provided text. However, the text suggests a potential scenario where the price could have a bearish reaction off the 1st resistance and drop towards the 1st support.
For this scenario, the 1st support at 16248.80 is considered a pullback support, aligning with the 50% Fibonacci retracement. Additionally, there is mention of a 2nd support level, but the value is not provided in the text.
On the upside, the 1st resistance at 16534.09 is identified as a significant swing high resistance.
Moreover, the text mentions that the RSI is displaying bearish divergence versus price, indicating a potential reversal might occur soon.
US500
The US500 chart exhibits a bullish momentum, indicating the potential for a bullish break through the 1st resistance level at 4608, which is a significant swing high resistance. Should the break occur, the price could rise towards the 2nd resistance at 4642, which is identified as another swing high resistance and corresponds to the 145.00% level.
For potential downward movements, the chart has 1st and 2nd support levels at 4573 and 4528, respectively. These support levels are recognized as pullback supports, with the 2nd support coinciding with the 38.20% Fibonacci retracement.
The overall bullish momentum suggests a positive sentiment in the market, and traders might be closely monitoring the potential breakout above the 1st resistance level for the price to move towards the 2nd resistance.


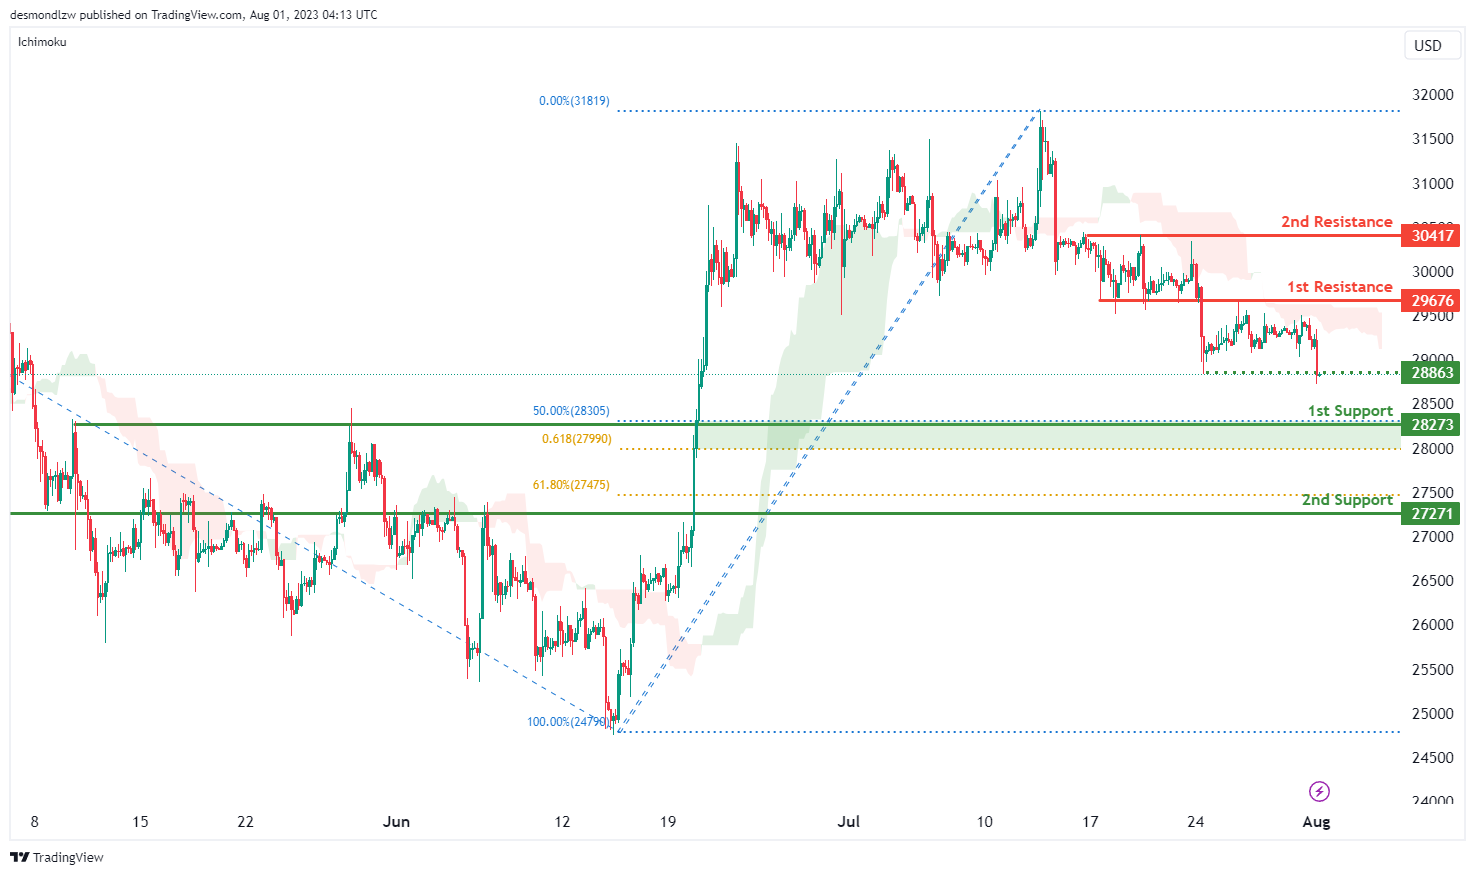
BTC/USD:
The BTC/USD chart indicates a bearish momentum, as the price is currently below the bearish Ichimoku cloud.
A possible scenario suggests a bearish continuation towards the 1st support level at 28273. This support level is considered significant as it coincides with the 50% Fibonacci retracement and the 61.80% Fibonacci projection, indicating Fibonacci confluence.
Additionally, there is a 2nd support at 27271, which serves as another relevant area, corresponding to the 61.80% Fibonacci retracement.
On the upside, the 1st resistance at 29676 is identified as a pullback resistance. Furthermore, there is a 2nd resistance at 30417, representing a multi-swing high resistance.
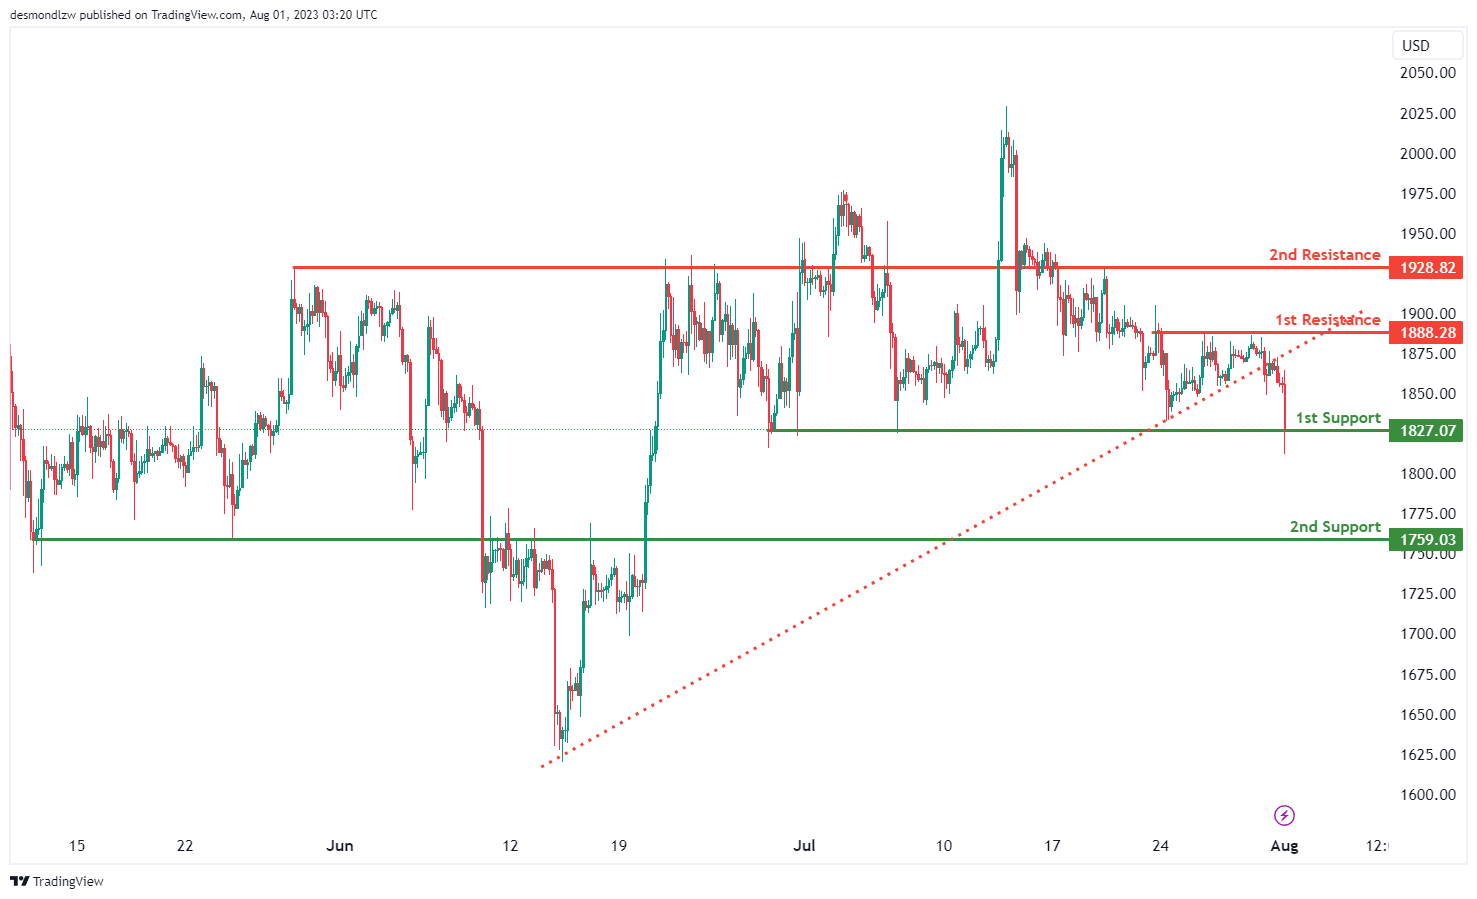
ETH/USD:
The ETH/USD chart exhibits a bearish momentum, primarily attributed to the break below an ascending support line, triggering a potential bearish move.
A possible scenario indicates a bearish break off the 1st support level at 1827.07, which is a significant multi-swing low support, leading the price towards the 2nd support at 1759.03. This support level is recognized as an overlap support.
On the upside, the 1st resistance at 1888.28 represents a multi-swing high resistance, while the 2nd resistance at 1928.82 is identified as an overlap resistance.
WTI/USD:
The WTI/USD chart exhibits a bearish momentum, indicating a potential bearish continuation towards the 1st support level at 79.88. This support is considered significant as it represents an overlap support. Additionally, the 2nd support at 78.76 serves as another important area of potential price stabilization, acting as an overlap support.
On the upside, the 1st resistance at 81.59 is recognized as a relevant area of potential price resistance, identified as an overlap resistance. Furthermore, the 2nd resistance at 83.30 represents another critical level of resistance, functioning as an overlap resistance.
It is worth noting that the RSI is displaying bearish divergence compared to the price, suggesting a potential reversal might occur soon.

XAU/USD (GOLD):
The XAU/USD pair is currently on a bearish trend, suggesting a possible continuation of this trend towards the 1st support level at 1953.42. This level is seen as key due to its function as an overlap support and its association with the 61.80% Fibonacci retracement level.
Should the price drop further, the 2nd support level at 1938.28, acting as a pullback support, may serve as a critical stop for the bearish movement.
On the upside, the 1st resistance level is found at 1971.21, having served as a swing high resistance in the past. If the price manages to ascend beyond this level, the 2nd resistance at 1981.14 could present a significant hurdle, as it has been a multi-swing high resistance previously.

The accuracy, completeness and timeliness of the information contained on this site cannot be guaranteed. IC Markets does not warranty, guarantee or make any representations, or assume any liability regarding financial results based on the use of the information in the site.
News, views, opinions, recommendations and other information obtained from sources outside of www.icmarkets.com, used in this site are believed to be reliable, but we cannot guarantee their accuracy or completeness. All such information is subject to change at any time without notice. IC Markets assumes no responsibility for the content of any linked site.
The fact that such links may exist does not indicate approval or endorsement of any material contained on any linked site. IC Markets is not liable for any harm caused by the transmission, through accessing the services or information on this site, of a computer virus, or other computer code or programming device that might be used to access, delete, damage, disable, disrupt or otherwise impede in any manner, the operation of the site or of any user’s software, hardware, data or property.


