
Key risk events today:
Canada Manufacturing Sales m/m; US Building Permits; (CAD) Gov. Council Member Wilkins Speaks.
Market news (Monday):
- In terms of macroeconomic data, Monday had little to get excited about, exhibiting low-impact values.
- Builder confidence in the US market for newly built single-family homes edged one point lower to 70 in November, according to the latest NAHB/Wells Fargo Housing Market Index (previous: 71).
- Australia’s Conference Board Leading Economic Index (LEI) for Australia increased 0.2% in September 2019 to 107.7 (2016=100).
- Elsewhere, major FX markets largely took their cue from the negative update on the US/China trade front. The mood in Beijing is reportedly pessimistic regarding the possibility of a US-China trade deal being passed.
- In the UK, Boris Johnson’s Conservatives have opened a big lead over Labour in the latest election opinion polls. A poll published by Survation shows a 14-percentage point lead over Jeremy Corbyn’s party (Yahoo News). Also worthy of note, the EU’s trade chief, according to The Sun, controversially declared Boris Johnson will either get a ‘bare bones’ trade deal from Brussels next year or none at all.
EUR/USD:
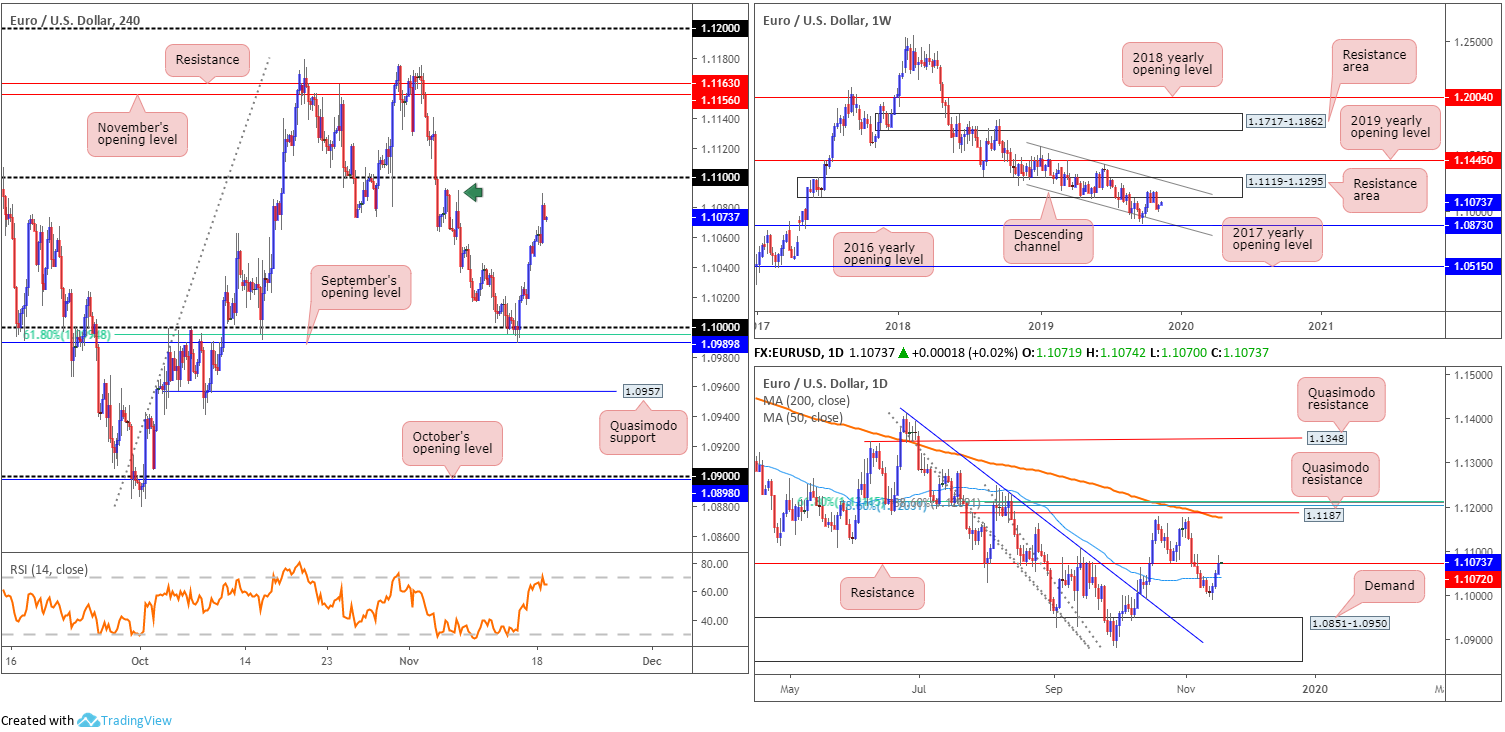
Europe’s single currency kicked off the week in reasonably robust fashion, gliding to highs of 1.1090 before mildly paring gains into the close. Tops (green arrow) around the 1.1090 neighbourhood on the H4 timeframe is likely viewed as resistance in this market, as is the 1.11 handle. Beyond this point, resistance at 1.1163 and November’s opening level at 1.1156 remains the next upside objective. Indicator-based traders may also wish to acknowledge the relative strength index (RSI) recently shook hands with overbought territory.
On a wider perspective, weekly flow continues to hold south of a long-standing resistance area at 1.1119-1.1295. Further selling has the lower boundary of a descending channel to target (extended from the low 1.1109), set a few points north of the 2016 yearly opening level at 1.0873. Concerning trend direction, the primary downtrend has been in motion since topping in early 2018 at 1.2555.
A closer reading of higher-timeframe action on the daily timeframe places the market at notable resistance formed at 1.1072. A decisive close north of the said resistance demonstrates seller weakness out the weekly resistance area mentioned above at 1.1119-1.1295, while a rejection potentially confirms the downside bias. Another area to keep an eye on is demand at 1.0851-1.0950 – houses the 2016 yearly opening level at 1.0873.
Areas of consideration:
Outlook unchanged.
From a technical standpoint, daily resistance at 1.1072 is key. Should price action remain beneath this base, further downside is likely in store for EUR/USD, while an upside violation could prompt a retest at the weekly resistance area 1.1119-1.1295.
With the primary downtrend facing south, and price recently exiting a notable weekly resistance area, a rejection off the said daily resistance level by way of a bearish candlestick formation (either H4 or daily scale) will likely be regarded as a strong bearish indicator, with the option of calculating entry/risk levels based off the candle pattern for possible shorts.
GBP/USD:
Adding more than 50 points, or 0.41%, The British pound advanced against its US counterpart Monday as traders cheered latest optimism surrounding Brexit.
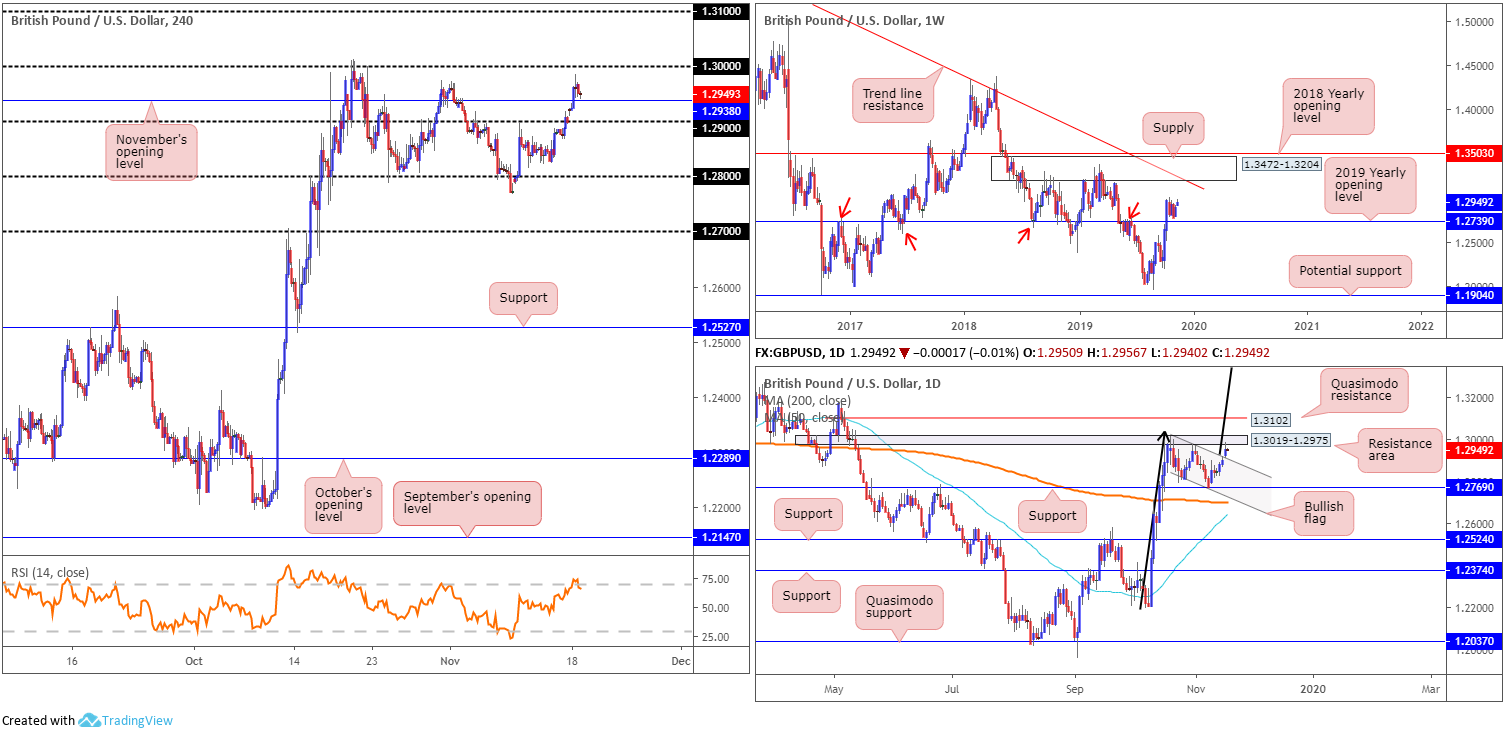
Recent bidding pulled H4 price north of 1.29 and also through orders at November’s opening level drawn from 1.2938. Price clocked highs of 1.2985 before mildly trimming gains into the day’s end. As of writing, the unit is poised to retest 1.2938 as support, with a bounce from here likely to clash with the key figure 1.30.
Technical research on the daily timeframe reveals a bullish flag pattern (1.3012/1.2804), which has been developing since price broke through resistance at 1.2769 (now a serving support), saw its upper boundary violated yesterday in the shape of an opening gap. Upside on this timeframe has a resistance area plotted at 1.3019-1.2975 currently holding price action lower, followed closely by Quasimodo resistance sighted just above at 1.3102.
Interestingly, the view on the weekly timeframe exhibits scope to extend north, at least until crossing swords with
supply at 1.3472-1.3204 and long-term trend line resistance etched from the high 1.5930. The immediate trend, however, faces a downward trajectory from 1.4376, with a break of the 1.1904 low (labelled potential support) confirming the larger downtrend from 1.7191.
Areas of consideration:
Longer-term traders are likely long the upside break of the daily bullish flag, with protective stop-loss orders either positioned beneath the breakout candle’s lower shadow (1.2908 – aggressive approach) or below support at 1.2769, or even beneath the flag’s lower limit (conservative approach).
The bullish flag’s take-profit target is huge, coming in at 1.3780 (black arrows – measured from the preceding move and added to the breakout point).
An upside violation of 1.30 this week adds confidence to further buying, given limited resistance is visible until 1.31. In fact, this could serve as another entry point: a retest at 1.30 as support, following a decisive close higher.
AUD/USD:
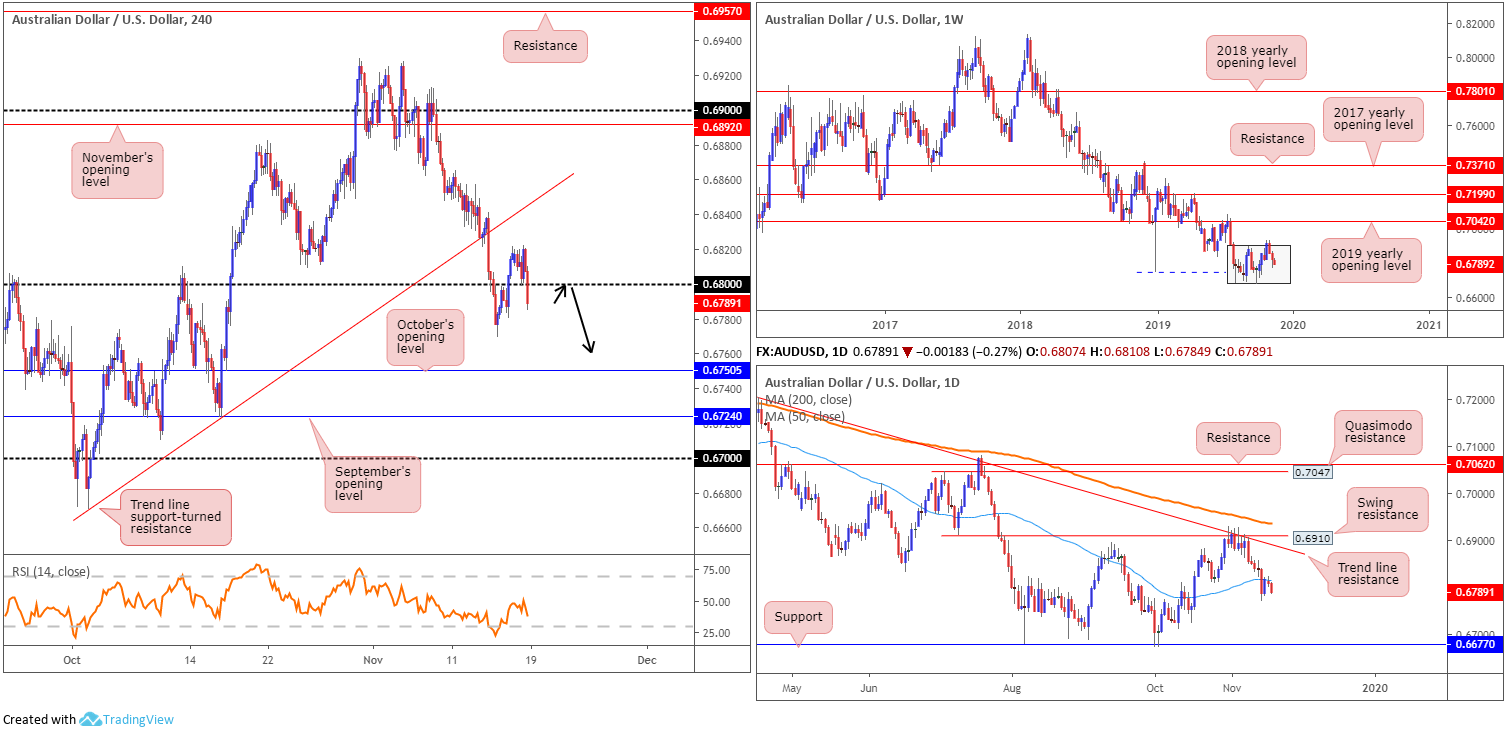
In recent hours, AUD/USD action choked 0.68 and transitioned south. RBA Minutes, the catalyst behind the move, stated the board is prepared to ease further if needed and agreed a case could be made for a rate cut at the meeting but decided rates should be held steady.
For traders who read Monday’s technical briefing you may recall the following piece:
Should the higher-timeframe analysis prove correct, and H4 price breaks back beneath 0.68, bearish scenarios are then an option, targeting October’s opening level at 0.6750 as the initial port of call.
Higher-timeframe flow, according to Monday’s report:
The recent two-candle fakeout on the weekly timeframe at the top edge of a 3-month long consolidation zone between 0.6894/0.6677 (light grey) forced price marginally back into its range last week, reaching as far south as 0.6769.
With a primary downtrend in play since early 2018, breaking to lower levels over the coming weeks is likely.
And the daily timeframe:
Snapping a five-day losing streak, AUD/USD activity on the daily timeframe recovered Friday and reclaimed a large portion of Thursday’s downside move. Upside may struggle in early trade this week as sellers could attempt to defend the underside of the 50-day SMA (blue – 0.6813).
Although a move higher came about off 0.6780, the more visible support on the daily timeframe remains around 0.6677.
Areas of consideration:
Based on current analysis, a H4 close forming beneath 0.68 opens the possibility of a retest motion occurring for possible shorting opportunities (black arrows). Entry and risk can then be set according to the rejection candle’s framework, targeting October’s opening level at 0.6750 as the initial take-profit zone.
USD/JPY:
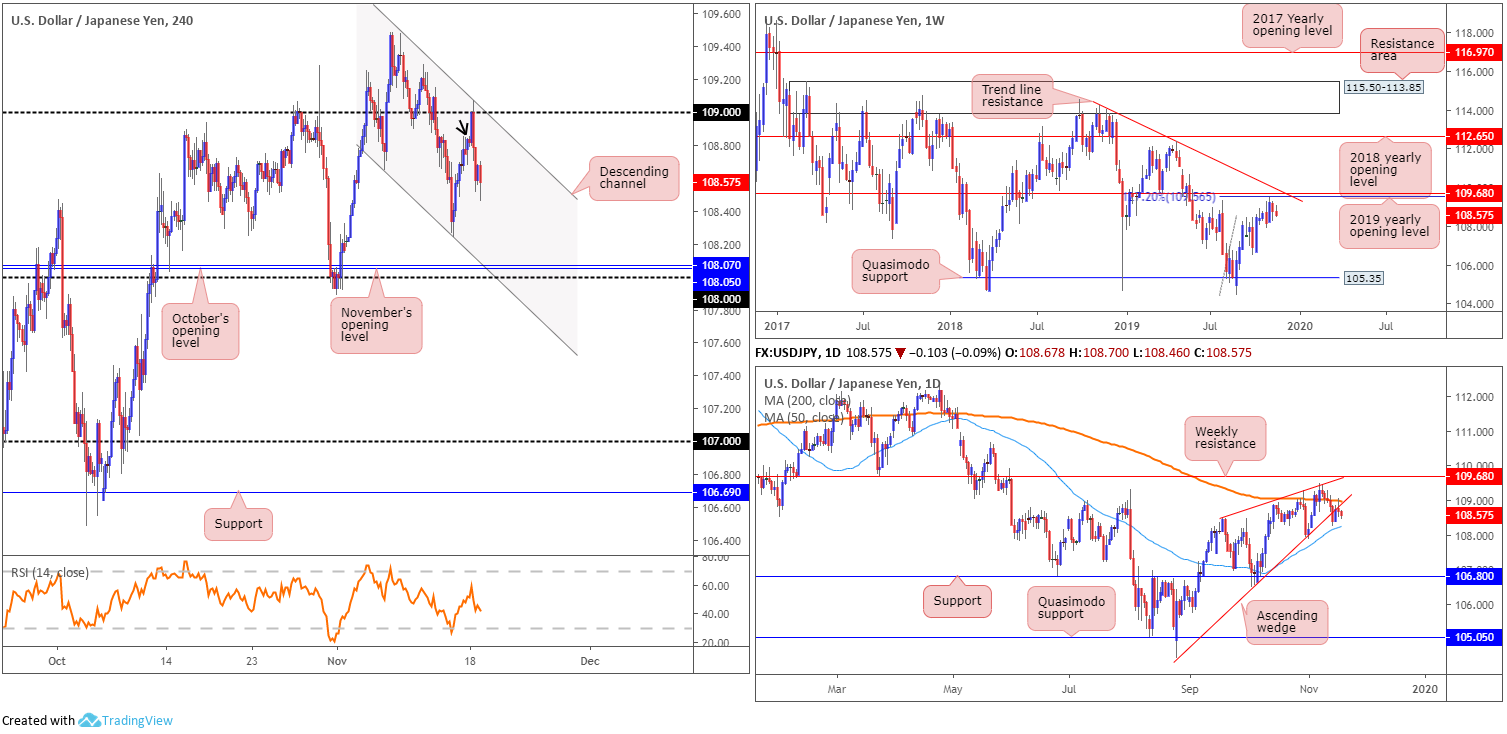
In opening trade, USD/JPY movement failed to sustain gains above the 109 handle, turning sharply lower in response to weakening US Treasury yields and concerning trade headlines between the US and China.
H4 price is currently chalking up a descending channel formation (109.47/108.64), with last Thursday’s low priced in as the next support at 108.24, closely shadowed by the 108 handle, along with November and October’s opening levels at 108.05 and 108.07, respectively.
Bolstering 109 is the 200-day SMA (orange – 108.98) and the lower edge of an ascending wedge formation (104.44), which has been unfolding since early September. Last week ended with the unit retesting the underside of the broken wedge.
Technical research based on the weekly timeframe, as highlighted in Monday’s report, had the USD/JPY contained within the prior week’s range (109.48/108.18) last week. Structurally, resistance is seen close by in the form of the 2019 yearly opening level at 109.68 and a 127.2% Fibonacci ext. point at 109.56 (taken from the low 104.44). Also sited nearby is trend line resistance extended from the high 114.23. In regards to the market’s primary trend, the pair has been entrenched within a range since March 2017, spanning 115.50/105.35.
Areas of consideration:
Monday’s report had the following to say:
Although H4 price may look to revisit the underside of 109 this week, the fact we’re retesting the underside of a long-standing daily wedge (see above) in the form of a H4 shooting star candlestick pattern (black arrow) is likely enough to entice sellers into the market this week. Conservative stop-loss placement is seen around 109.16, which not only clears 109 but also the 200-day SMA on the daily timeframe (orange – 108.98).
Irrespective of whether one entered short on the back of the H4 bearish candlestick pattern, or at the underside of 109, protective stop-loss placement remained the same and both setups would currently be trading in profit.
USD/CAD:
For those who read Monday’s technical piece you may recall the following (italics):
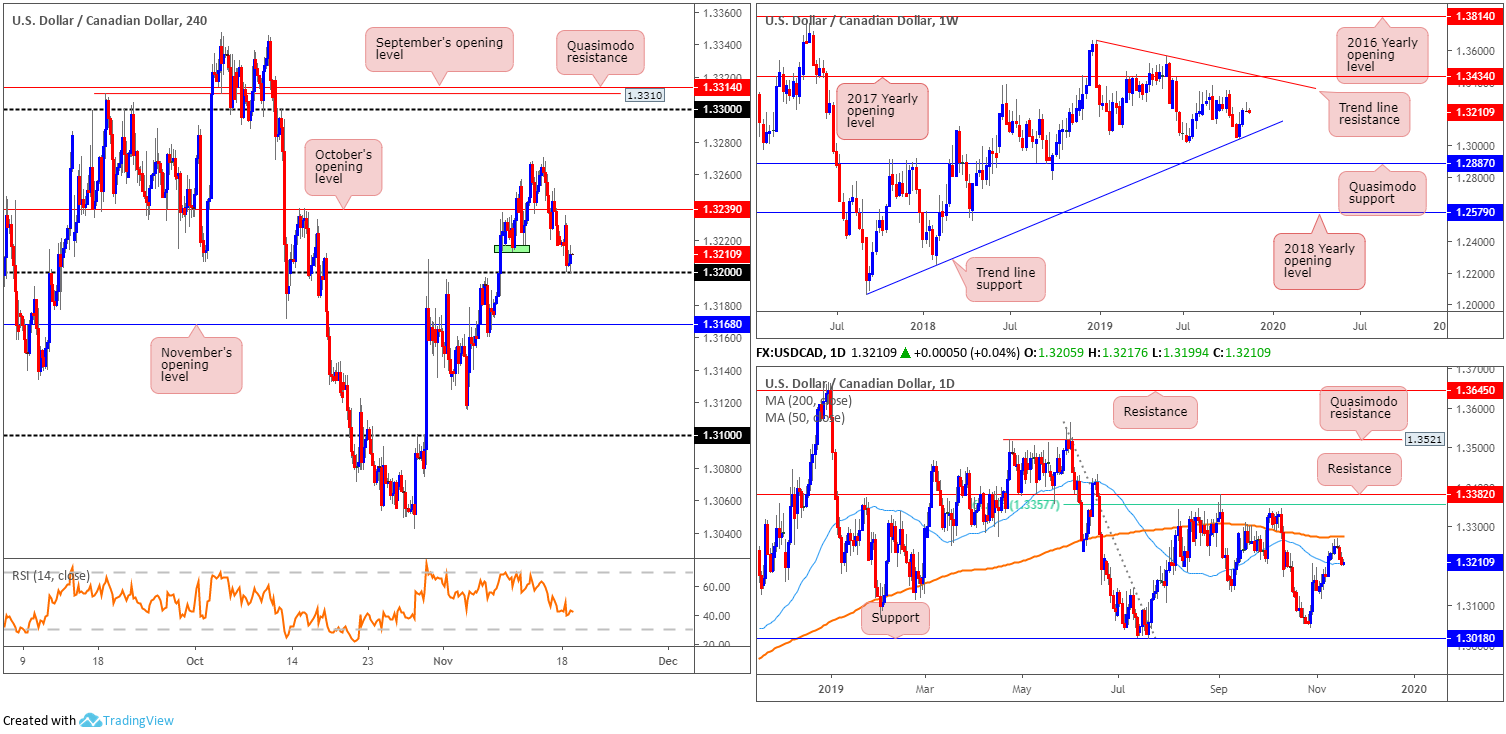
From the weekly timeframe, we had a gravestone doji candlestick form last week, clocking a session high of 1.3270. Formed following two weeks of solid gains off trend line support (taken from the low 1.2061), the recently established candlestick configuration signals sellers may make an appearance this week. Additional upside from this point, however, has tops around 1.3342 in sight, closely followed by the 2017 yearly opening level at 1.3434 and trend line resistance taken from the peak at 1.3661.
Overall, the immediate trend faces north since bottoming in September 2017, though this move could also be considered a deep pullback in a larger downtrend from the 1.4689 peak in early January 2016.
The story on the daily timeframe shows price now touching gloves with the 50-day SMA (blue – 1.3209), after failure to test the 200-day SMA (orange – 1.3274). Beyond the noted SMAs, resistance resides around the 1.3382 neighbourhood/61.8% Fibonacci retracement ratio at 1.3357, while support can be found at the 1.3042 October 29 low, closely followed by support at 1.3018.
Areas of consideration:
Monday’s report stated price will likely dive through 1.3212 (green zone), trip lower-timeframe sell stops, and test 1.32 for a bounce higher. 1.32 is supported by the current 50-day SMA.
As evident from the chart, price did indeed test 1.32 yesterday and is currently holding ground. Traders long 1.32 have an initial upside target set around October’s opening level at 1.3239.
USD/CHF:
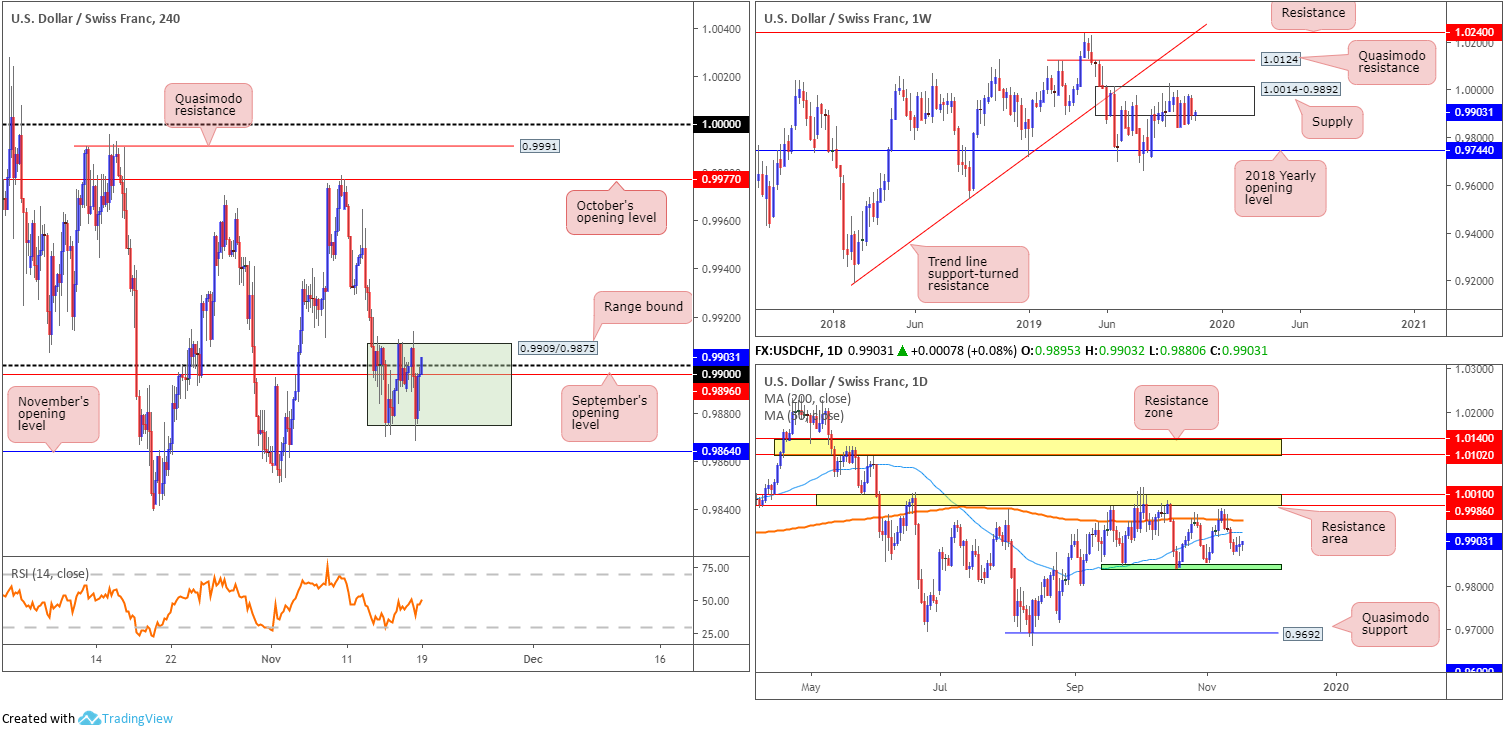
Since last week, H4 price has been pencilling in a consolidation between 0.9909/0.9875, which envelopes the 0.99 handle and September’s opening level at 0.9896. A few points south of this range lies an additional layer of support at 0.9864: November’s opening level, while a decisive break to the upside may unlock the door to October’s opening level coming in at 0.9977.
Against the back drop of short-term flows, higher-timeframe activity reveals weekly price remains nestled around the underside of supply at 1.0014-0.9892. As highlighted in previous reports, the beginning of October witnessed a penetration to the outer edge of the supply area’s limit, possibly tripping a portion of buy stops and weakening sellers. An upside move out of the said supply may draw in Quasimodo resistance at 1.0124, while downside has the 2018 yearly opening level at 0.9744 in sight. According to the primary trend, price also reflects a slightly bullish tone; however, do remain aware we have been range bound since the later part of 2015 (0.9444/1.0240).
Since mid-September, daily action has been busy carving out a consolidation between support around the 0.9845ish region (green) and a resistance area coming in at 1.0010/0.9986. Interestingly, between the said range, the 200-day and 50-day SMAs are seen closing in on each other (orange – 0.9949/blue – 0.9922).
Areas of consideration:
This market remains an incredibly difficult read, in terms of locating high-probability trading opportunities.
Longs above the current H4 range, while appealing on the H4 timeframe, must contend with the 50-day SMA at 0.9922 on the daily scale. And shorts beyond the current H4 range almost immediately land at H4 support from 0.9864.
Dow Jones Industrial Average:
US stocks drifted higher in a quiet session Monday, with few major economic and earnings reports on the calendar. The Dow Jones Industrial Average added 31.33 points, or 0.11%; the S&P 500 advanced 1.57 points, or 0.05% and the tech-heavy Nasdaq 100 rallied 12.96 points, or 0.16%.
Although a relatively subdued day in the markets, the Dow Jones closed at records yesterday, reaching an all-time high of 27966. Technically, however, limited change is observed. For that reason, much of the following will echo thoughts put forward in Monday’s weekly briefing.
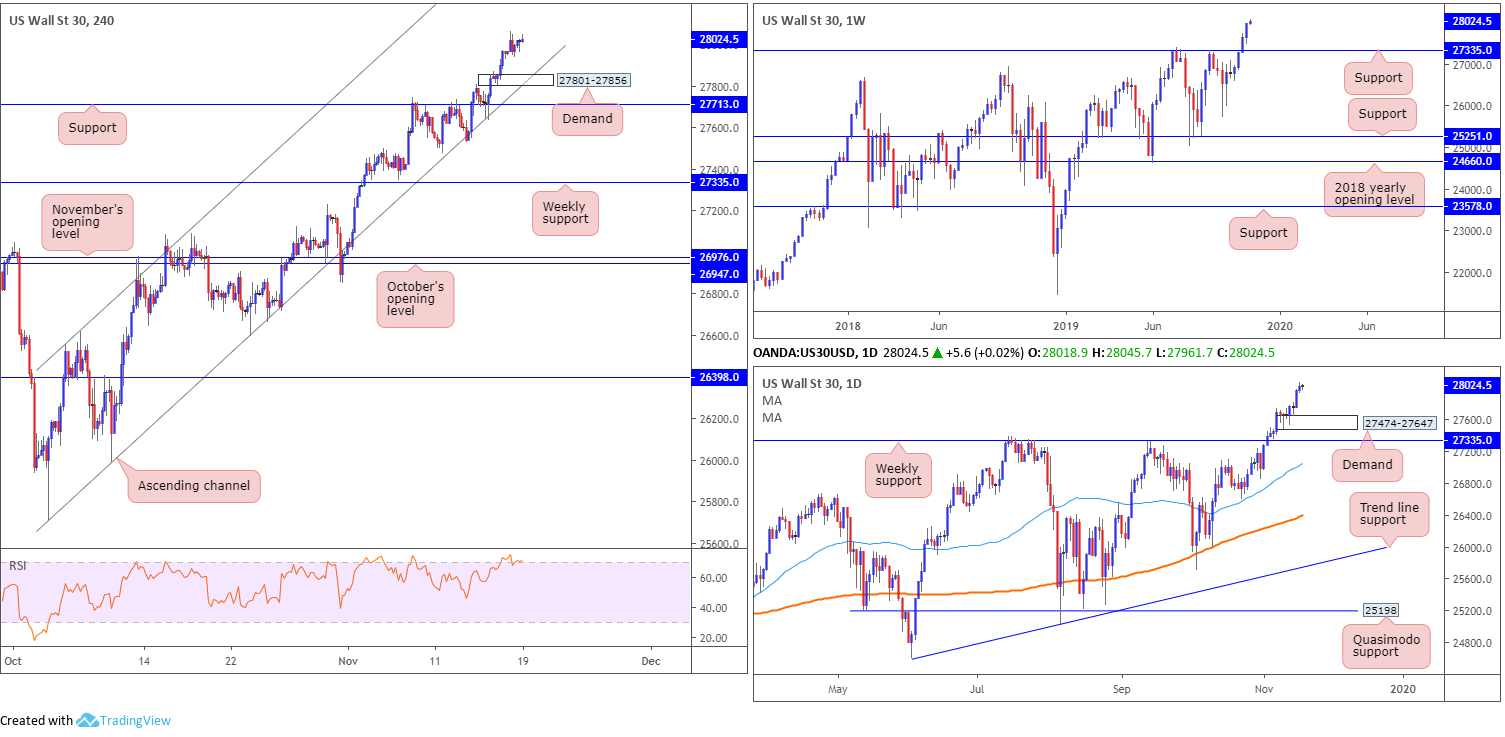
From the weekly timeframe, resistance at 27335 gave way in past trade and allowed the index to clock record highs. On account of this, a pullback to 27335 could be in store over the coming weeks for potential long opportunities.
Technically speaking, there’s little difference between the weekly and daily timeframes this week. Weekly support is also set as a central floor on this scale at 27335, though local demand coming in at 27474-27647 may also hinder downside.
For traders who remain long Thursday’s H4 hammer candlestick formation (considered a bullish signal at troughs) off channel support extended from the low 25710, ended the week in strong profits. Moving the protective stop-loss order to beneath 27801 (the lower edge of demand) is now an option, should you wish to trail profits.
Areas of consideration:
A pullback to H4 demand at 27801-27856, given the strength of the uptrend right now, is certainly a potential scenario this week, particularly at the point it merges with the current H4 channel support. Traders wishing to add a little more confirmation to the mix may wait and see if H4 price chalks up an additional candlestick pattern before pulling the trigger; entry and risk can then be calculated based on this structure.
In the event we push to further records this week, nevertheless, traders long this market may consider moving their trailing stop-loss order to beneath 27936.
XAU/USD (GOLD):
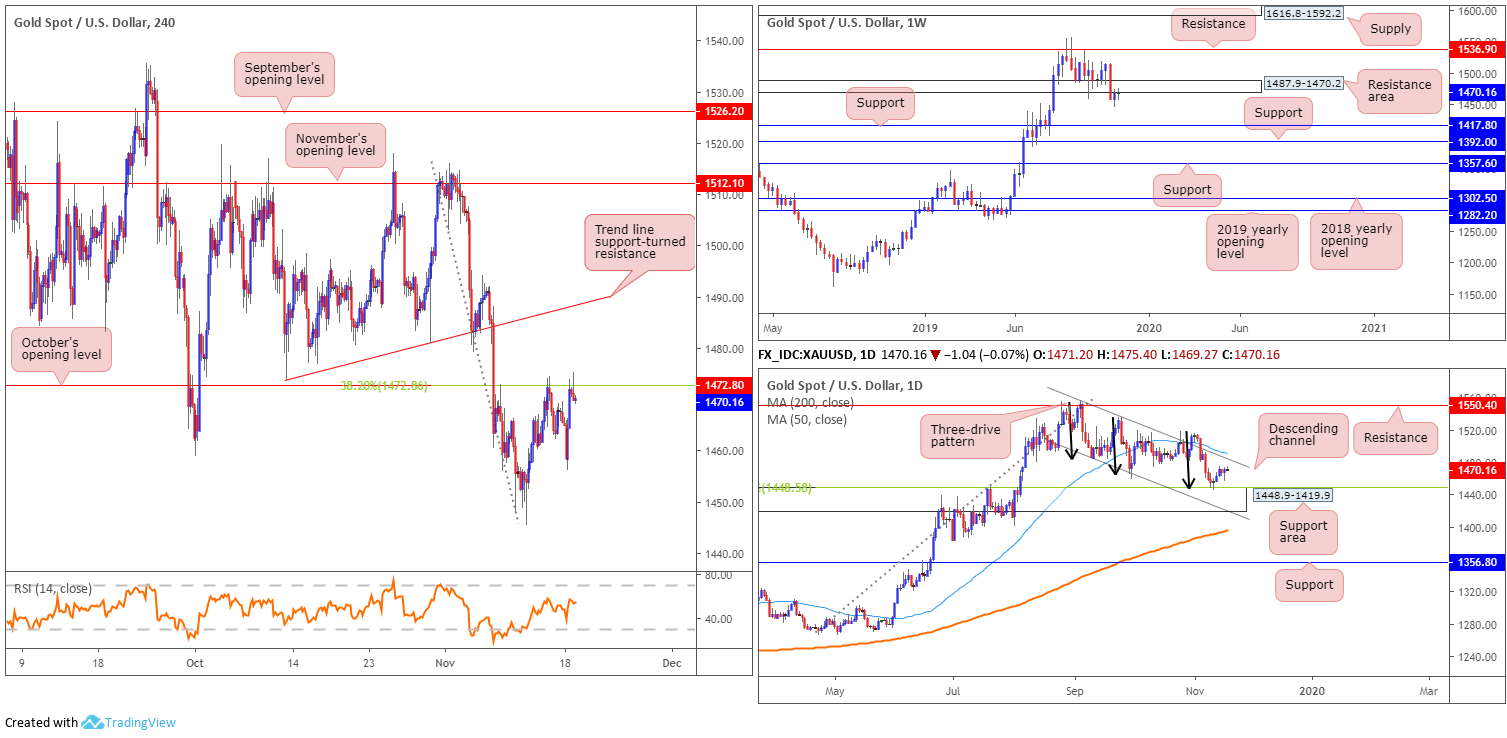
XAU/USD spot explored higher ground Monday amid concerns regarding the latest trade developments between the US and China. The response pulled H4 price back towards resistance (October’s opening level) located at 1472.8, which aligns with a 38.2% Fibonacci retracement ratio. A violation of this level today potentially sets the stage for a move towards trend line support-turned resistance extended from the low 1473.8, while a rejection could eventually guide the metal back to the top edge of a daily support area coming in at 1448.9-1419.9.
Higher-timeframe flow shows the current daily support aligns closely with a 38.2% Fibonacci retracement ratio at 1448.5. What’s also interesting here is the completion of a three-drive pattern around the top edge of the said support zone (black arrows). Upside targets lie at the upper daily channel taken from the high 1557.1 and 50-day SMA (blue – 1491.7).
Weekly price recovered somewhat last week and retested the lower edge of a support-turned resistance area at 1487.9-1470.2. Rejection off the underside of this base could set the long-term stage for a move towards two layers of support at 1392.0 and 1417.8.
Areas of consideration:
Outlook essentially unchanged.
Traders who remain short based on Thursday’s price action (see report here: https://www.icmarkets.com/blog/friday-15th-november-us-retail-sales-eyed-as-the-dollar-recedes-lower/), with protective stop-loss orders above the current weekly resistance area at 1487.9, are still likely holding ground as the top edge of the daily support area at 1448.9-1419.9 remains the initial downside target.
Those who entered long from the current daily support area, however, may feel the sting of weekly sellers this week, therefore close attention to any long positions in this market is recommended.
The accuracy, completeness and timeliness of the information contained on this site cannot be guaranteed. IC Markets does not warranty, guarantee or make any representations, or assume any liability regarding financial results based on the use of the information in the site.
News, views, opinions, recommendations and other information obtained from sources outside of www.icmarkets.com.au, used in this site are believed to be reliable, but we cannot guarantee their accuracy or completeness. All such information is subject to change at any time without notice. IC Markets assumes no responsibility for the content of any linked site.
The fact that such links may exist does not indicate approval or endorsement of any material contained on any linked site. IC Markets is not liable for any harm caused by the transmission, through accessing the services or information on this site, of a computer virus, or other computer code or programming device that might be used to access, delete, damage, disable, disrupt or otherwise impede in any manner, the operation of the site or of any user’s software, hardware, data or property.


