
EUR/USD:
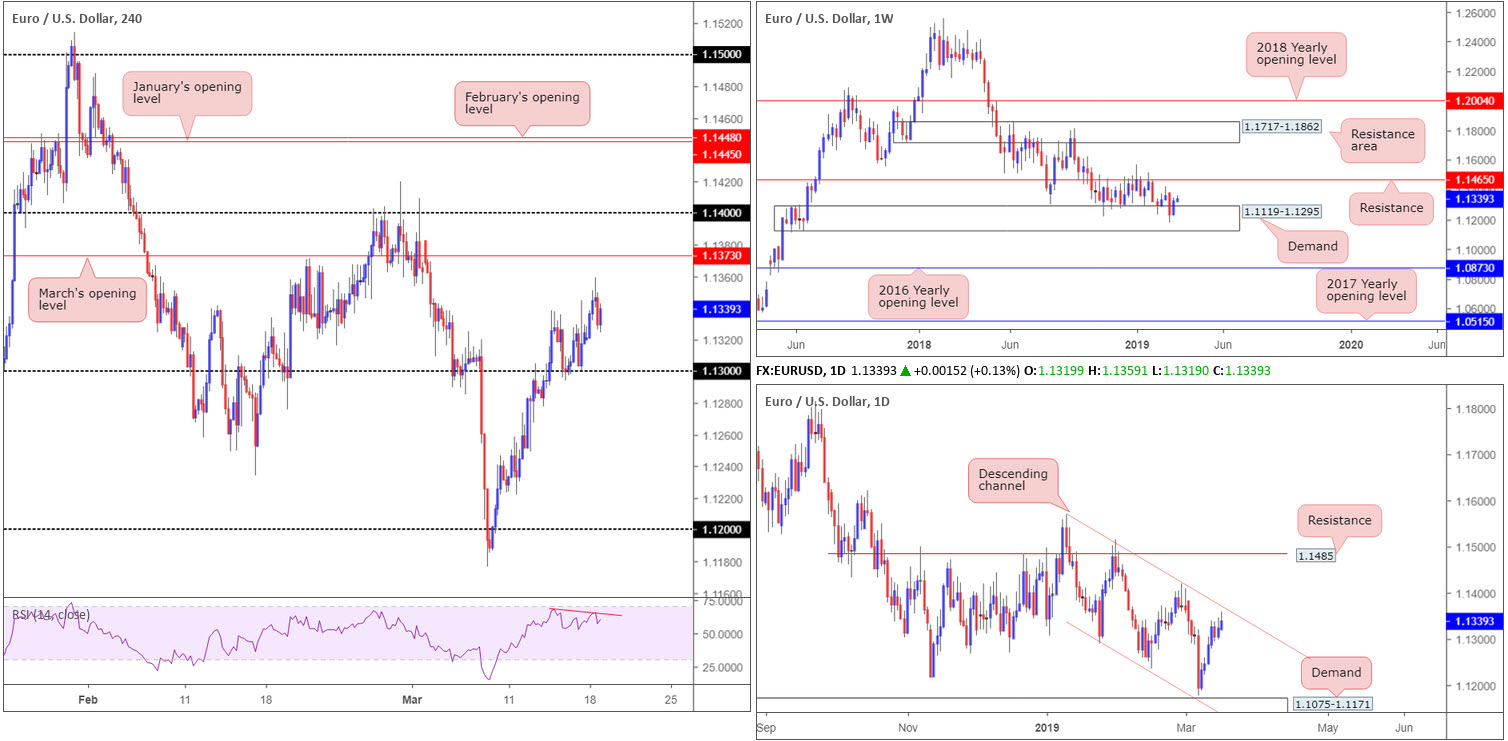
EUR/USD bulls went on the offensive Monday, extending Friday’s rally. Up 0.10%, the pair is closing in on a daily channel resistance etched from the high 1.1569. Whether or not this barrier holds (in motion since the beginning of the year), though, is difficult to judge. This is due to where the market is trading from on the weekly timeframe: notable demand coming in at 1.1119-1.1295. On this scale, scope to advance as far north as resistance at 1.1465 is seen.
A closer reading on the H4 timeframe has March’s opening level at 1.1373 as its next upside target, closely followed by 1.14. Beneath current price, 1.13 is visible, which, as you can see, provided critical intraday support last week. It might also be of interest to some traders to note the RSI indicator is chalking up a mild divergence reading (red line) just south of its overbought value.
Areas of consideration:
March’s opening level mentioned above on the H4 timeframe at 1.1373 is likely of interest to many traders this morning. Not only does it boast reasonably attractive history as a local support and resistance, it aligns closely with the current daily channel resistance. Despite this confluence, do remain cognizant of where we’re coming from on the weekly timeframe (demand). For that reason, waiting for a H4 bearish candlestick signal to form off 1.1373 before pulling the trigger is recommended. Not only will this pattern identify seller intent, it’ll also provide entry/risk levels to work with.
Today’s data points: German ZEW Economic Sentiment.
GBP/USD:
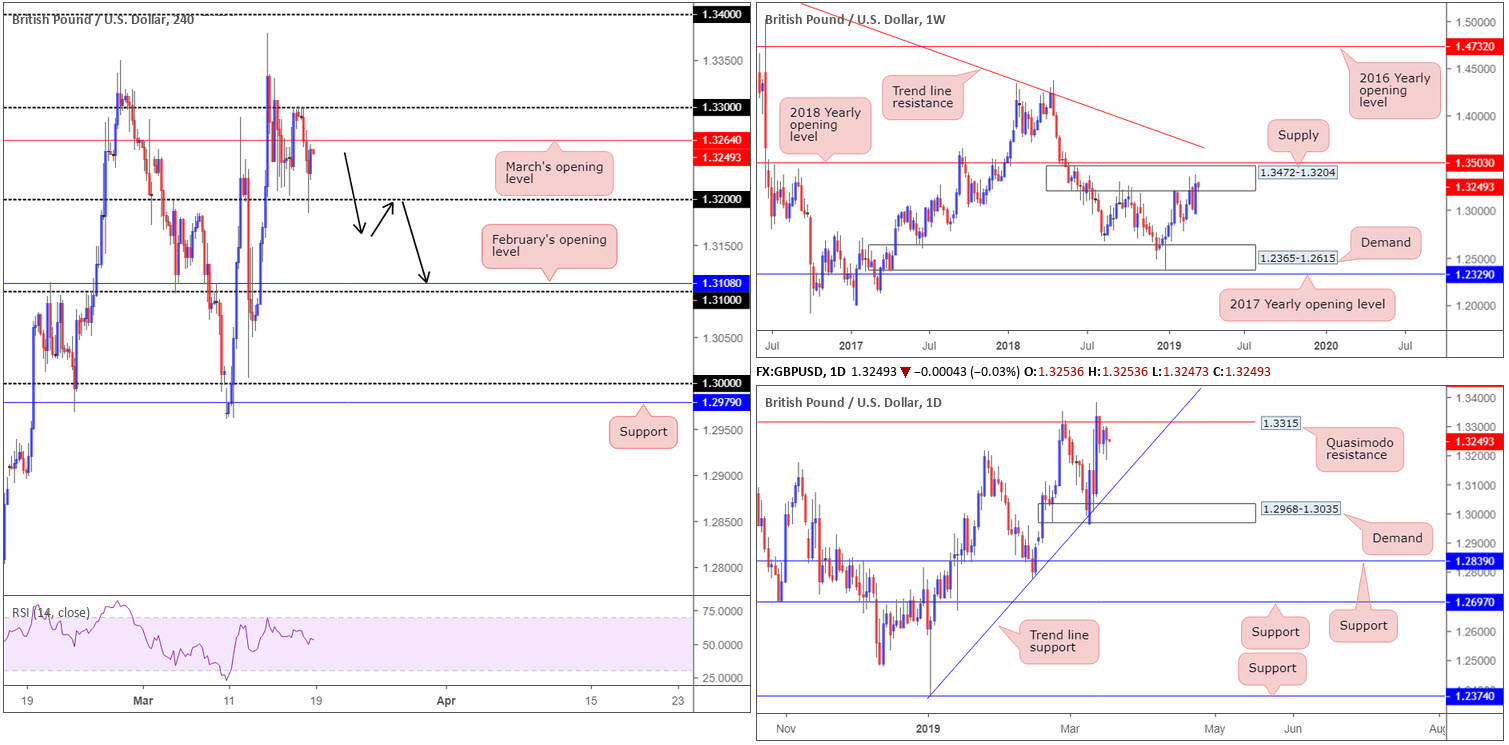
Using a top-down approach this morning, weekly movement is, as underlined in Monday’s briefing, seen dipping its toes back into supply coming in at 1.3472-1.3204. In view of the number of times this area has been tested since July 2018, the supply’s foundation is likely weakened, giving rise to a possible advance towards the 2018 yearly opening level at 1.3503.
The picture on the daily timeframe reveals the market is trading beneath Quasimodo resistance at 1.3315. Nearby trend line support (taken from the low 1.2373) is the next downside target from current price, whereas a decisive break above 1.3315 places resistance at 1.3465 in the spotlight (not seen on the screen).
1.33 on the H4 timeframe served as a strong ceiling Monday, with a robust selloff witnessed from the number in the early hours of London. Sellers absorbed March’s opening level nearby at 1.3264 and mustered enough strength to challenge 1.32, which, as is evident from the chart, was enthusiastically defended into the close.
In the event the pair continues to press for lower ground today/this week and overthrows 1.32, a reasonably clear run towards February’s opening level at 1.3108 is visible, shadowed closely by 1.31.
Areas of consideration:
Buying this market would, given resistances seen on both the weekly and daily timeframes, be a chancy move.
Selling, on the other hand, is interesting. A sell from March’s opening level mentioned above at 1.3264 is an option, targeting 1.32 and beyond. The more conservative route, nonetheless, would be to wait for a close beneath 1.32 to come to fruition. This, followed up by a retest (entry and stop-loss orders can be placed according to the rejecting candle’s structure), has a strong chance of reaching 1.31 (black arrows).
Today’s data points: UK Average Earnings Index 3m/y; UK Unemployment Rate; UK Claimant Count Change.
AUD/USD:
The Australian dollar kicked off the week on a strong footing, boosted by lower iron ore grades rallying to multi-year highs on Friday.
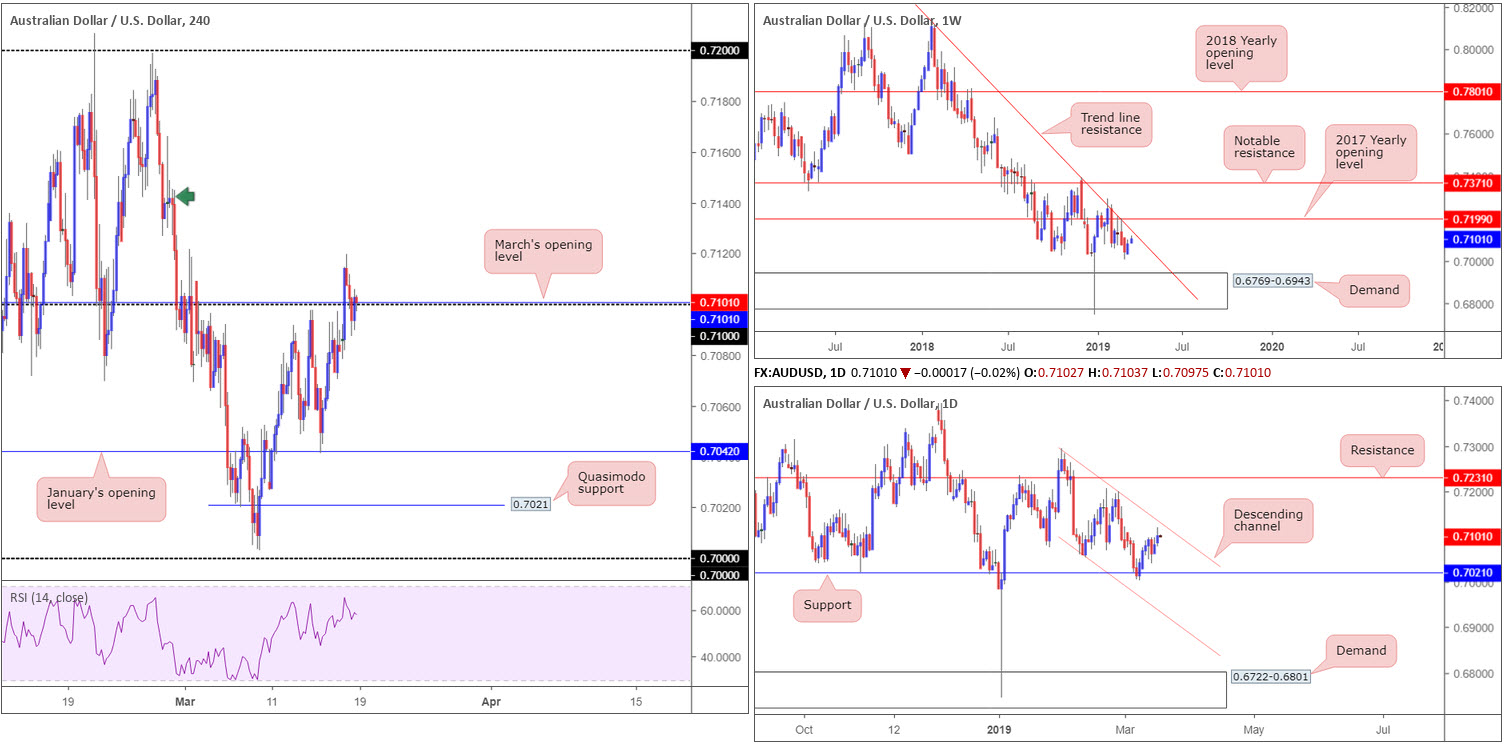
After clocking monthly highs at 0.7119 in early London, though, the AUD/USD failed to sustain its upside presence. The H4 candles settled for the day two pips north of 0.71, up 0.30%.
Another break of 0.71 has a reasonably clear run towards 0.72 on the H4 timeframe. H4 Supply marked with a green arrow at 0.7166-0.7142 could be problematic, however, given its association with the daily channel resistance extended from the high 0.7295 and the weekly trend line resistance taken from the high 0.8135. Note both higher-timeframe levels emphasise strength.
Areas of consideration:
Having seen strong resistance nearby on the higher timeframes, traders are urged to be wary of entering long above 0.71, particularly with a large stop-loss order, as daily sellers will likely enter the fray from the aforementioned channel resistance (around 0.7126ish).
Ultimately, the research team is looking for the higher-timeframe resistances to enter the fold. This – coupled with a strong push back beneath 0.71 on the H4 scale – is likely enough to ignite seller interest, particularly with a confirming round number support failure. This may come to fruition today since in early hours we have RBA Monetary Policy Meeting Minutes hitting the wires. If so, keep eyes on a possible retest to the underside of 0.71 (entry and stop-loss orders can be placed according to the rejecting candle’s structure).
Today’s data points: RBA Monetary Policy Meeting Minutes.
USD/JPY:
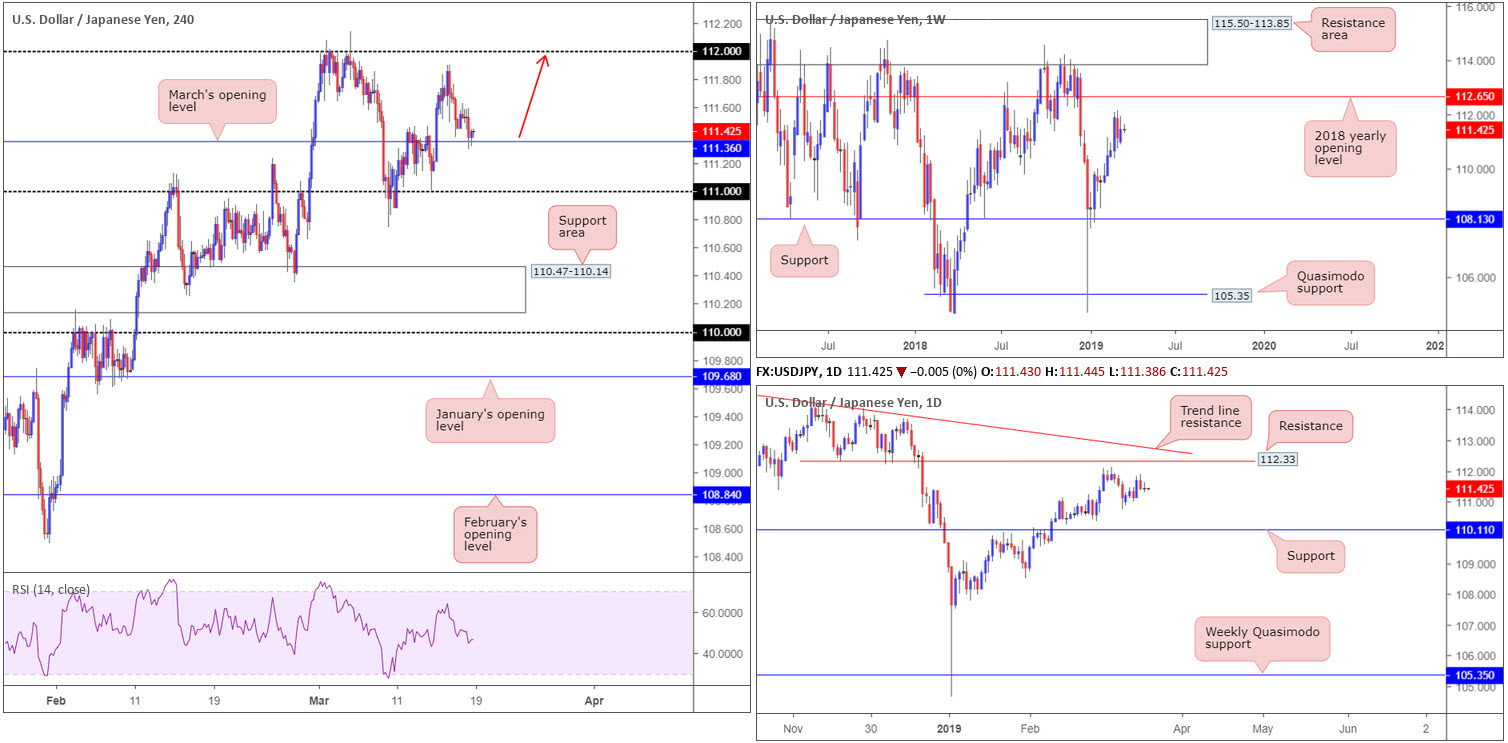
For those who read Monday’s briefing you may recall the piece underscoring a potential long from March’s opening level on the H4 timeframe at 111.36. H4 price, as you can see, touched gloves with this level in recent hours and sketched in a (mild) bullish pin-bar formation. A failure of 111.36, nonetheless, will likely draw the unit in the direction of 111, which provided the market reasonably strong support of late.
In terms of where we stand on the higher timeframes, the pendulum remains swinging in favour of the buyers at the moment. As for structure on the weekly timeframe, pivotal resistance at 112.65 (the 2018 yearly opening level) is seen, potentially signifying the market has room to advance. The daily candles, however, have printed a series of higher highs and higher lows since bottoming at 104.65 at the beginning of the year. Recent selling found support around the 110.74 March 8 low and has thus far shown possibility to the upside, with resistance plotted at 112.33 on the radar, followed by trend line resistance extended from the high 114.23.
Areas of consideration:
According to the higher timeframes the buyers are in good form, with daily resistance at 112.33 in place as the first upside objective.
Seeing H4 action test 111.36 and hold in the shape of a relatively nice-looking H4 bullish candlestick signal – entry and risk levels can be determined on the back of this structure – a rally towards 112 could be on the cards (red arrow) today.
Today’s data points: Limited.
USD/CAD:
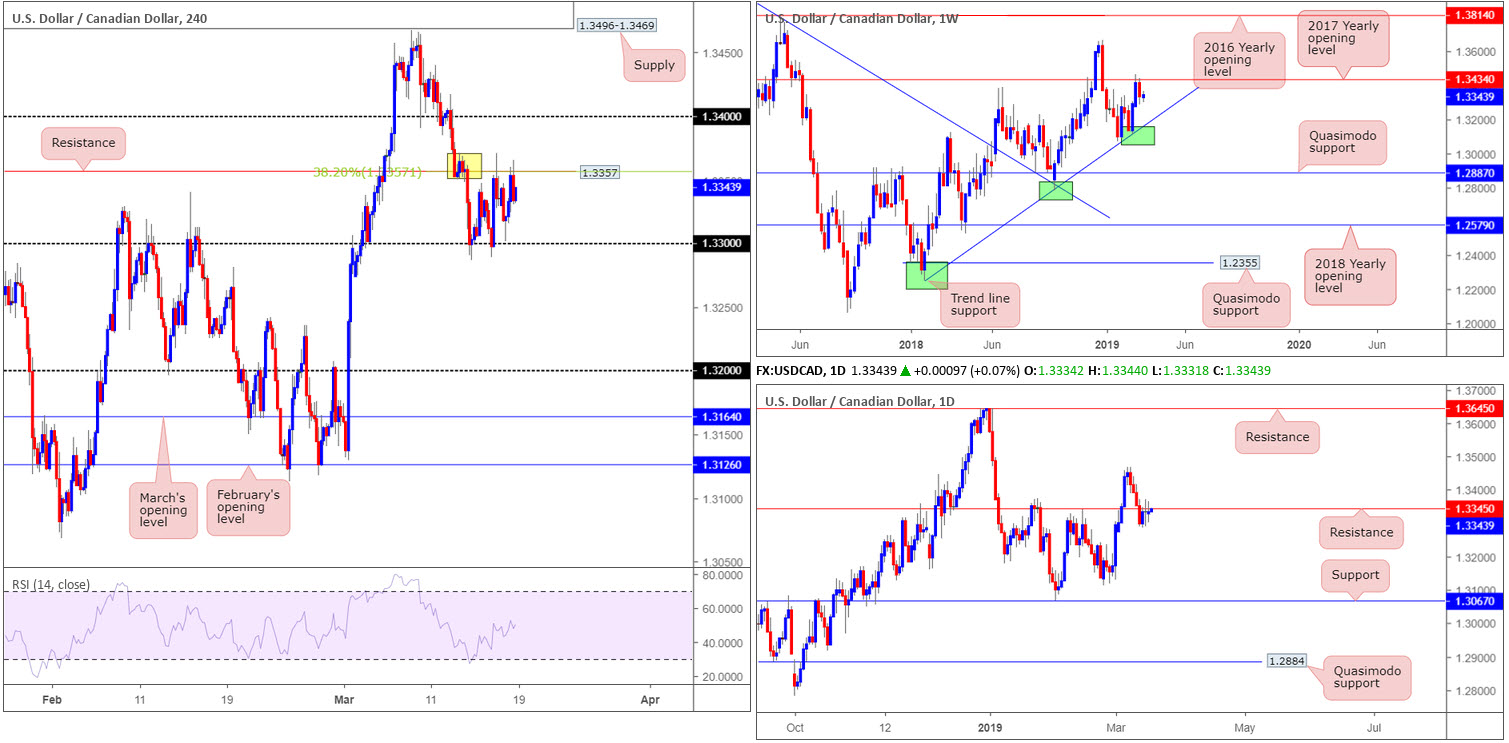
For now, the H4 candles are encased between a resistance level at 1.3357 (merging with a 38.2% Fibonacci resistance value as well as a supply zone [yellow] at 1.3371-1.3350), and 1.33. Outside of this border, 1.34 as a resistance is in sight, whereas a move under 1.33, according to our technical studies, has a free run in the direction of 1.32. The space visible between 1.33 and 1.32 is clear. No doubt many technicians will be looking to sell a break of 1.33.
Shifting focus to the weekly timeframe, price action shattered a two week bullish phase last week, following the pair crossing swords with its 2017 yearly opening level at 1.3434. Additional selling could come to fruition this week as the next support target does not enter the fight until trend line support (extended from the low 1.2421).
Last Wednesday observed daily action nudge its way through support at 1.3345, and provide resistance Thursday and Friday, and also Monday as well. Note Friday’s session concluded by way of a clear-cut indecision candle, as did Monday’s segment. The 1.3112 Feb 25 low is in view should the unit push for lower ground, closely tailed by a reasonably well-rounded support at 1.3067.
Areas of consideration:
Conservative sellers may opt to wait and see if 1.33 is engulfed to the downside. A H4 close below this number that’s followed up with a retest (entry and stop levels can be defined according to the rejecting candle’s limits) is, given the picture on the higher timeframes, a high-probability sell, targeting 1.32.
Today’s data points: Limited.
USD/CHF:
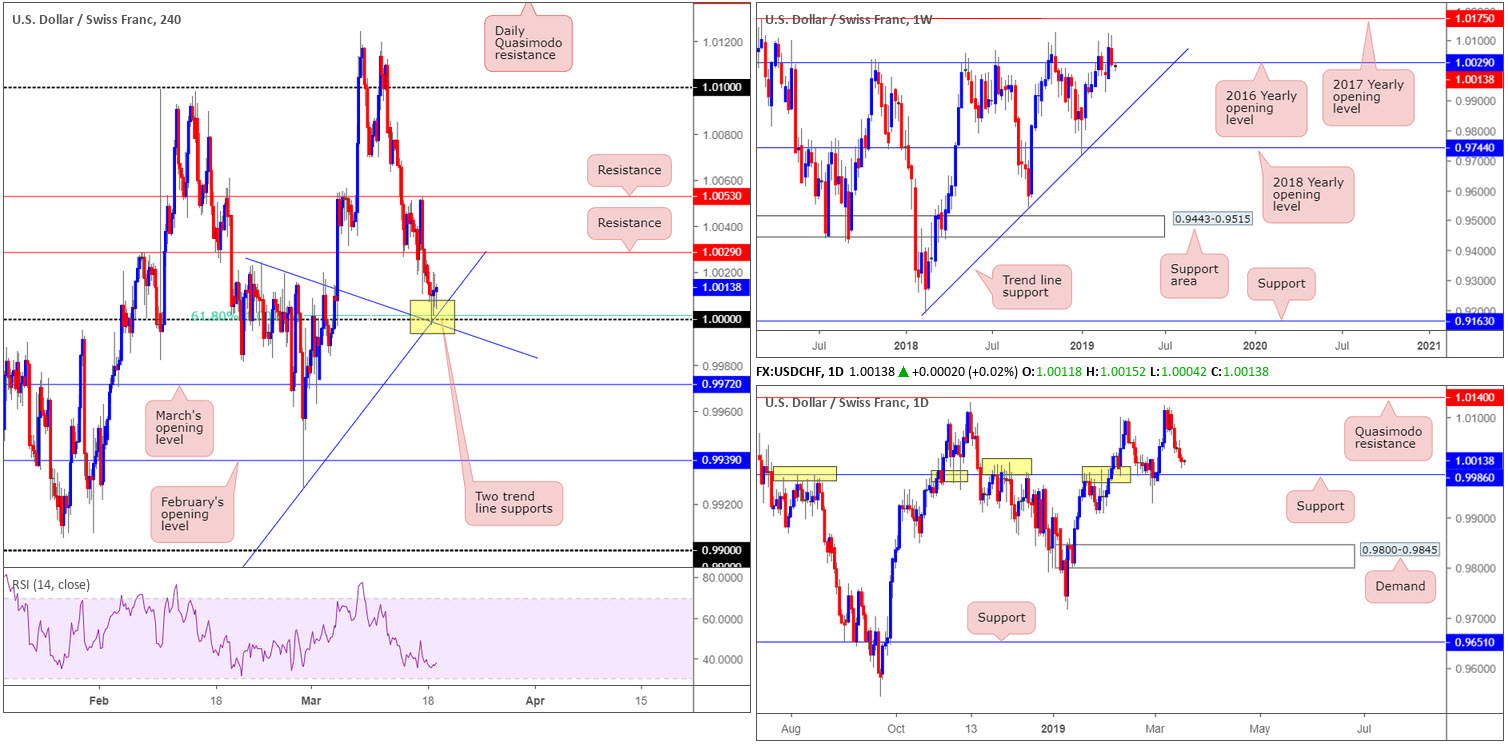
Starved of support, the USD/CHF extended Friday’s losses Monday and tested key figure 1.0000 (parity) on the H4 timeframe. This level is a noted barrier and was emphasised in Monday’s briefing. 1.0000 finds additional support from a 61.8% Fibonacci value at 1.0001 and two merging trend line supports (1.0024/0.9716). As is evident from the H4 chart this morning, 1.0000 held firm with price trading at 1.0013 as of writing.
In regards to the bigger picture this morning, daily support at 0.9986 (a level that boasts incredibly strong history [yellow]) remains eyed. Traders may also recall the research team urging traders to pencil in a possible fakeout beyond 1.0000 into daily support before serious buyers stepped in. As of now, though, enough bids appear to be supporting the market.
Last week’s weekly candle concluded marginally beneath the 2016 yearly opening level at 1.0029. Having seen this level cap upside since May 2017 a move lower from here could take shape. The next area of interest to the downside is a trend line support extended from the low 0.9187.
Areas of consideration:
The first upside target for those long from 1.0000 is set around H4 resistance at 1.0029, followed by H4 resistance at 1.0053.
Aside from the current long in motion, the research sees little else to hang their hat on at the moment.
Today’s data points: Limited.
Dow Jones Industrial Average:
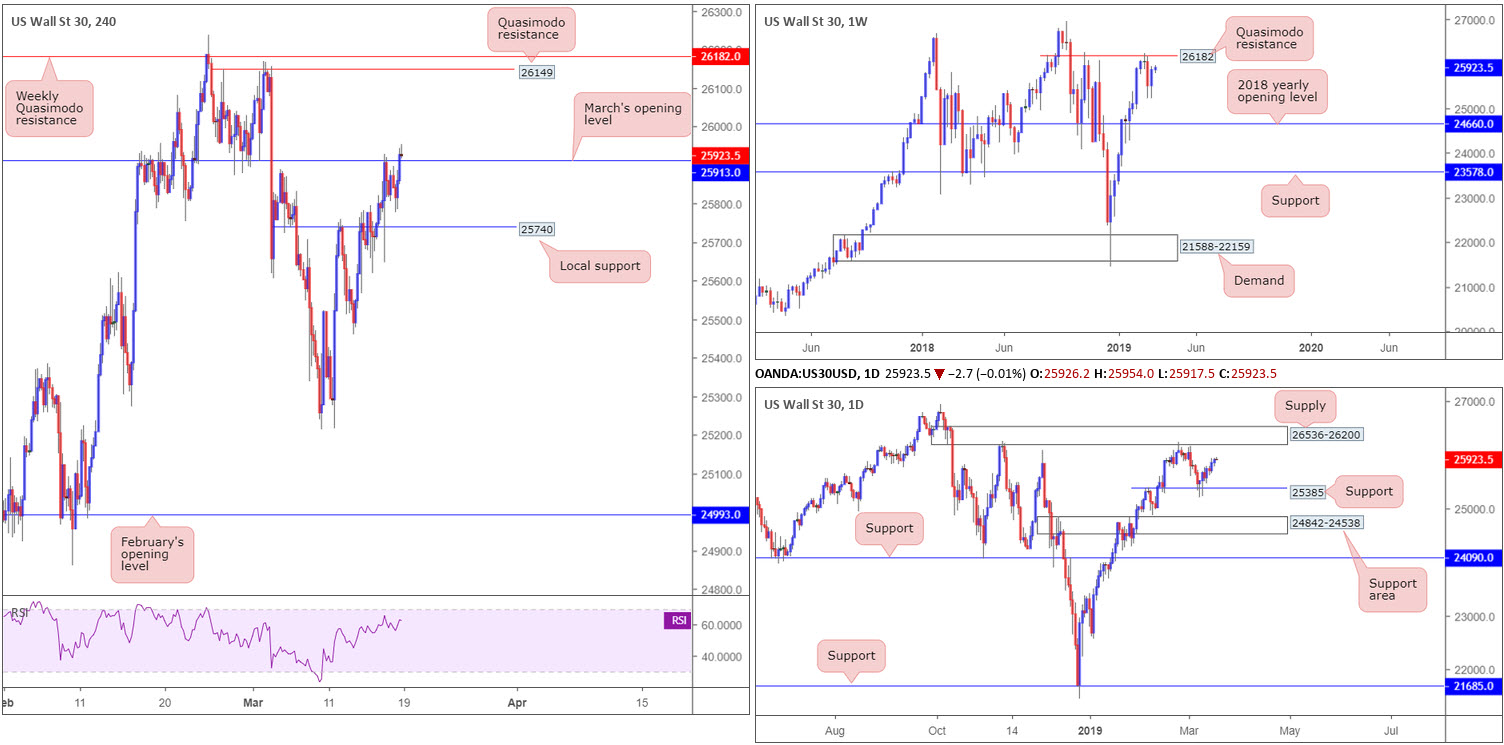
Up 0.25%, banks and tech sectors helped lead Wall Street higher Monday. Technically, the index could witness additional buying this week as weekly flow exhibits room to press as far north as Quasimodo resistance at 26182, with a break of this level having all-time highs at 26939 in sight.
Down a level, we can also see daily movement shows room to press higher. The next port of call on this timeframe falls in around supply coming in at 26536-26200. In conjunction with the higher timeframes, the H4 candles crossed above March’s opening level at 25913 yesterday and potentially set the stage for further buying today/this week towards Quasimodo resistance at 26149, tailed closely by the weekly Quasimodo resistance mentioned above at 26182.
Areas of consideration:
With sellers possibly cleared from March’s opening level at 25913 on the H4 timeframe, and both weekly and daily price demonstrating space to explore higher ground, entering long in this market is an option.
Conservative traders will likely be looking for a retest play to emerge off 25913 as support today. A decisive rejection off here not only confirms buyer intent, but it also provides a framework for entry and risk (using the open and low of the rejecting candle). For the more aggressive trader, nevertheless, they may already be long on the H4 close above 25913 with stop-loss orders tucked beneath the breakout candle’s tail (25848).
Irrespective of the entry technique, the H4 Quasimodo resistance at 26149 is the first take-profit target.
Today’s data points: Limited.
XAU/USD (GOLD):
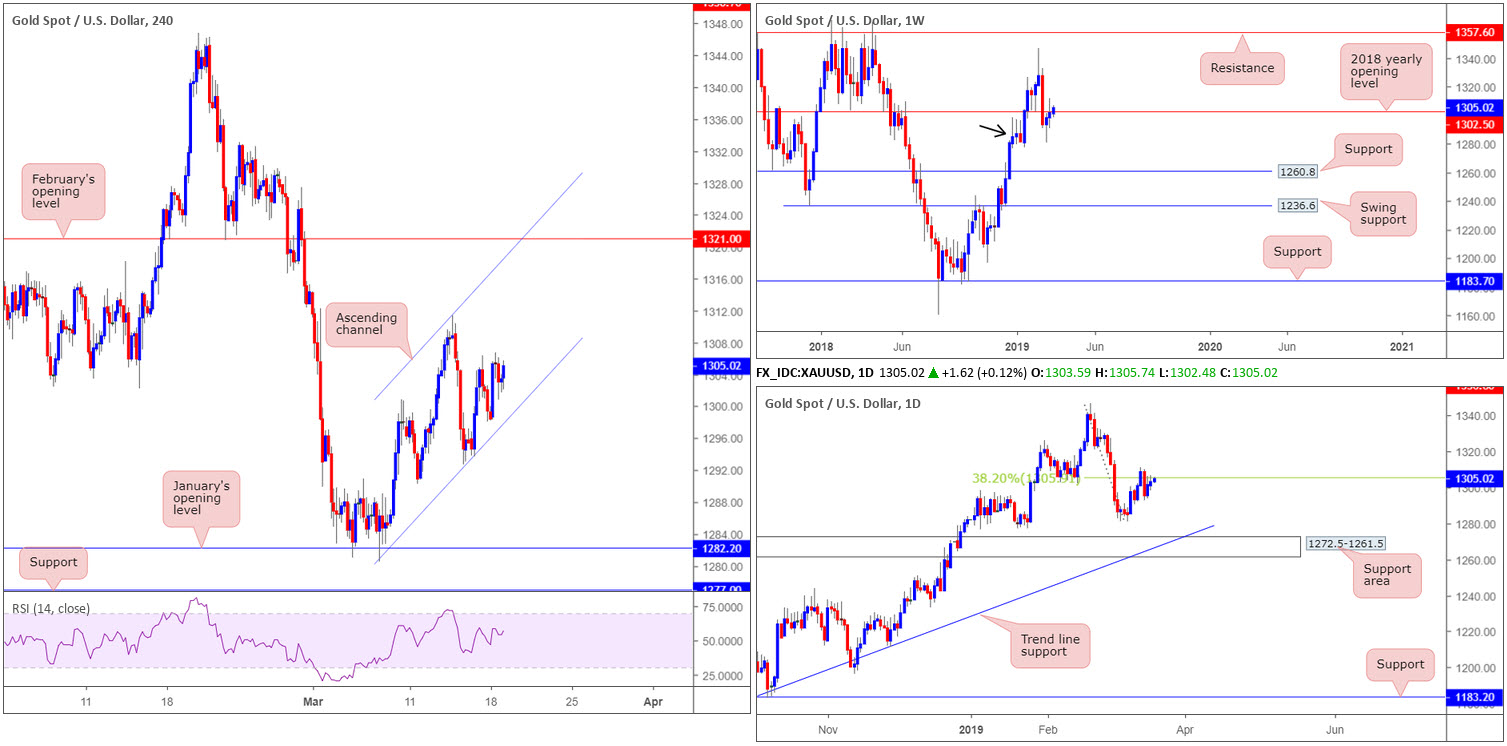
Demand on the weekly timeframe at 1276.5-1298.5 (black arrow) is seen holding this market higher for the time being, forcing bullion back above its 2018 yearly opening level at 1302.5. Meanwhile on the daily timeframe, the candles are capped by a 38.2% Fibonacci resistance value at 1305.9. This barrier, assuming it holds this week, has the support area at 1272.5-1261.5 in sight, which, as you can see, merges with a trend line support (taken from the low 1160.3). Though do bear in mind for this area to be brought into the fight, a break of the current weekly demand zone will need to take shape.
A closer examination of things on the H4 timeframe shows the candles compressing within an ascending channel formation (low: 1280.4 high: 1311.3). This could, according to our technical reading on the H4 timeframe, continue to be respected until reaching February’s opening level at 1321.0.
Areas of consideration:
As weekly price attempts to reclaim 1302.5 from demand at 1276.5-1298.5, further buying within the current H4 ascending channel pattern is a possibility this week. At current price, though, this is a challenging market to buy. Should a retest of the said channel support take form today and print a H4 bullish candlestick pattern (traders can enter and position stops based on the candlestick structure), this will likely entice buyers into the market to test last Wednesday’s high 1311.3 as an initial target.
The accuracy, completeness and timeliness of the information contained on this site cannot be guaranteed. IC Markets does not warranty, guarantee or make any representations, or assume any liability with regard to financial results based on the use of the information in the site.
News, views, opinions, recommendations and other information obtained from sources outside of www.icmarkets.com.au, used in this site are believed to be reliable, but we cannot guarantee their accuracy or completeness. All such information is subject to change at any time without notice. IC Markets assumes no responsibility for the content of any linked site. The fact that such links may exist does not indicate approval or endorsement of any material contained on any linked site.
IC Markets is not liable for any harm caused by the transmission, through accessing the services or information on this site, of a computer virus, or other computer code or programming device that might be used to access, delete, damage, disable, disrupt or otherwise impede in any manner, the operation of the site or of any user’s software, hardware, data or property


