
DXY:
For DXY (US Dollar Index), the potential direction is bearish, aligning with the overall bearish momentum of the chart. There’s a possibility of a bearish reaction off the pivot level, leading to a drop towards the 1st support.
The pivot at 103.64 is significant, marked by an overlap resistance and the presence of the 50% Fibonacci Retracement, indicating a strong level where selling pressure might intensify. Additionally, the 1st support at 103.06 acts as pullback support, suggesting a zone where buying interest could emerge, potentially halting the downward movement.
On the resistance side, the 1st resistance at 104.17 forms another barrier, supported by an overlap resistance, indicating a level where selling pressure could increase, potentially limiting further upward movement in the price.
EUR/USD:
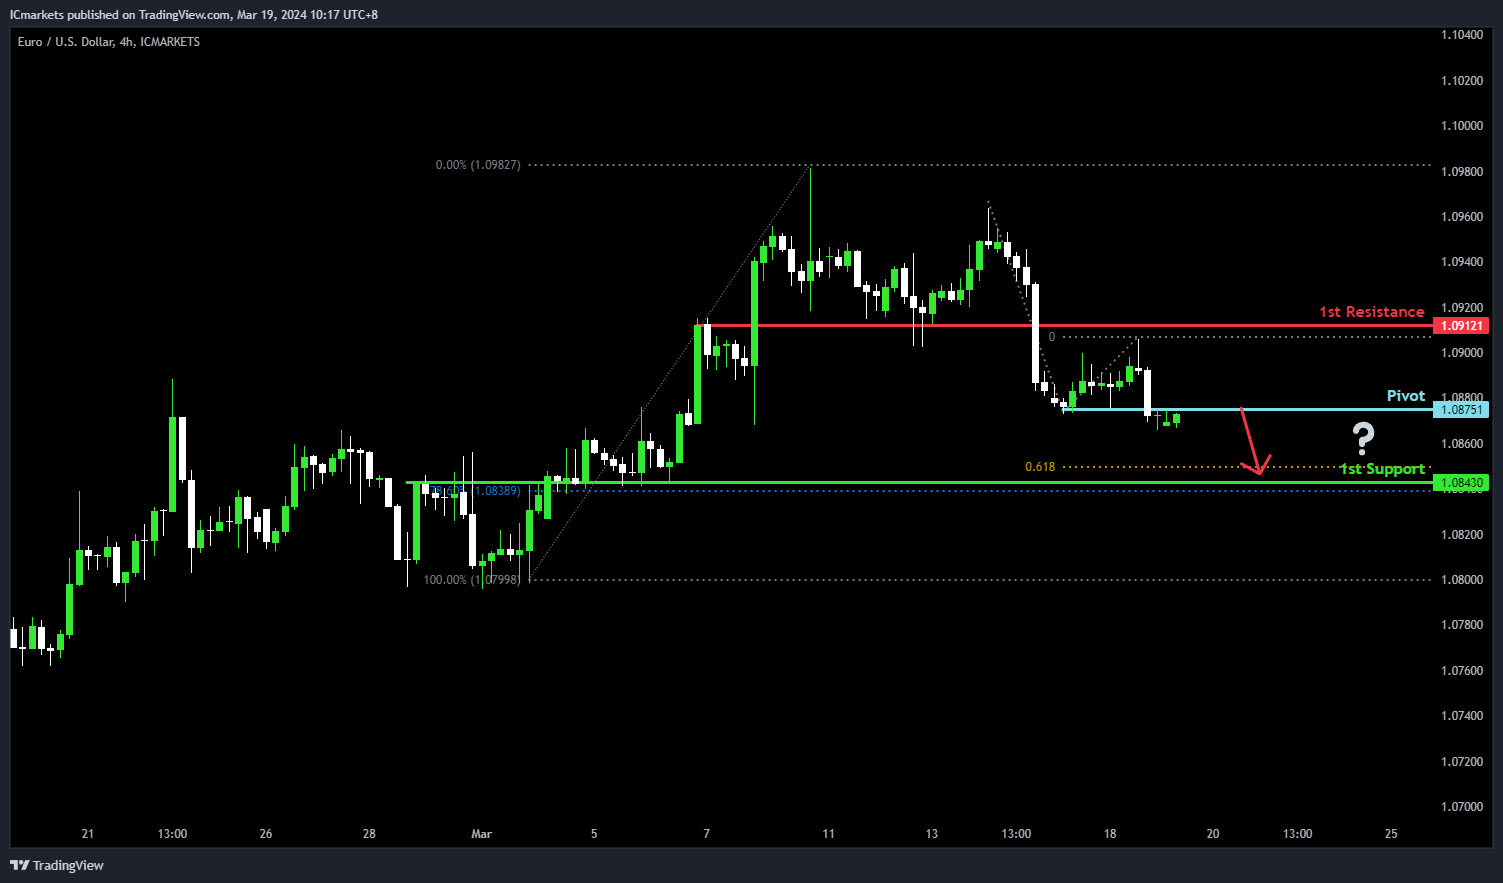
For EUR/USD, the potential direction is bearish, consistent with the overall bearish momentum of the chart. There’s a likelihood of a bearish reaction off the pivot level, potentially leading to a drop towards the 1st support.
The pivot at 1.0875 is notable, identified as an overlap resistance, suggesting a significant level where selling pressure might intensify. Additionally, the 1st support at 1.0843 acts as overlap support, reinforced by the presence of the 78.60% Fibonacci Retracement, indicating a level where buying interest could emerge, potentially halting the downward movement.
On the resistance side, the 1st resistance at 1.0912 serves as pullback resistance, suggesting a zone where selling pressure could increase, potentially limiting further upward movement in the price.
EUR/JPY:
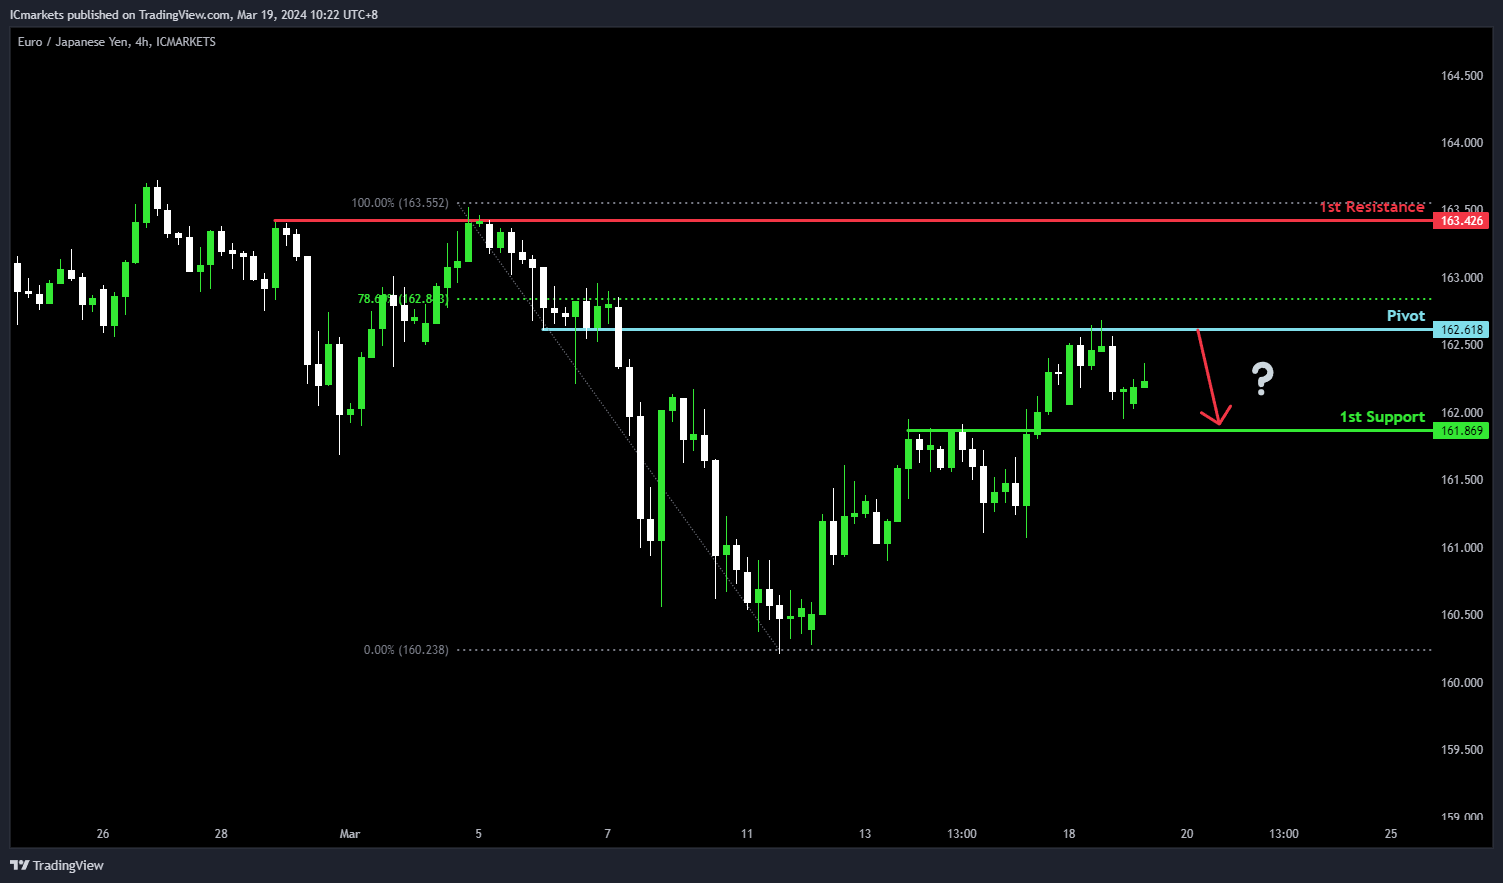
For EUR/JPY, despite the overall bullish momentum of the chart, there’s a potential scenario indicating a bearish reaction off the pivot level, potentially leading to a drop towards the 1st support.
The pivot at 162.61 serves as a notable level of overlap resistance, suggesting a significant barrier where selling pressure might intensify. On the downside, the 1st support at 161.86 is identified as pullback support, indicating a level where buyers may intervene, potentially halting the downward movement.
Additionally, the 1st resistance at 163.42 presents a barrier to upward movement, supported by multi-swing high resistance, potentially reinforcing the bearish sentiment.
EUR/GBP:
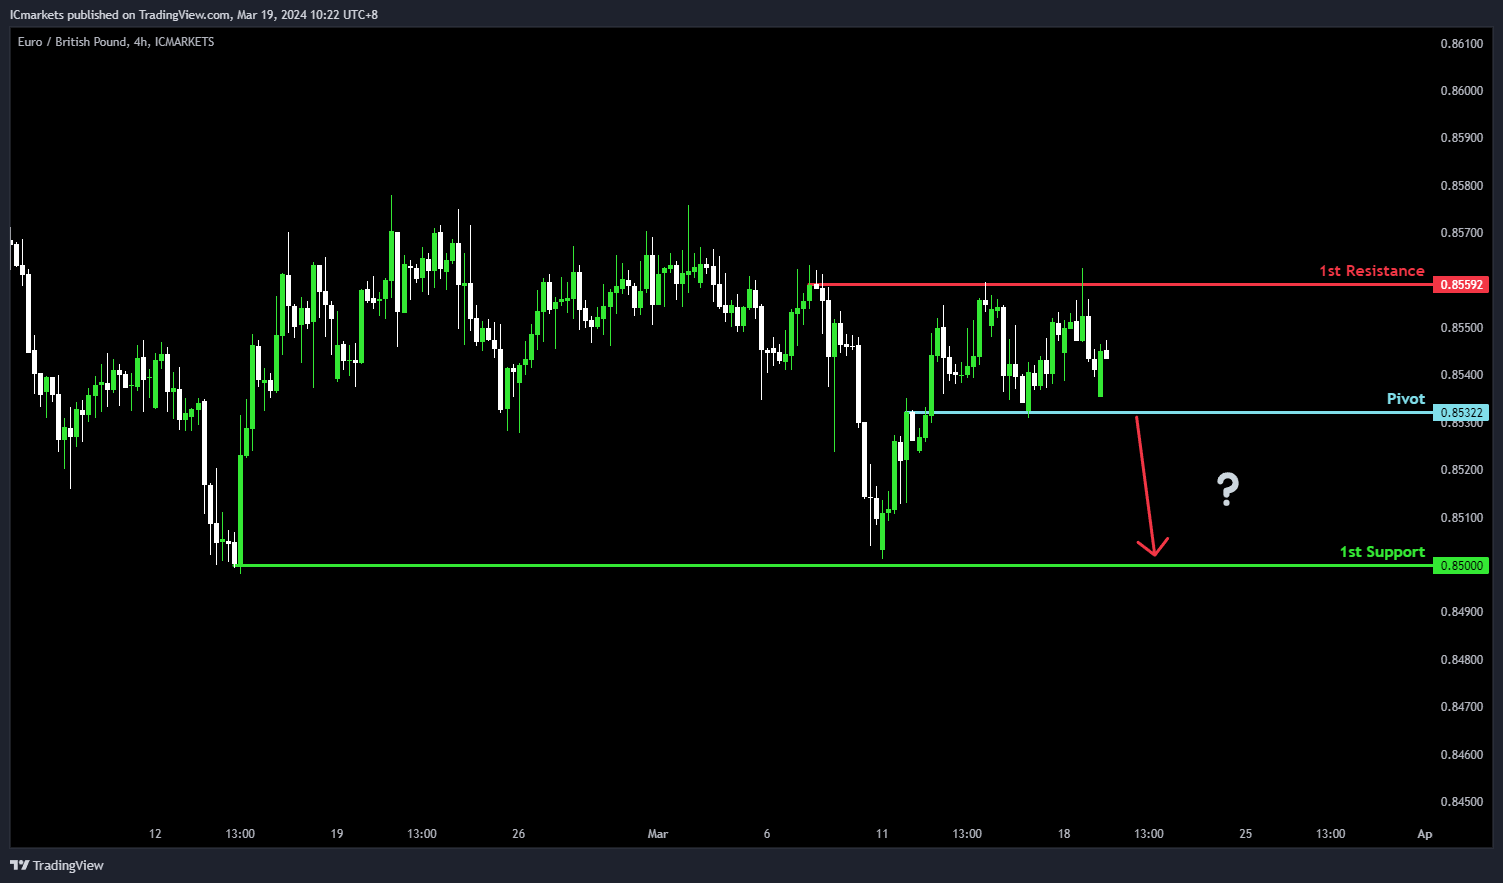
For EUR/GBP, the potential direction is neutral, aligning with the overall neutral momentum of the chart. There’s a possibility that the price may fluctuate between the 1st resistance and 1st support levels.
The pivot at 0.8532 is identified as an overlap support, indicating a level of historical significance where buyers have intervened in the past. This level may act as a pivotal point for price movements.
The 1st support at 0.8500 serves as a swing low support, suggesting a level where buying interest could potentially increase, preventing further downward movement.
Conversely, the 1st resistance at 0.8559 presents a barrier to upward movement, supported by multi-swing high resistance, potentially limiting further upward movement in the price.
GBP/USD:
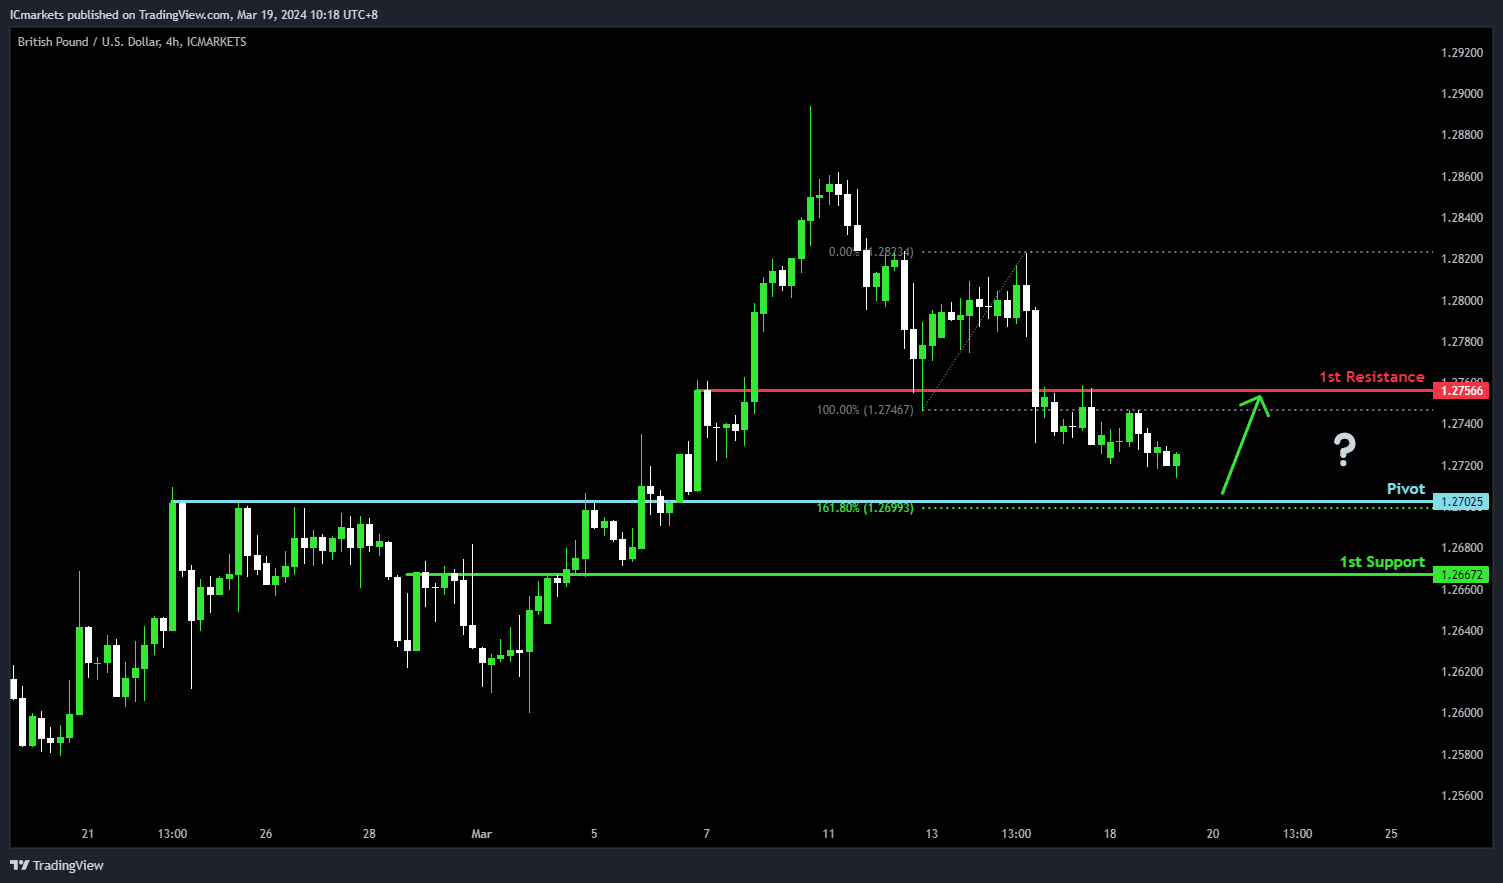
For GBP/USD, although the potential direction is stated as bearish, the scenario outlined suggests a bullish bounce off the pivot level towards the 1st resistance.
The pivot at 1.2702 is identified as pullback support, indicating a level where buyers might intervene, potentially leading to a bullish rebound. Additionally, the 1st support at 1.2667 acts as overlap support, reinforced by the presence of the 78.60% Fibonacci Retracement, suggesting a significant level where buying interest could emerge.
On the resistance side, the 1st resistance at 1.2756 serves as an overlap resistance, suggesting a zone where selling pressure might intensify, potentially limiting further upward movement in the price.
.
GBP/JPY:
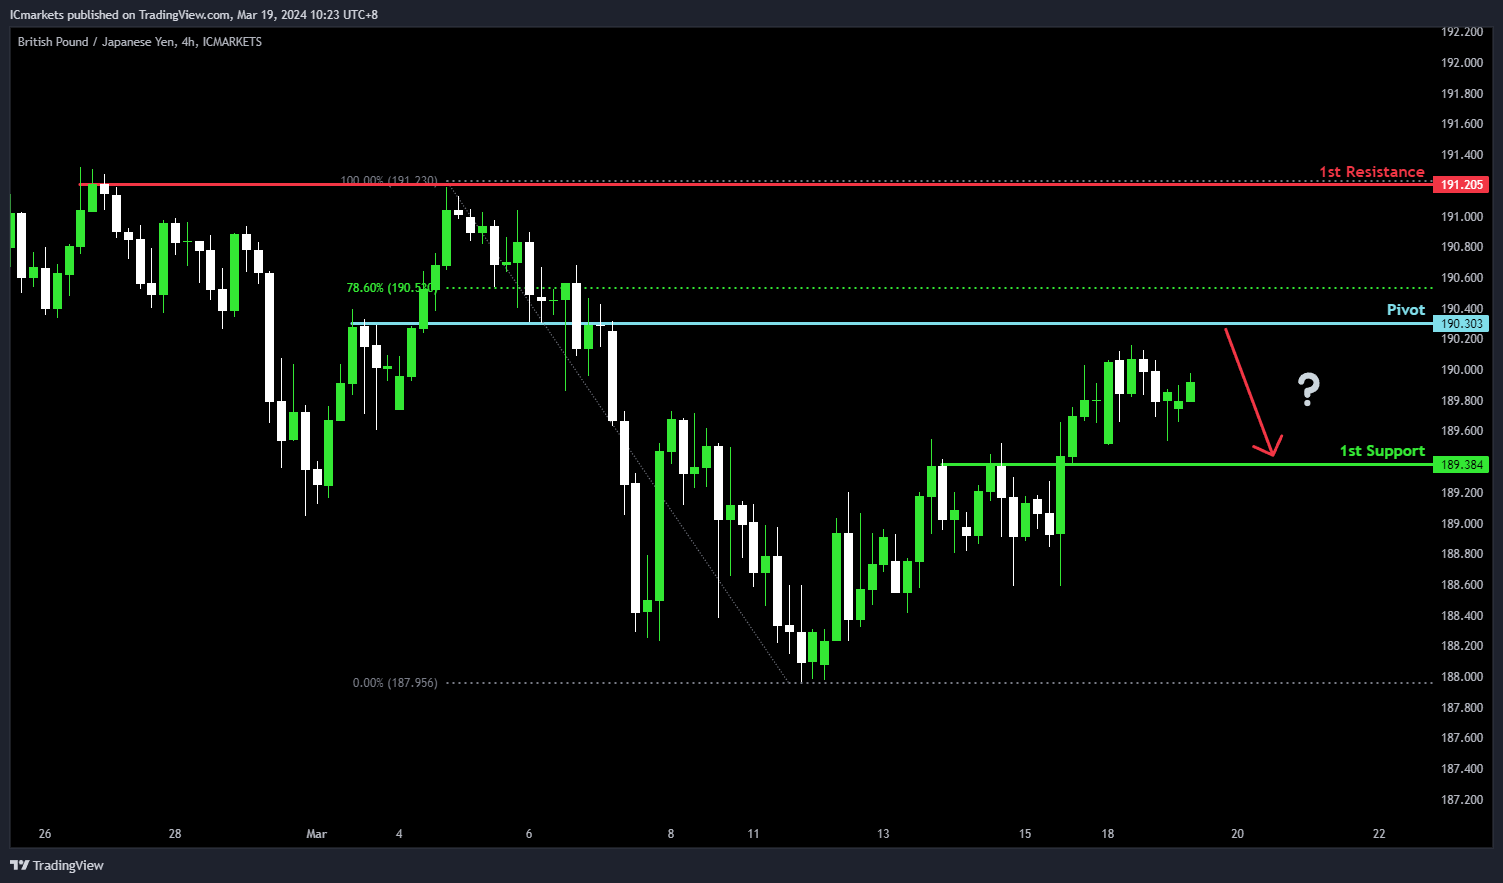
For GBP/JPY, the potential direction is bearish, although the overall momentum of the chart remains bullish. There’s a scenario where the price could potentially experience a bearish reaction off the pivot level, leading to a drop towards the 1st support.
The pivot at 190.30 is identified as an overlap resistance, suggesting a significant level where selling pressure might increase, potentially prompting a bearish move.
On the support side, the 1st support at 189.38 serves as an overlap support, indicating historical significance as a level where buyers have intervened in the past.
Conversely, the 1st resistance at 191.20 presents a barrier to upward movement, supported by multi-swing high resistance, suggesting a level where selling pressure might intensify, potentially limiting further upward movement in the price.
USD/CHF:
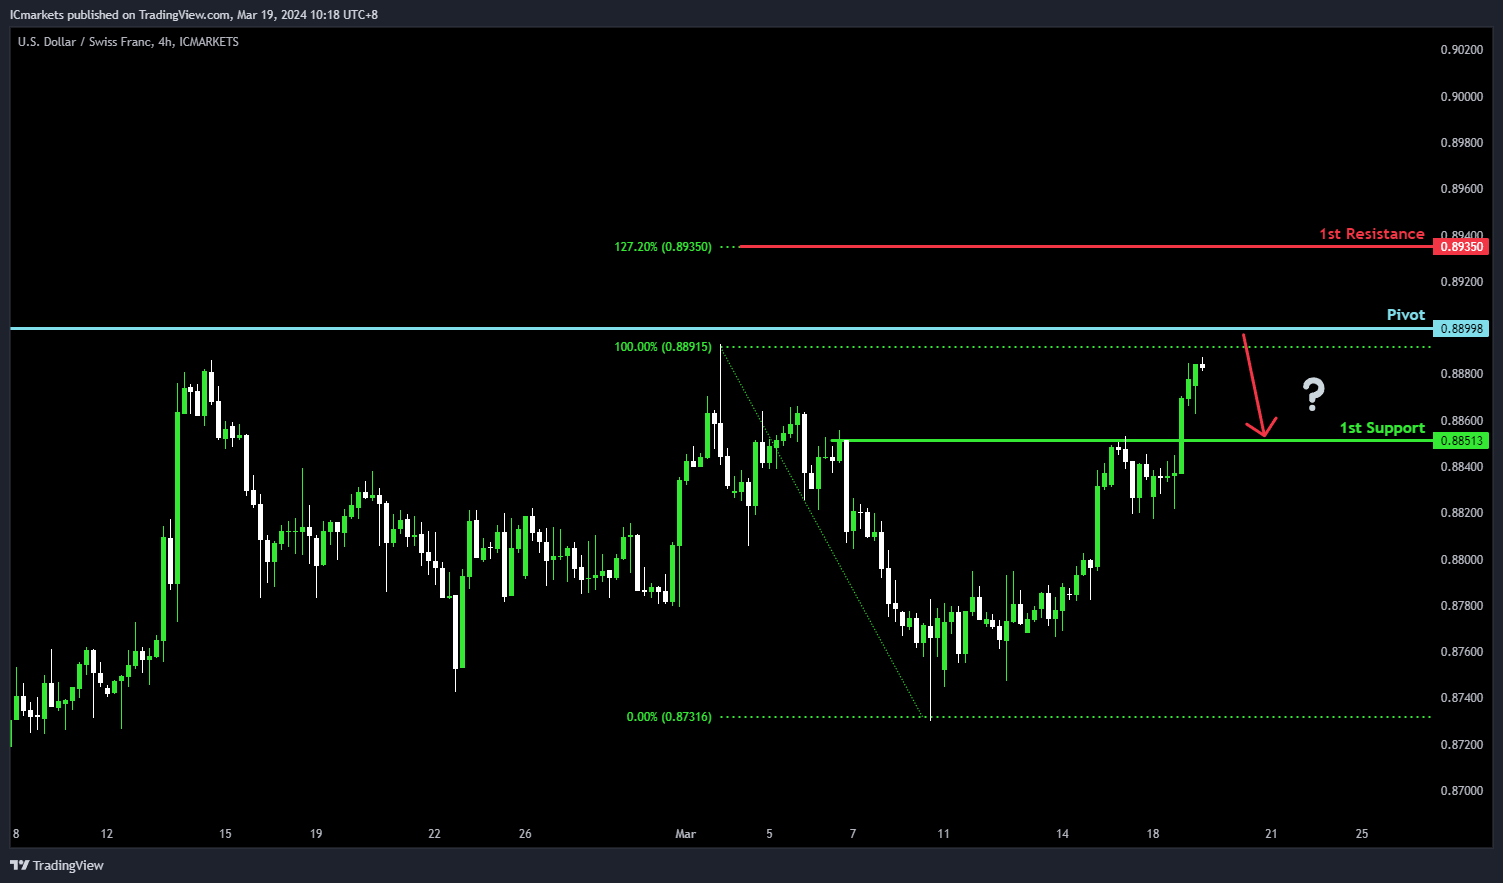
For USD/CHF, despite the overall momentum of the chart being bullish, there’s a potential scenario indicating a bearish reaction from the pivot level towards the 1st support.
The pivot at 0.8899 is marked by an overlap resistance, suggesting a significant level where selling pressure might intensify, potentially leading to a bearish pullback. Conversely, the 1st support at 0.8851 is identified as pullback support, indicating a level where buying interest could emerge, potentially halting the downward movement.
On the resistance side, the 1st resistance at 0.8935 is supported by the 127.20% Fibonacci Extension, forming a barrier to upward movement, potentially reinforcing the bearish sentiment.
USD/JPY:
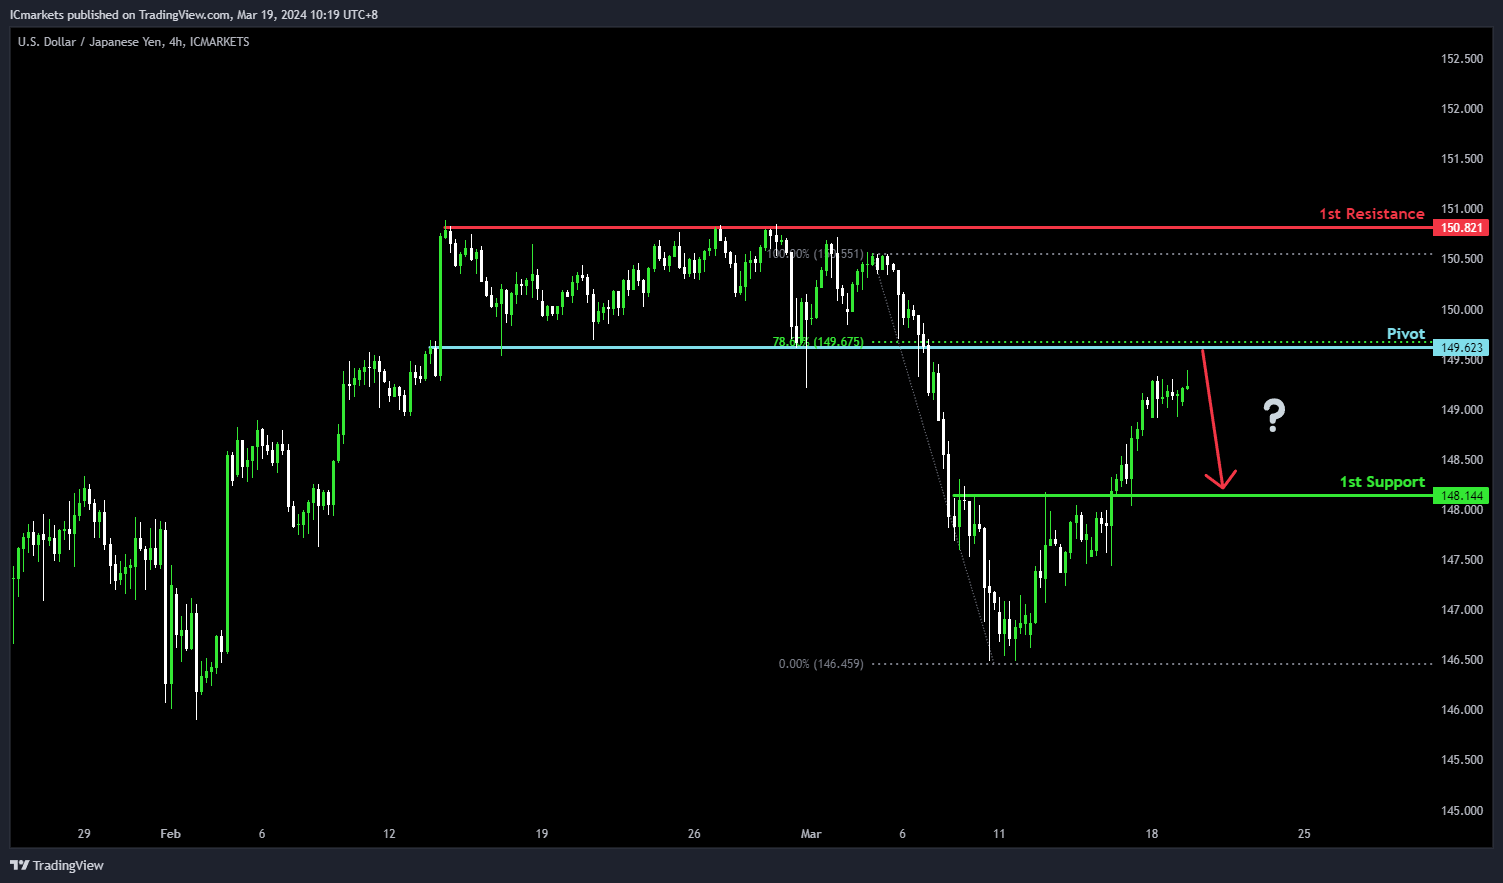
For USD/JPY, in line with the overall bearish momentum of the chart, there’s a potential scenario indicating a bearish reaction from the pivot level, possibly leading to a drop towards the 1st support.
The pivot at 149.62 is significant, identified as pullback resistance, with reinforcement from the 78.60% Fibonacci Retracement. This suggests a pivotal level where selling pressure might increase. Additionally, the 1st support at 148.14 serves as overlap support, indicating historical significance.
On the resistance side, the 1st resistance at 150.82 is noted as multi-swing high resistance, forming another barrier to upward movement, potentially reinforcing the bearish sentiment.
USD/CAD:
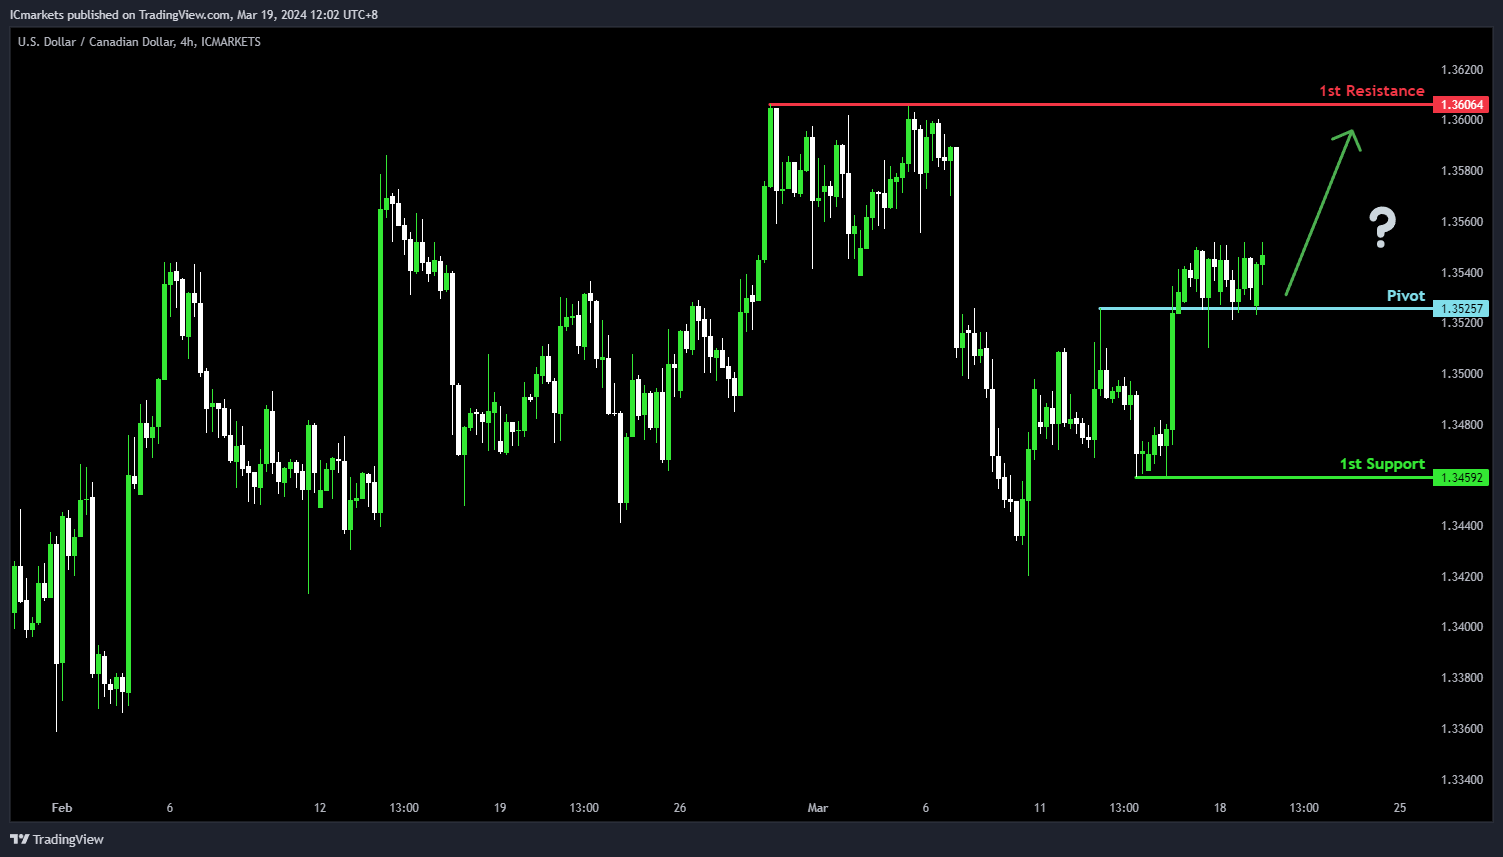
The USD/CAD chart currently demonstrates an overall bullish momentum. In this context, there is a potential scenario for price to fall towards the pivot and make a bullish bounce to rise towards the 1st resistance.
The pivot level at 1.3525 is identified as an overlap support where price could potentially make a bullish bounce and climb higher. The 1st resistance level at 1.3606 is noted as a pullback resistance, further highlighting its importance as a potential resistance zone.
To the downside, the 1st support level at 1.3459 is marked as a pullback support, reinforcing its significance as a key support level.
AUD/USD:
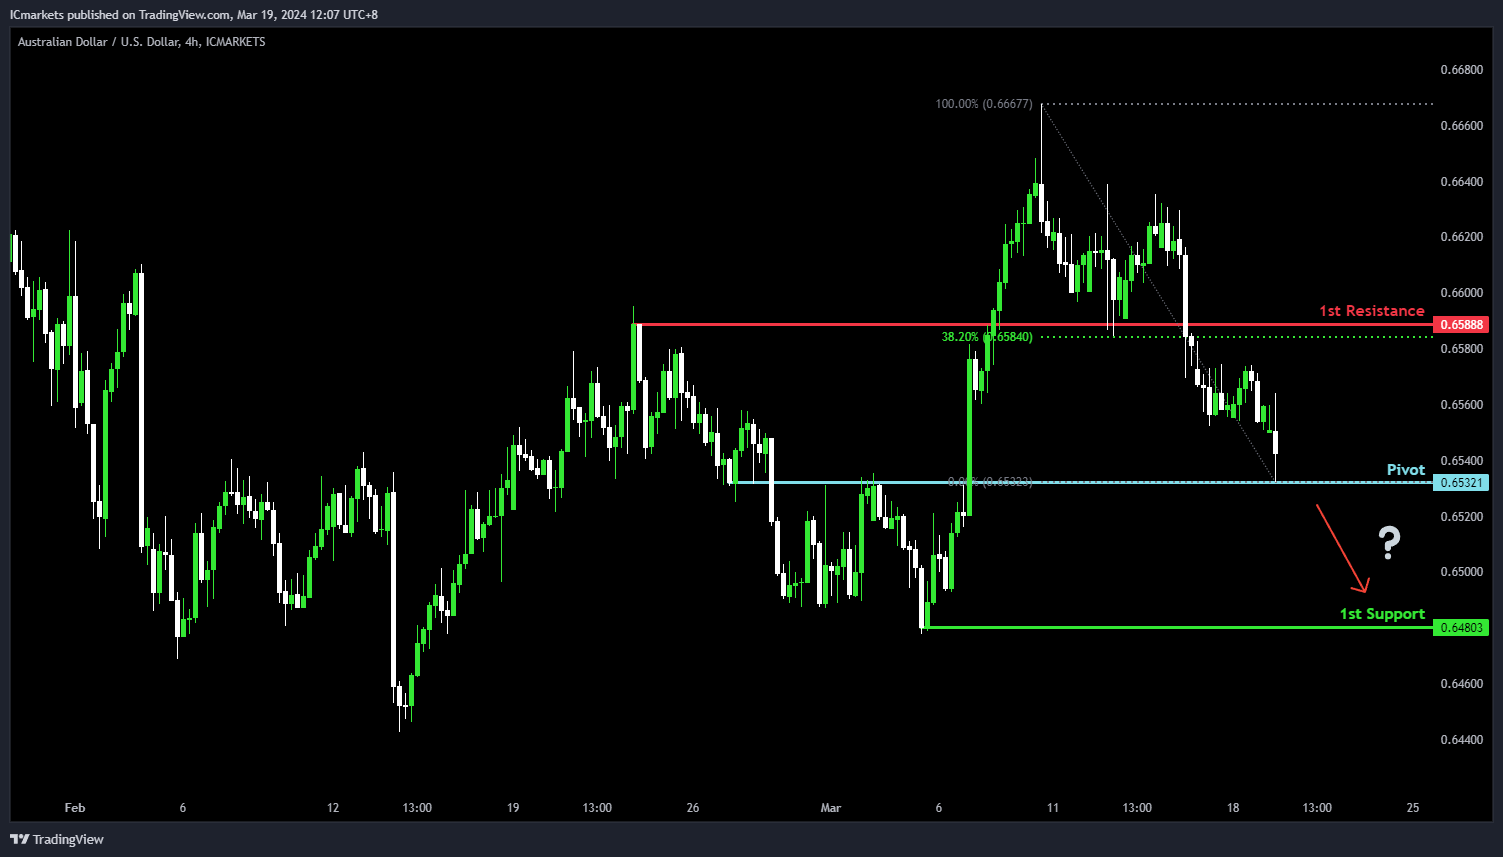
The AUD/USD chart currently demonstrates an overall bearish momentum. In this context,there is a potential scenario for price to break below the pivot and potentially drop towards the 1st support.
The pivot level at 0.6532 is identified as an overlap support where price could potentially break under to drop lower. The 1st support level at 0.6480 is marked as a pullback support, reinforcing its significance as a key support level.
On the resistance side, the 1st resistance level at 0.6588 is noted as an overlap resistance that aligns close to the 38.20% Fibonacci Retracement level, potentially limiting any further upward movement.
NZD/USD
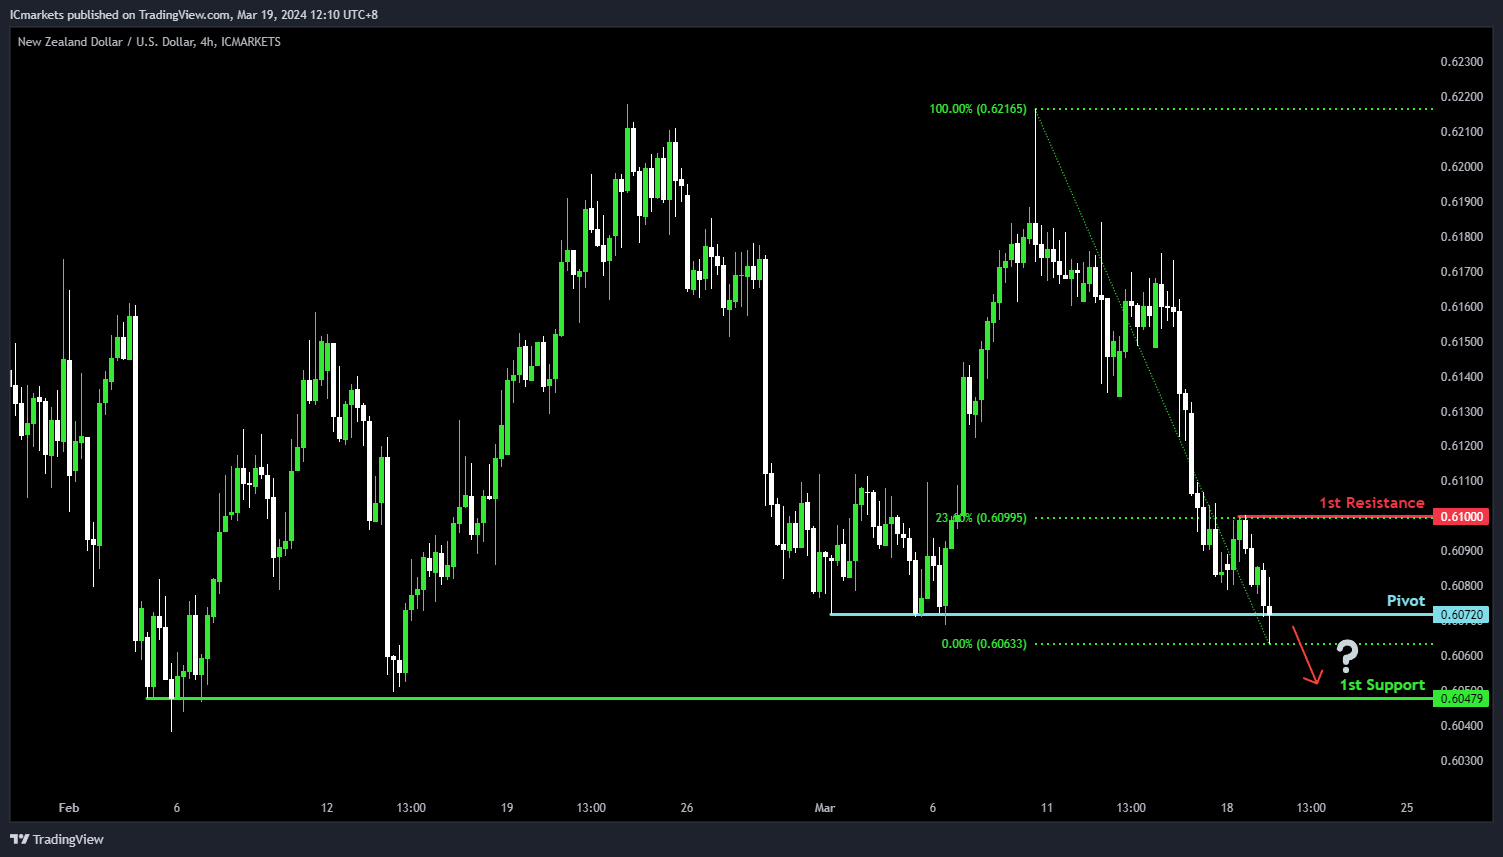
The NZD/USD chart currently demonstrates an overall bearish momentum. In this context, there is a potential scenario for price to break below the pivot and potentially drop towards the 1st support.
The pivot level at 0.6072 is identified as a pullback support where price could potentially break under to drop lower. The 1st support level at 0.6047 is marked as a multi-swing-low support, reinforcing its significance as a key support level.
On the resistance side, the 1st resistance level at 0.6100 is noted as a pullback resistance that aligns with the 23.60% Fibonacci Retracement level, potentially limiting any further upward movement.
DJ30:
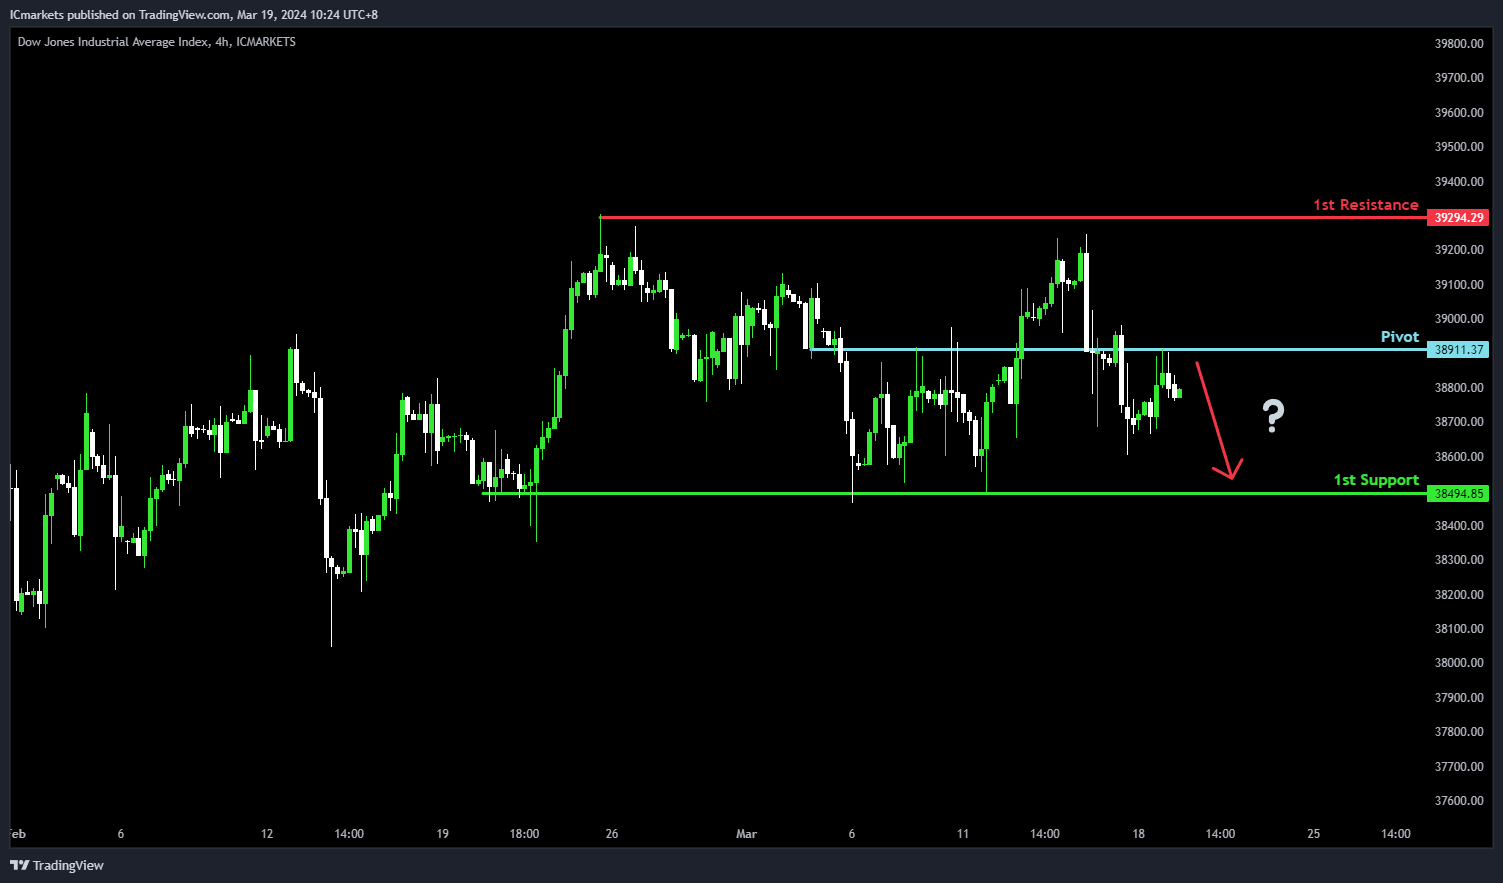
For DJ30, despite the bullish overall momentum, the potential direction is bearish. There’s a chance for a bearish continuation towards the 1st support.
The pivot at 38911.37 acts as an overlap resistance, suggesting possible increased selling pressure. The 1st support at 38494.85, a multi-swing low support, signifies historical buying interest.
Conversely, the 1st resistance at 39294.29 forms a swing-high resistance, potentially impeding further bullish movement.
GER40:
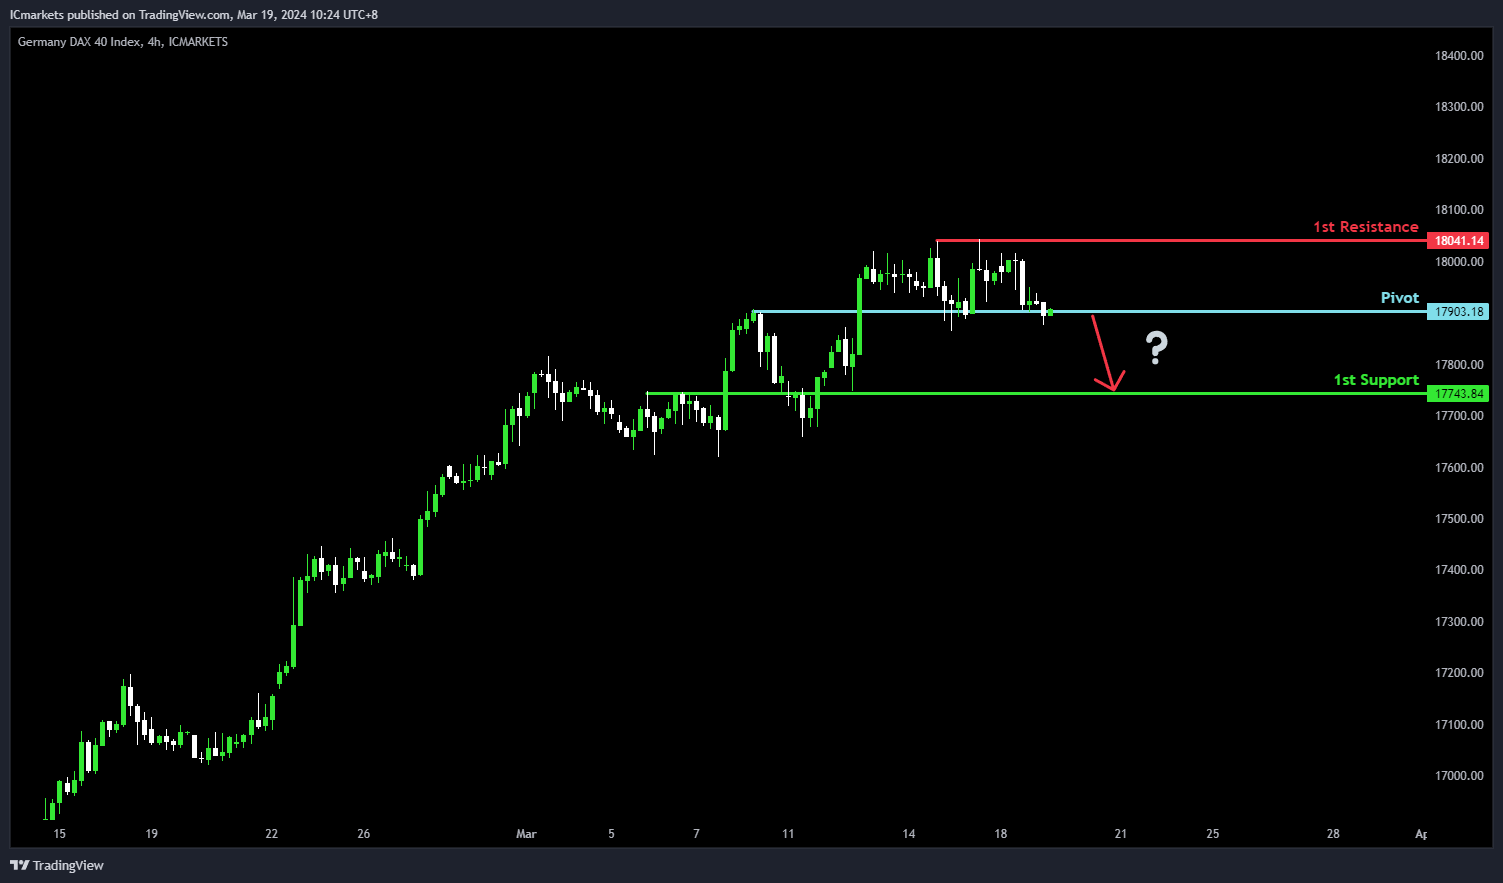
For GER40, despite the bullish overall momentum, the potential direction is bearish. There’s a possibility of a bearish reaction off the pivot level, leading to a drop towards the 1st support.
The pivot at 17903.18 serves as an overlap resistance, indicating a potential area of selling interest. The 1st support at 17743.84 acts as an overlap support, historically significant for buying activity.
Conversely, the 1st resistance at 18041.14 represents a multi-swing high resistance, potentially hindering further bullish advancement.
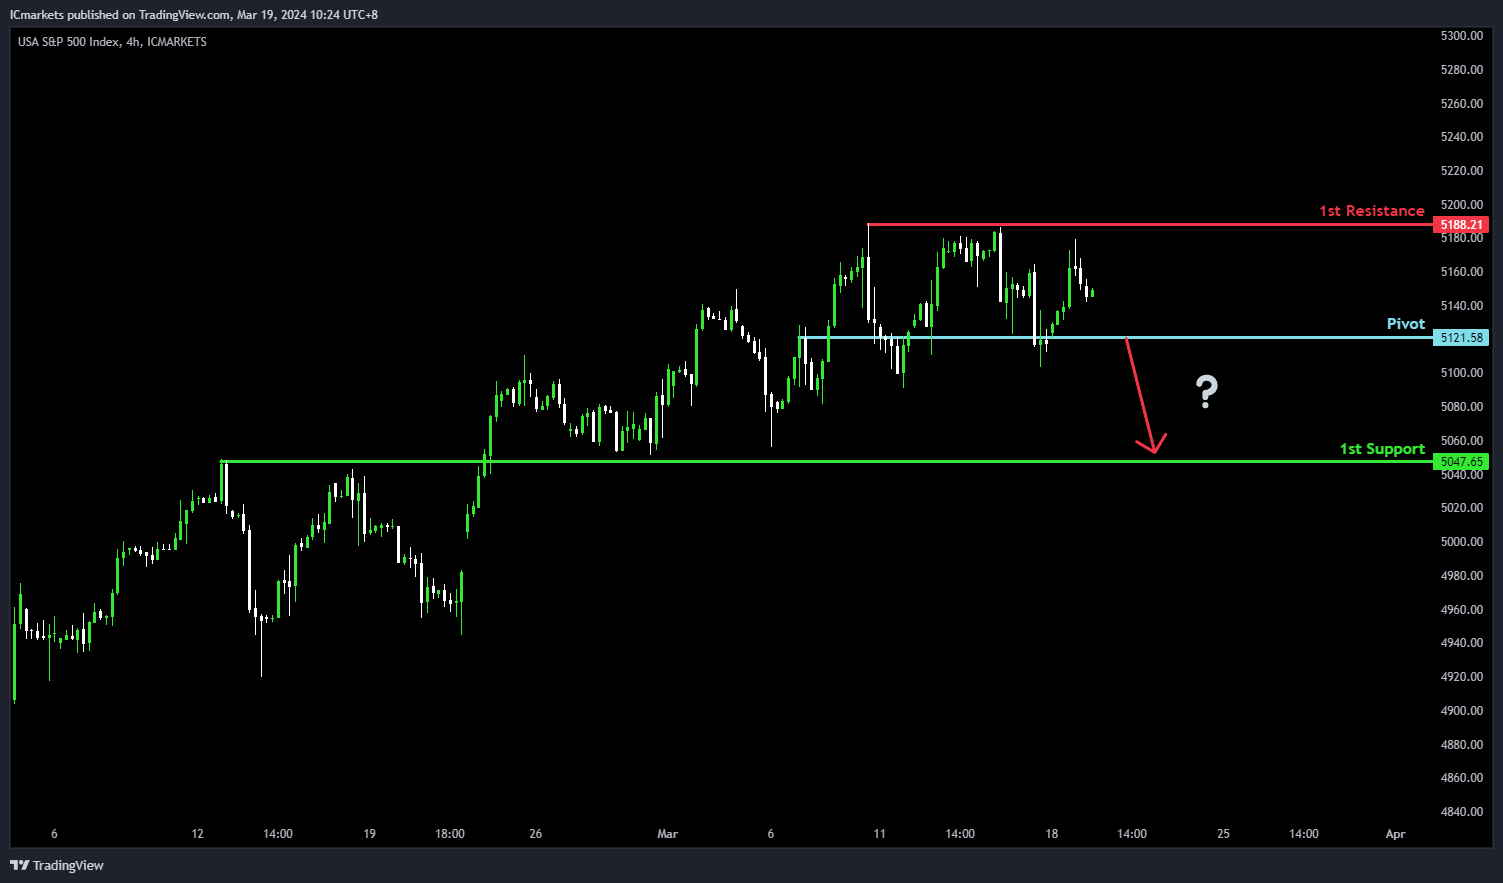
US500:
For US500, despite the bullish overall momentum, there’s a potential bearish scenario.
The price could react bearishly off the pivot at 5121.58, representing an overlap resistance. This level may attract selling interest, potentially leading to a drop towards the 1st support at 5047.65, which serves as an overlap support, historically significant for buyers.
Conversely, the 1st resistance at 5188.21 acts as a multi-swing high resistance, potentially limiting further bullish movement.
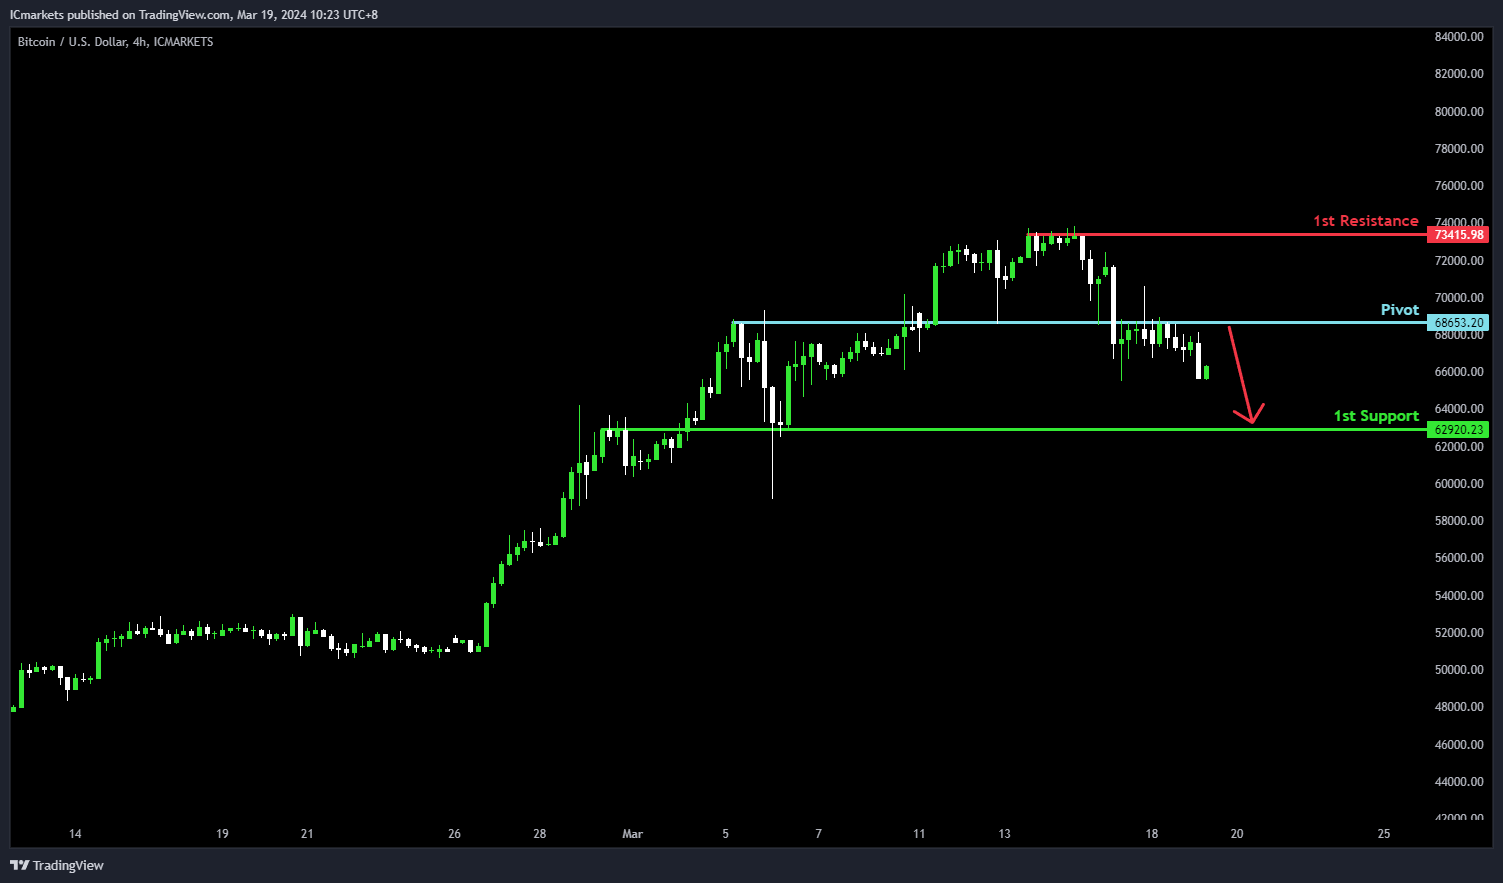
BTC/USD:
The BTC/USD chart currently demonstrates an overall bearish momentum. In this context, there is a potential scenario for price to rise towards the pivot before reversing to drop towards the 1st support.
The pivot level at 68,653.20 is identified as an overlap resistance where price could potentially make a bearish reversal. The 1st support level at 62,920.23 is marked as an overlap support, reinforcing its significance as a key support level.
To the upside, The 1st resistance level at 73,415.98 is noted as a pullback resistance at the all-time high, further reinforcing its significance as a potential barrier to further bullish movement.
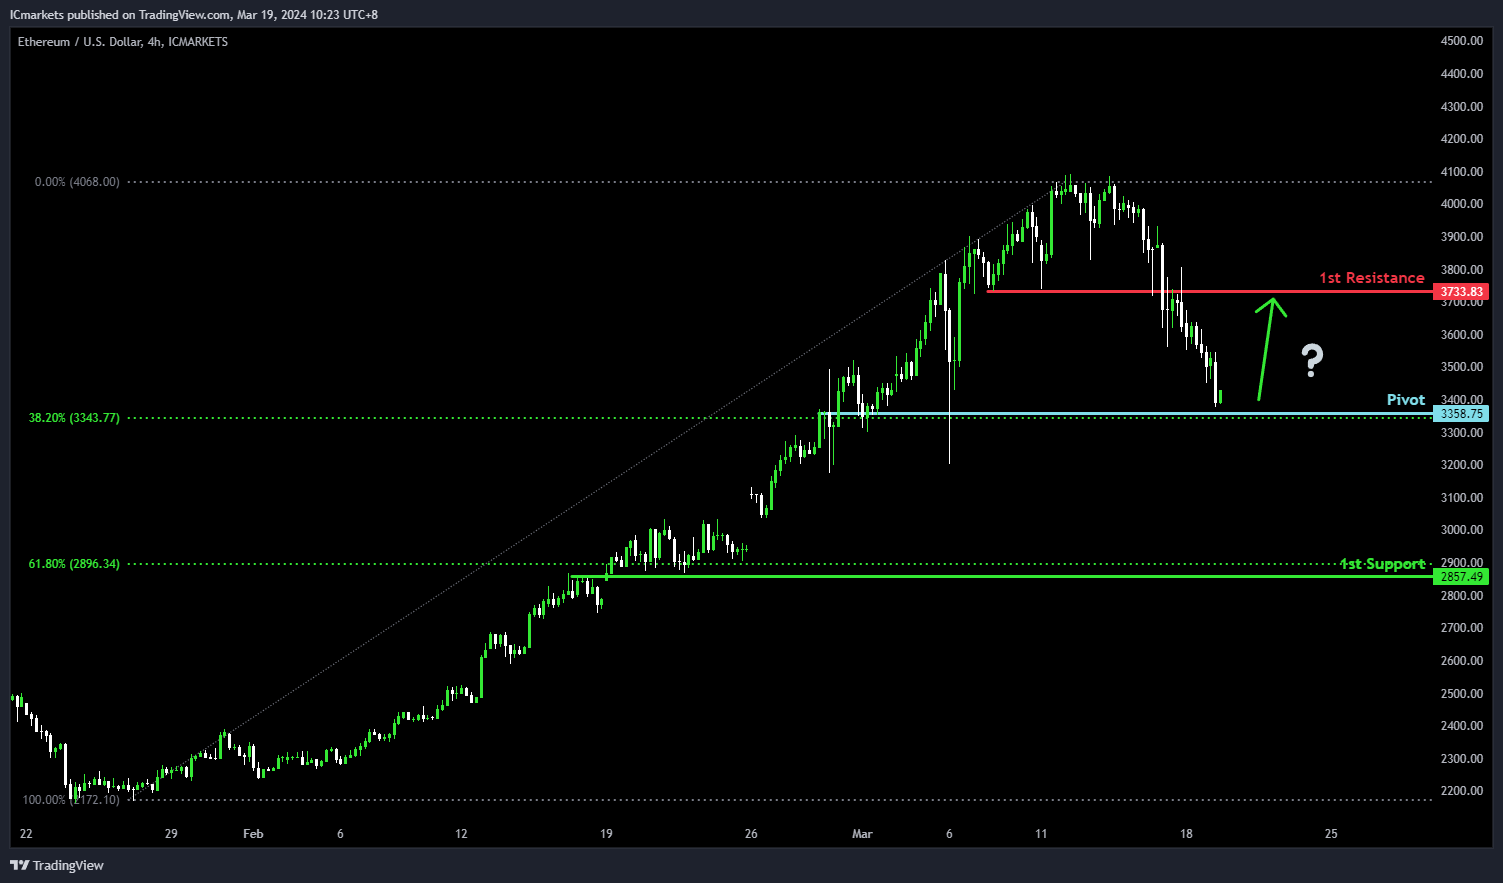
ETH/USD:
The ETH/USD chart currently demonstrates an overall bearish momentum. However, there is a potential scenario for price to bounce off the pivot and rise towards the 1st resistance.
The pivot level at 3,358.75 is identified as an overlap support that aligns with the 38.20% Fibonacci Retracement level where price could potentially make a bullish reversal. The 1st resistance level at 3,733.83 is noted as an overlap resistance, further reinforcing its significance as a potential barrier to further bullish movement.
To the downside, the 1st support level at 2,857.49 is marked as an overlap support that aligns close to the 61.80% Fibonacci Retracement level, reinforcing its significance as a key support level.
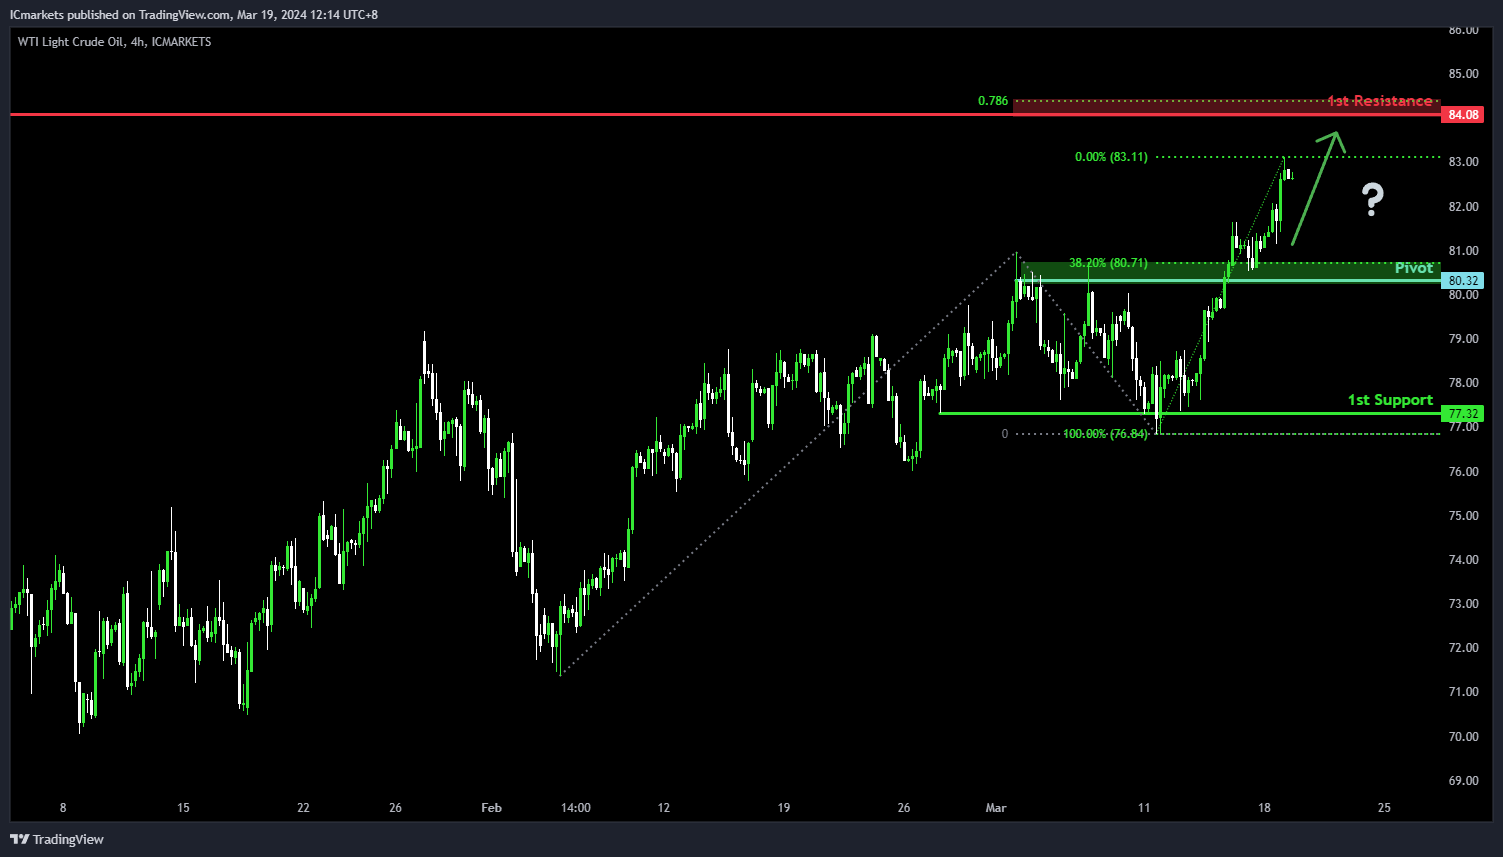
WTI/USD:
The WTI (West Texas Intermediate) chart currently demonstrates an overall bullish momentum. Howere, there is a potential scenario for price to fall towards the pivot before making a bullish bounce and rise towards the 1st resistance.
The pivot level at 80.32 is identified as an overlap support that aligns close to the 38.2% Fibonacci Retracement level where price could potentially make a bullish bounce. The 1st resistance level at 84.08 is noted as an overlap resistance that aligns close to the 78.60% Fibonacci Projection level, further reinforcing its significance as a potential barrier to further bullish movement.
To the downside, the 1st support level at 77.32 is marked as a pullback support, reinforcing its significance as a key support level.
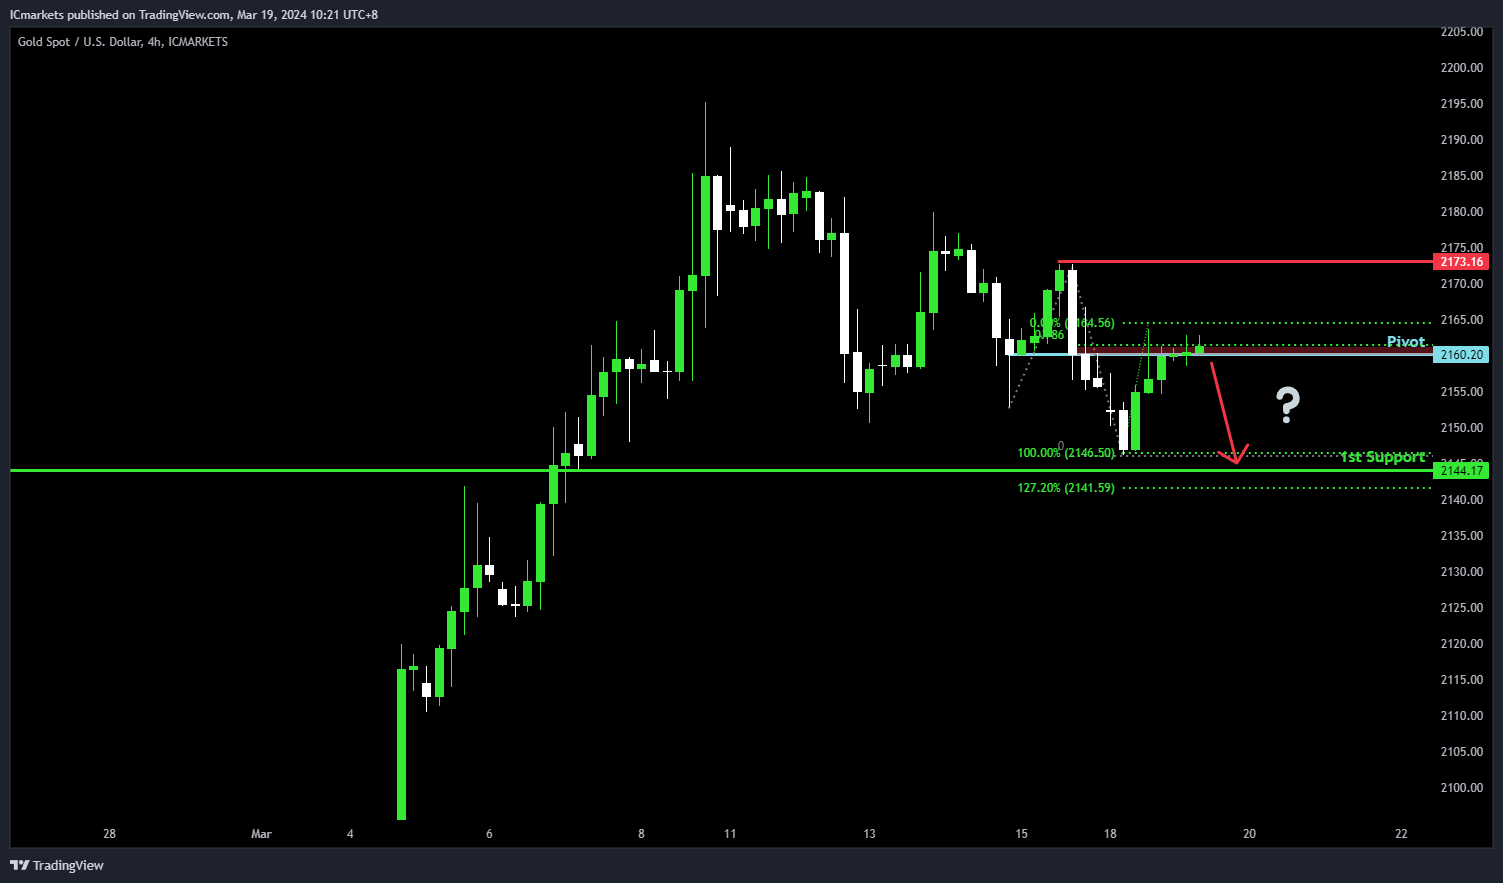
XAU/USD (GOLD):
For XAU/USD, despite the overall bullish momentum of the chart, there’s a potential scenario suggesting a bearish break off the pivot level, potentially leading to a drop towards the 1st support.
The pivot at 2160.20 is a significant level, identified as overlap support, with reinforcement from the 78.60% Fibonacci Projection. This indicates a crucial area where buyers have historically intervened. Additionally, the 1st support at 2144.17 acts as another level of overlap support, further strengthening its significance.
On the resistance side, the 1st resistance at 2173.16 is noted as swing-high resistance, forming a barrier to upward movement, potentially reinforcing the bearish sentiment.
The accuracy, completeness and timeliness of the information contained on this site cannot be guaranteed. IC Markets does not warranty, guarantee or make any representations, or assume any liability regarding financial results based on the use of the information in the site.
News, views, opinions, recommendations and other information obtained from sources outside of www.icmarkets.com, used in this site are believed to be reliable, but we cannot guarantee their accuracy or completeness. All such information is subject to change at any time without notice. IC Markets assumes no responsibility for the content of any linked site.
The fact that such links may exist does not indicate approval or endorsement of any material contained on any linked site. IC Markets is not liable for any harm caused by the transmission, through accessing the services or information on this site, of a computer virus, or other computer code or programming device that might be used to access, delete, damage, disable, disrupt or otherwise impede in any manner, the operation of the site or of any user’s software, hardware, data or property.


