
A note on lower timeframe confirming price action…
Waiting for lower timeframe confirmation is our main tool to confirm strength within higher timeframe zones, and has really been the key to our trading success. It takes a little time to understand the subtle nuances, however, as each trade is never the same, but once you master the rhythm so to speak, you will be saved from countless unnecessary losing trades. The following is a list of what we look for:
- A break/retest of supply or demand dependent on which way you’re trading.
- A trendline break/retest.
- Buying/selling tails/wicks – essentially we look for a cluster of very obvious spikes off of lower timeframe support and resistance levels within the higher timeframe zone.
- Candlestick patterns. We tend to only stick with pin bars and engulfing bars as these have proven to be the most effective.
We search for lower timeframe confirmation between the M15 the H1 timeframes, since most of our higher-timeframe areas begin with the H4. Stops are usually placed 5-10 pips beyond confirming structures.
EUR/USD:
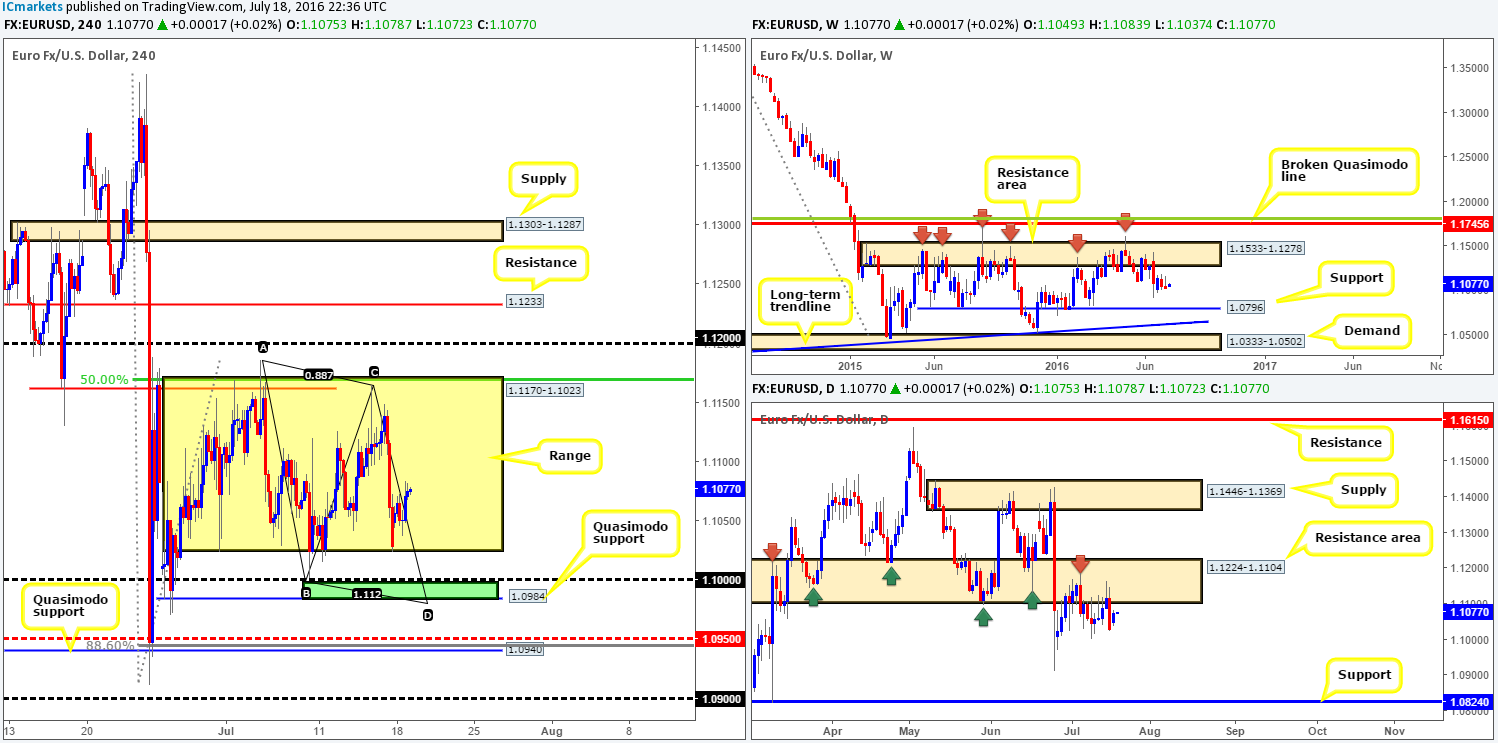
Following Sunday’s open, the EUR along with the rest of the market took on a rather sober tone. In the absence of any high-impacting data, as well as Monday’s sessions typically being slow, the pair traded within a fifty-pip range (1.1083/1.1037). What we did see from yesterday’s movement, however, was the buyers bring price back into the current H4 range fixed at 1.1170-1.1023. This begs the question, is it likely that the single currency will fill this H4 range to the upper boundary? Of course it is possible, but there’s also a chance that yesterday’s action was simply a bout of short covering from Friday’s sell off.
To our way of seeing things, lower prices still remain the more likely route. Our reasoning lies within the higher timeframe structure. The weekly chart shows space to move lower down to support drawn from 1.0796, while down on the daily chart the major is being held lower by a daily resistance area at 1.1224-1.1104. Apart from the referendum low seen at 1.0911, there’s little support stopping price from reaching the daily support chalked in at 1.0824 this week.
Therefore, we feel this H4 range will eventually be breached. Prior to this, there are two strong-looking barriers of support on the H4 where price is likely to bounce from:
- The minor H4 Quasimodo support line seen at 1.0984. This line also coincides with a H4 AB=CD completion point at 1.0979, and sits just beneath the key figure 1.10 (green zone). Collectively, this zone is high-probability area for a bounce to be seen.·
- The larger H4 Quasimodo support at 1.0940. Not only did the H4 candles bounce from this line during the ‘Brexit’ fallout (indicating strong support), it also fuses with a H4 88.6% Fib retracement line at 1.0945 and a H4 mid-way support at 1.0950.
Our suggestions: Watch both of the aforementioned H4 support barriers this week for potential long positions. We are confident a bounce will be seen from these areas, but would still advise traders to trade cautiously in light of what’s been noted on the higher timeframes.
Levels to watch/live orders:
- Buys: 1.0984/1.10 [Tentative – confirmation required] (Stop loss: dependent on where one confirms this area). 1.0940/1.0950 [Tentative – confirmation required] (Stop loss: dependent on where one confirms this area).
- Sells: Flat (Stop loss: N/A).
GBP/USD:
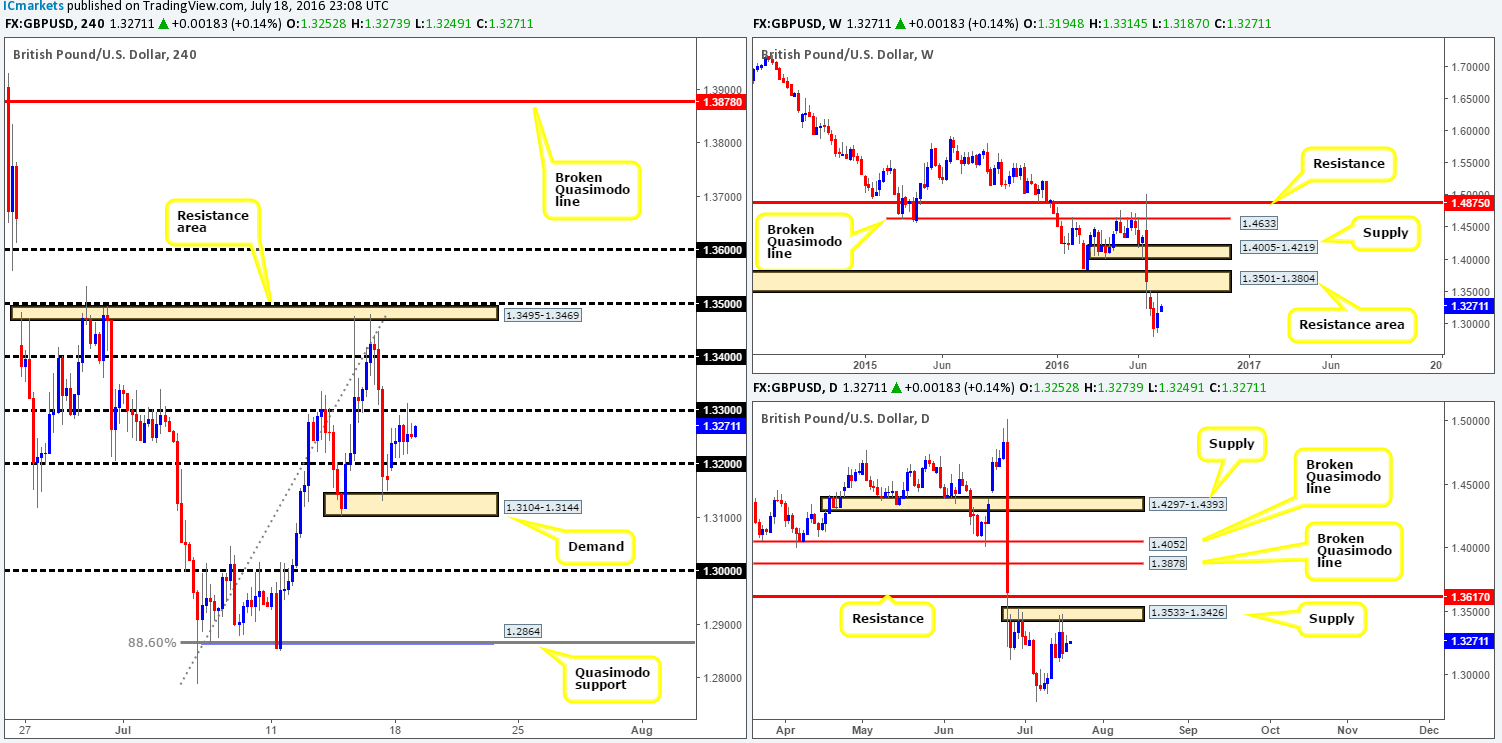
In recent sessions, cable employed a more subtle approach in comparison to the previous week’s action. The 1.32 handle was broken early in Asia, followed by a slow grind up to the 1.33 line, which as you can see offered resistance into the day’s close.
Despite yesterday’s advance, our team still favors further downside. Similar to the EUR, our reasoning lies within the higher timeframe structure. Over on the weekly chart, the pair is seen trading relatively close to a resistance area penciled in at 1.3501-1.3804. By and large, we see little support to the left of current price until the market reaches the 1.20 region (we had to go all the way back to 1986 to find this).
In line with weekly expectations of further downside, daily price struck supply at 1.3533-1.3426 (glued to the underside of the aforementioned weekly resistance area), and is currently holding this unit lower. In the event that this zone continues to suppress buying, a move down to the 1.30 area is very likely we feel.
Our suggestions: Ultimately, what we’re looking for is a break below both 1.32 and the H4 demand base seen at 1.3104-1.3144. For our team to be given the green light to short below here, nevertheless, a retest of the broken demand would need to be seen followed by a lower timeframe sell signal (see the top of this report for a list of lower timeframe entry techniques). The initial take-profit target would be the 1.30 mark, which is where we’d also look to reduce risk to breakeven.
Levels to watch/live orders:
- Buys: Flat (Stop loss: N/A).
- Sells: Watch for price to consume the H4 demand at 1.3104-1.3144 and look to trade any retest seen thereafter (lower timeframe confirmation required).
AUD/USD:
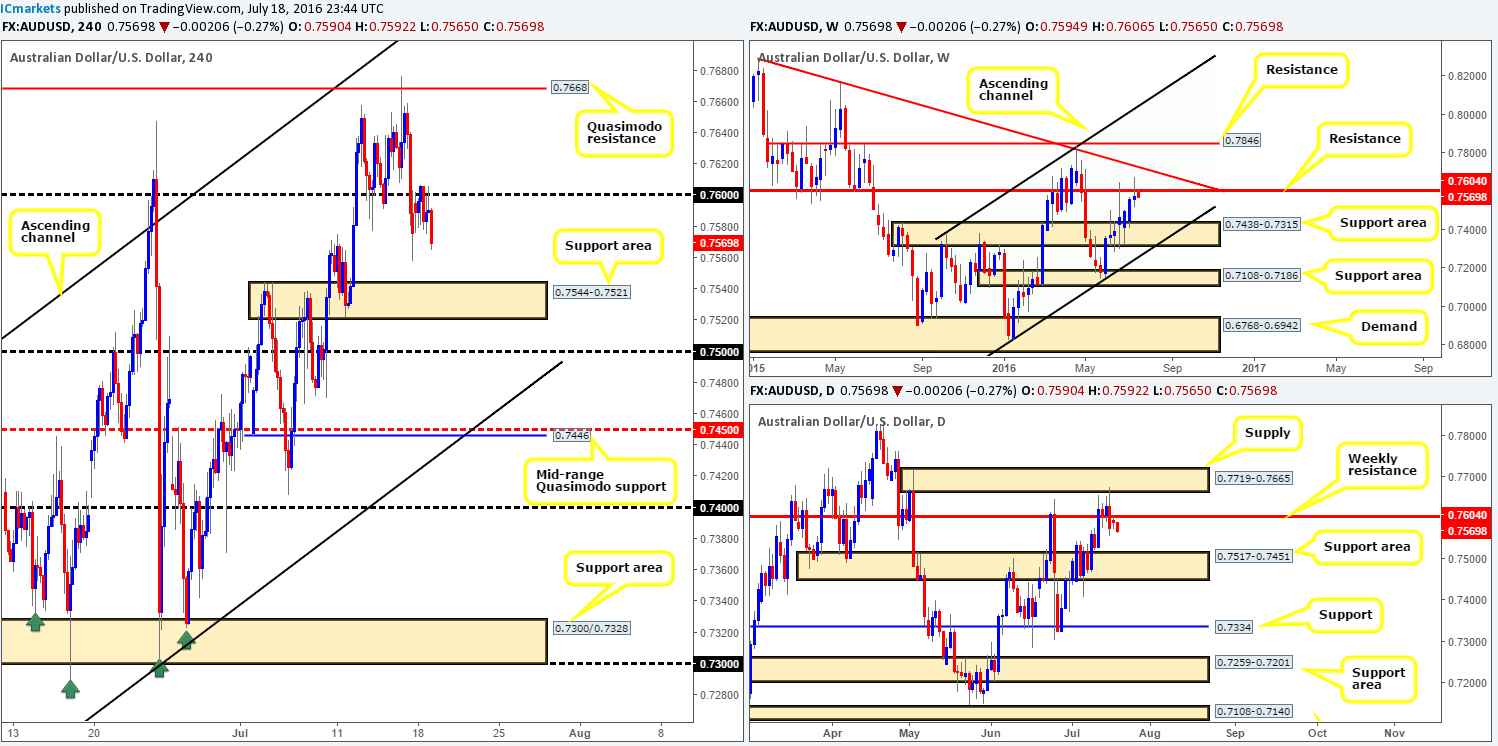
During the course of yesterday’s sessions, we saw the commodity-linked currency shake hands with the 0.76 handle and enter into a rather lethargic thirty-pip range for the remainder of the day. This lackluster performance was likely due to there being very little market-moving data seen on the docket. From a technical standpoint, however, this number is VERY significant as it also represents a key weekly resistance level penciled in at 0.7604. In addition to this, both the weekly and daily charts show room to move lower. From the weekly the next the next downside target can be seen at a weekly support area at 0.7438-0.7315, while on the daily, the next area of interest can be seen at a daily support zone coming in at 0.7517-0.7451.
For those who read Monday’s report, we mentioned to watch for a lower timeframe sell entry off the back of the 0.76 handle, targeting the H4 support area at 0.7544-0.7521 as a first take-profit target. Well done to any of our readers who managed to pin down an entry here, since it is likely the first target will hit later on today.
Our suggestions: For those who are short this market from 0.76, a bounce is expected from the H4 support area. Nevertheless, there is a good chance of further downside beyond this zone to 0.75, or even the H4 mid-range Quasimodo support at 0.7446, according to the higher timeframes. Therefore, our team’s ultimate target would be the 0.7450 region as this line conveniently sits just above the weekly support area at 0.7438-0.7315, and coincides nicely with a H4 channel support extended from the low 0.7148.
Levels to watch/live orders:
- Buys: Flat (Stop loss: N/A).
- Sells: Flat (Stop loss: N/A).
USD/JPY:
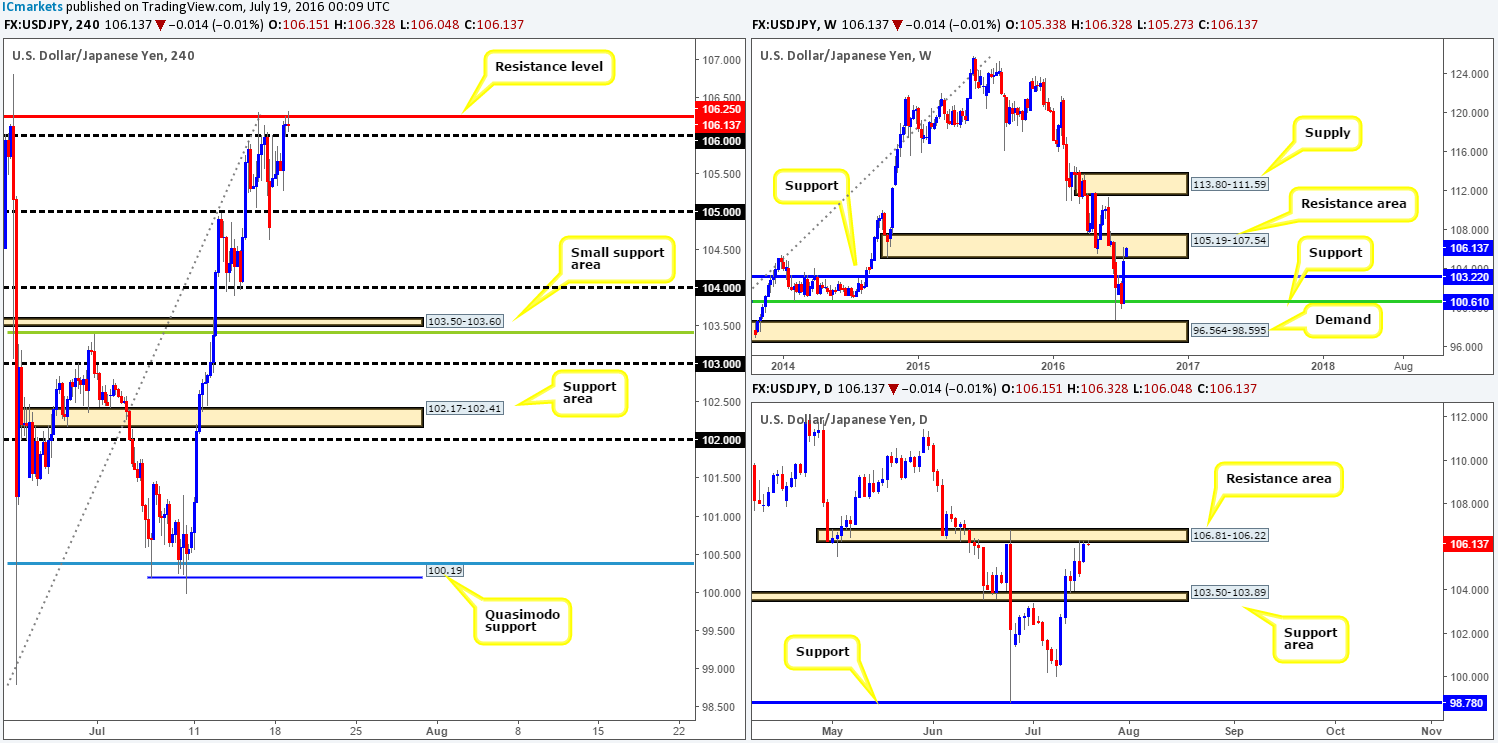
From the top this morning, we can see that weekly buyers are bidding this market higher into a weekly resistance area seen at 105.19-107.54. On the grounds that this zone holds firm this week, the next downside target area comes in at 103.22 – a long-term weekly support level.
Thanks to yesterday’s advance, the safe-haven pair is also now seen flirting with the underside of a daily resistance area registered at 106.81-106.22. To the downside, the next area to keep a tab on is a daily support zone carved from 103.50-103.89, which sits thirty or so pips above the aforementioned weekly support level.
Stepping over to the H4 chart, however, price recently took out the 106 handle and slammed into a H4 resistance level at 106.25. As can be seen from the chart, the pair is selling off from this line. This – coupled with both the weekly and daily resistance areas bolstering this level, could potentially force this pair down to the 105 handle and quite possibly beyond according to the higher timeframe targets (see above).
Our suggestions: Seeing as it is impossible to know whether the 106 barrier will provide support, we feel the best path to take today for those who are looking to short, is to wait for a close below this number. This, alongside a retest would be sufficient (considering the higher timeframe structures) enough for our team to sell down to at least the 105 region.
Levels to watch/live orders:
- Buys: Flat (Stop loss: N/A).
- Sells: Watch for price to consume the 106 handle and look to trade any retest seen thereafter.
USD/CAD:
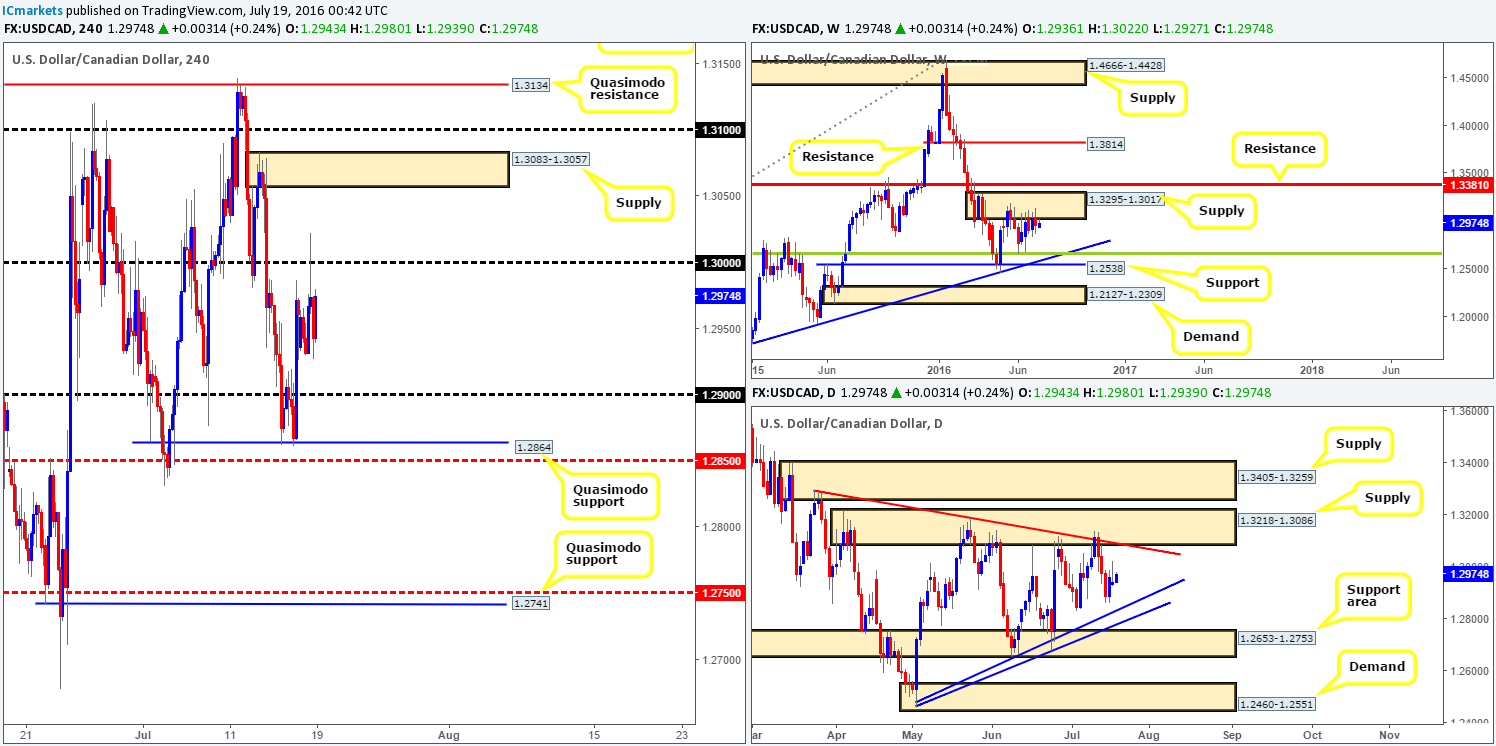
Weakening oil prices continue to bolster the USD/CAD pair, which allowed price to test the key figure 1.30 going into yesterday’s American session. A truckload of stops were likely triggered by this move above this number, thus a push up to the H4 supply zone seen at 1.3083-1.3057 may be on the cards today.
With the above points in mind, how do things stand on the higher timeframes? Well, over on the weekly chart, the pair has been seen clinging to the underside of a weekly supply base drawn from 1.3295-1.3017 for the past five weeks. Assuming that the bears do eventually stamp their authority on this zone, the next downside target can be seen at a weekly trendline support extended from the high 1.1278, which coincides with a weekly 38.2% Fib support at 1.2661 (taken from the low 0.9406). Sliding down into the pits of the daily chart, the loonie has been seen trading between a relatively long-term daily support area at 1.2653-1.2753 (encapsulates the above said weekly Fib level) and a daily supply zone logged in at 1.3218-1.3086 (housed within the aforementioned weekly supply area) since early May. What’s more, there are two merging daily trendlines seen (1.2460/1.3295) forming somewhat of a bearish pennant, compressing price as we write. Conventional wisdom states that pennants are continuation patterns, which, in this case, seems a logical outcome considering the position of price on the weekly timeframe (see above).
In view of these points, here are the levels we’re looking at for potential shorts today/this week:
- H4 supply at 1.3083-1.3057. Although this area looks fresh and is located within the aforementioned weekly supply base, there’s still a good chance it will be faked due to the daily supply area hovering only a few pips above it at 1.3218-1.3086.
- The 1.31 handle. This is an interesting level since it’s located within both the above said daily supply and weekly supply zones.
- Finally, there are also two H4 Quasimodo resistances lodged within the above noted higher timeframe supplies. The lower of the two at 1.3134 already held price beautifully back on the 11th July. The one above, the more extreme at 1.3173, has a very good chance of seeing a reaction should price stretch this high this week, since it remains fresh!
Our suggestions: Keep a tab on the above said areas this week. Since it is almost impossible to know which area will bounce, if any, we recommend being patient and waiting for lower timeframe price action (see the top of this report). However, should price climb to the most extreme H4 Quasimodo resistance line at 1.3173, we would enter with a market order since we then have the option of placing our stop above the current daily supply zone!
Levels to watch/live orders:
- Buys: Flat (Stop loss: N/A).
- Sells: 1.3083-1.3057 [Tentative – confirmation required] (Stop loss: dependent on where one confirms this area). 1.31 region [Tentative – confirmation required] (Stop loss: dependent on where one confirms this area). 1.3134 region [Tentative – confirmation required] (Stop loss: dependent on where one confirms this area). 1.3173 [Entering at market here is viable but is still dependent on the time of day] (Stop loss: 1.3220).
USD/CHF:
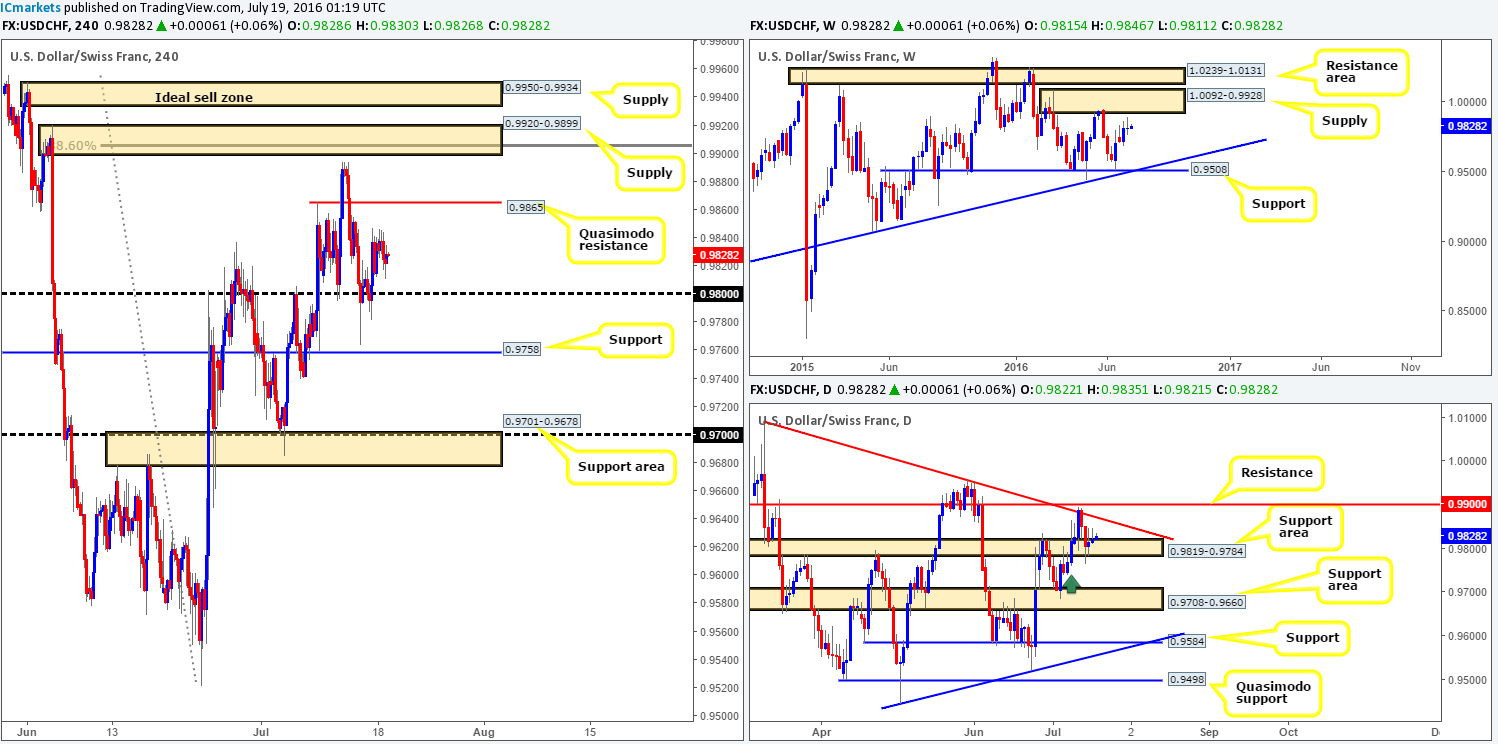
Kicking off with a look at the weekly chart this morning, the Swissy is seen loitering ahead of a weekly supply zone coming in at 1.0092-0.9928. The story on the daily chart, nevertheless, shows that whilst price found bids around the daily support area at 0.9819-0.9784, a small daily demand zone marked with a green arrow at 0.9739-0.9765 was also tagged in last week’s action. Beyond these two zones, there’s little stopping price from diving down to greet the daily support area at 0.9708-0.9660. To the upside from here, however, there’s limited potential seen as far as structure is concerned since a daily trendline resistance is seen lurking just above (1.0092).
Little noteworthy movement was seen on the H4 chart yesterday given the absence of high-impacting data. A small 35-pip range was chalked up amidst a H4 Quasimodo resistance line at 0.9865 and the 0.98 handle. Consequent to this rather lethargic performance, much of the following will echo similar thoughts put forward in Monday’s report…
The levels we currently have our eye on are as follows:
- The H4 Quasimodo resistance level at 0.9865 due to it fusing beautifully with a daily trendline resistance taken from the high 1.0092.
- Two H4 supply zones seen at 0.9920-0.9899 and 0.9950-0.9934. The lower of the two boasts a deep H4 88.6% Fib resistance at 0.9906, as well as the 0.99 handle which is also a daily resistance line! The upper H4 supply, the better zone of the two in our opinion, does not necessarily have any merging structures, but it is glued to the underside of the above said weekly supply zone!
Our suggestions: Watch the above said zones for potential sell trades this week. Each area, as we’ve shown, has different qualities. If you’re unsure of a level, it is recommended to wait for lower timeframe confirmation to form before risking capital (see the top of this report). Personally, out of the three zones, the only area that we’d risk trading with a market order is at the 0.9950-0.9934 H4 supply zone due to its position on the weekly chart.
Levels to watch/live orders:
- Buys: Flat (Stop loss: N/A).
- Sells: 0.9865 region [Tentative – confirmation required] (Stop loss: dependent on where one confirms this area). 0.9920-0.9899 [Tentative – confirmation required] (Stop loss: dependent on where one confirms this area). 0.9933 [Possible entry at market here depending on the time of day] (Stop loss: 0.9955).
DOW 30:
In light of the rather colorless trading sessions yesterday, our outlook for the DOW remains the same as in Monday’s report…
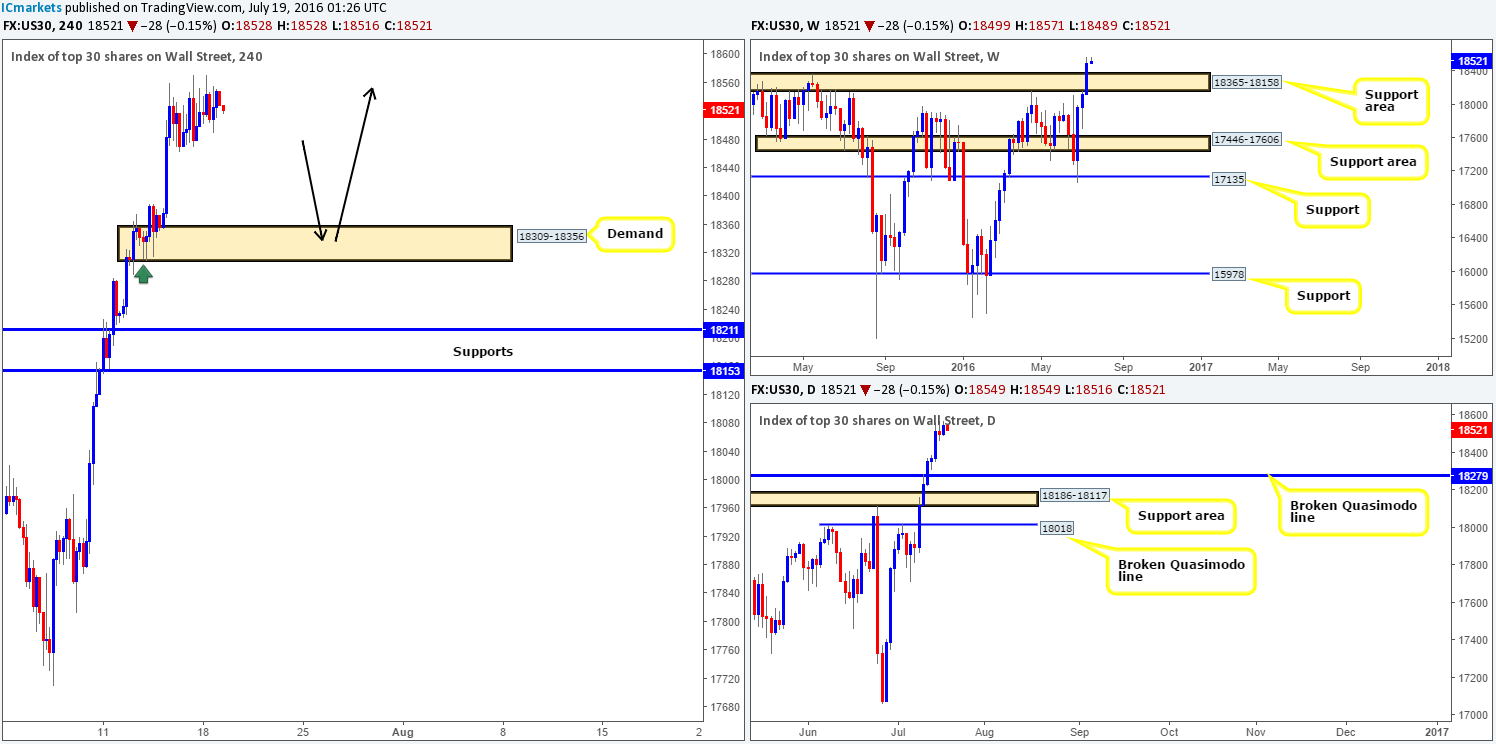
From a weekly viewpoint, we can see that weekly buyers printed a third consecutive bull candle last week, consequently engulfing the weekly resistance area at 18365-18158, and reaching an all-time high of 18571. Technically, further upside is likely on the cards over the coming weeks, with the possibility of seeing a retest at 18365-18158 as support. A very similar story is being seen on the daily chart. The daily Quasimodo resistance line at 18279 was engulfed going into Tuesday’s session last week, which could possibly be retested later on this week as support. Because this barrier is lodged within the above said weekly support area, it is certainly worth making a note of!
Our approach to this market this week is simple. There’s very little to suggest selling this market at this time. With that said, the team will look to ‘buy the dips’ until price action suggests otherwise. Our first port of call will be the H4 demand zone coming in at 18309-18356 (see black arrows). This base is housed nicely within the recently broken weekly resistance area at 18365-18158 (now an acting support area), and sits just above a broken daily Quasimodo level mentioned above at 18279. In addition to this, the tails seen marked on the H4 chart with a green arrow represent buying interest around this level, thus there is a strong possibility (given the higher timeframe picture as well) that there are unfilled orders still residing here.
Our suggestions: Watch for a lower timeframe buy entry from the H4 demand area mentioned above at 18309-18356. The reason for requiring extra confirmation here simply comes down to the possibility that price may fake beyond the aforementioned H4 demand into the broken daily Quasimodo line. For those who struggle to find reliable setups on the lower timeframes, please see the top of this report for a list of techniques we regularly use.
Levels to watch/live orders:
- Buys: 18309-18356 [Tentative – confirmation required] (Stop loss: dependent on where one confirms this area).
- Sells: Flat (Stop loss: N/A).
GOLD:
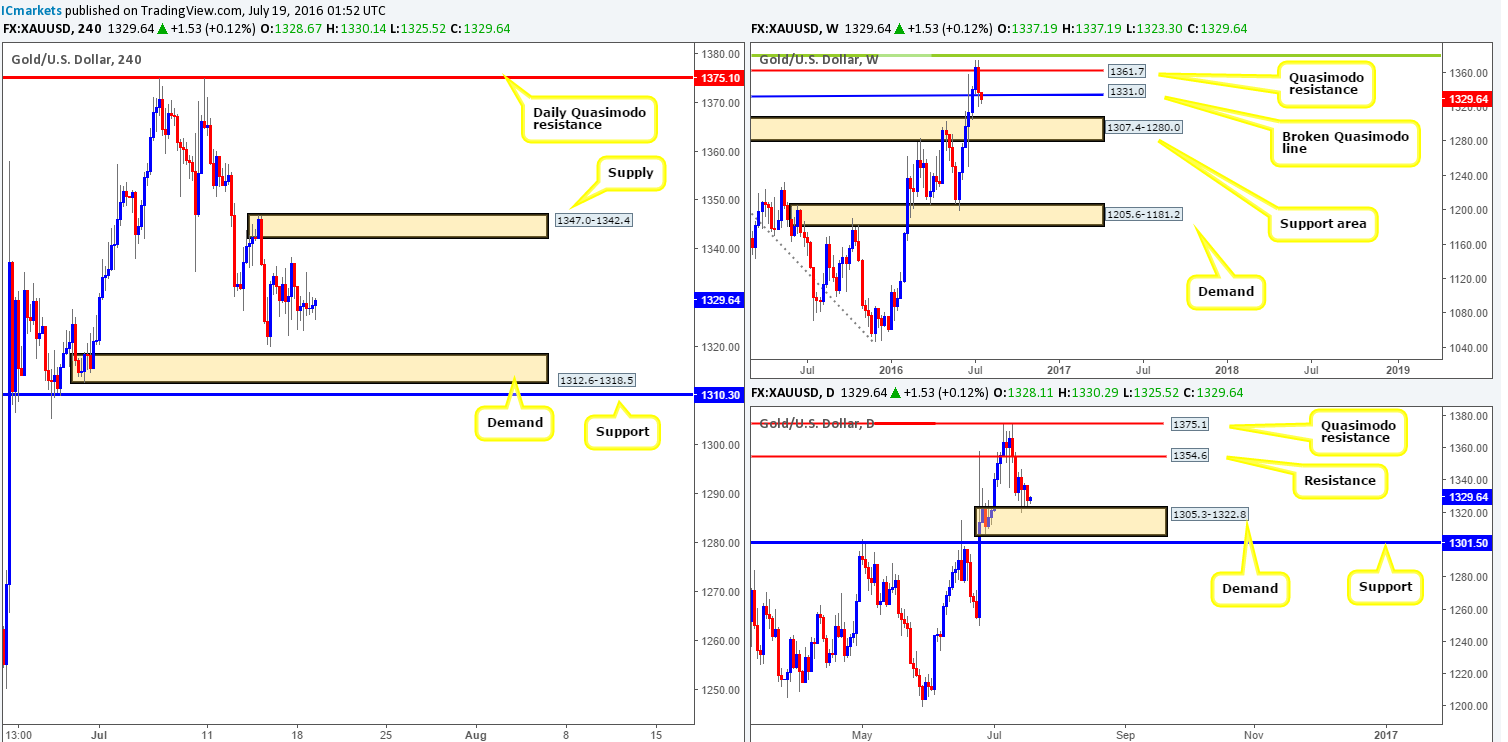
As can be seen from the H4 chart this morning, gold was quite a tedious market to watch yesterday. The day’s range equated to around $13 which formed amidst a H4 supply area coming in at 1347.0-1342.4 and a H4 demand base drawn from 1312.6-1318.5. As a result of yesterday’s lifeless movement, our outlook for the shiny metal remains unchanged…
The weekly chart shows that the yellow metal rotated from a weekly Quasimodo resistance level seen at 1367.7 last week, and forced price to connect with a broken weekly Quasimodo line coming in at 1331.0. As of this moment, the buyers look as though they’re struggling to find a foothold around this line, which could indicate that bullion may be heading further south to test the weekly support area chalked up at 1307.4-1280.0. In spite of weakness being seen around the current weekly level, daily action reveals that the metal is facing off with a daily demand base carved from 1305.3-1322.8. This – coupled with nearby daily support at 1301.5 seen just below, could be enough to half further selling in this market this week.
Our suggestions: Neither a long nor short seems attractive at this time. A long from the current H4 demand would place one against potential weekly sellers! While a short from the current H4 supply, not only opens one up to the possibility of a fakeout up to daily resistance drawn from 1354.6, but also places one against daily buyers from the current daily demand! Therefore, our team has come to a general consensus that remaining on the sidelines today and reassessing the day’s action tomorrow is the best path to take.
Levels to watch/live orders:
- Buys: Flat (Stop loss: N/A).
- Sells: Flat (Stop loss: N/A).


