
A note on lower timeframe confirming price action…
Waiting for lower timeframe confirmation is our main tool to confirm strength within higher timeframe zones, and has really been the key to our trading success. It takes a little time to understand the subtle nuances, however, as each trade is never the same, but once you master the rhythm so to speak, you will be saved from countless unnecessary losing trades. The following is a list of what we look for:
- A break/retest of supply or demand dependent on which way you’re trading.
- A trendline break/retest.
- Buying/selling tails – essentially we look for a cluster of very obvious spikes off of lower timeframe support and resistance levels within the higher timeframe zone.
- Candlestick patterns. We tend to only stick with pin bars and engulfing bars as these have proven to be the most effective.
For us, lower timeframe confirmation starts on the M15 and finishes up on the H1, since most of our higher timeframe areas begin with the H4.
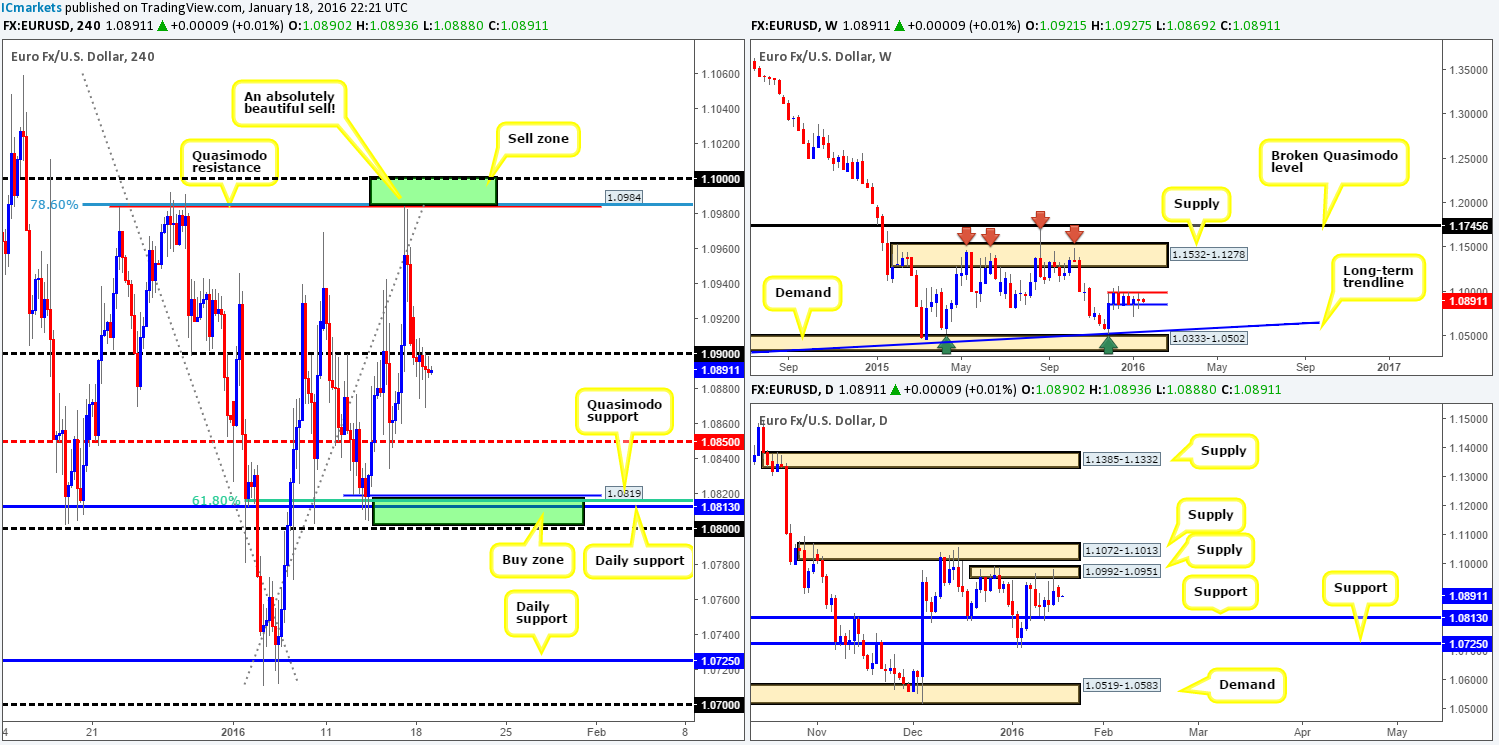
EUR/USD:
Following the open 1.0921, the pair dived below psychological support 1.0900 and spent the remainder of the day consolidating within a tight range between 1.0888 and 1.0900. This quiet spell was likely due to the U.S. markets being closed in observance of Martin Luther King Day and little news on the docket for the EUR.
Consequent to this rather lackluster performance, much of the following analysis will remain the same as the previous. You may recall from Monday’s report (http://www.icmarkets.com/blog/monday-18th-january-weekly-technical-outlook-and-review-u-s-bank-holiday-today/) that we are short from 1.0983. With the stop now firmly placed at breakeven and 70% of our position already banked, we’re looking at riding the remaining 30% down to 1.0819 – a H4 Quasimodo support (the region we initially bought from Wednesday last week). Assuming our short hits target of course, we may, dependent on how the lower timeframes react and time of day, look to buy from here once again since this area boasts daily support at 1.0813, psychological support 1.0800 and 61.8% Fibonacci support at 1.0815.
Nevertheless, for the moment 1.0900 has clearly positioned itself as resistance, and as such we plan on adding to our current sell position here, also targeting 1.0819 (waiting for lower timeframe confirmation is highly recommended). We’re not ignoring the mid-level support 1.0850, it’s just the levels in between the sell zone 1.0984/1.1000 and the buy zone 1.0819/1.0800 (green boxes on H4) are considered nothing more than mid-range, since there’s little higher-timeframe convergence.
Levels to watch/live orders:
- Buys: 1.0819/1.0800 [Tentative – confirmation required] (Stop loss: dependent on where one confirms this area).
- Sells: 1.0983 [LIVE] (Stop loss: breakeven).
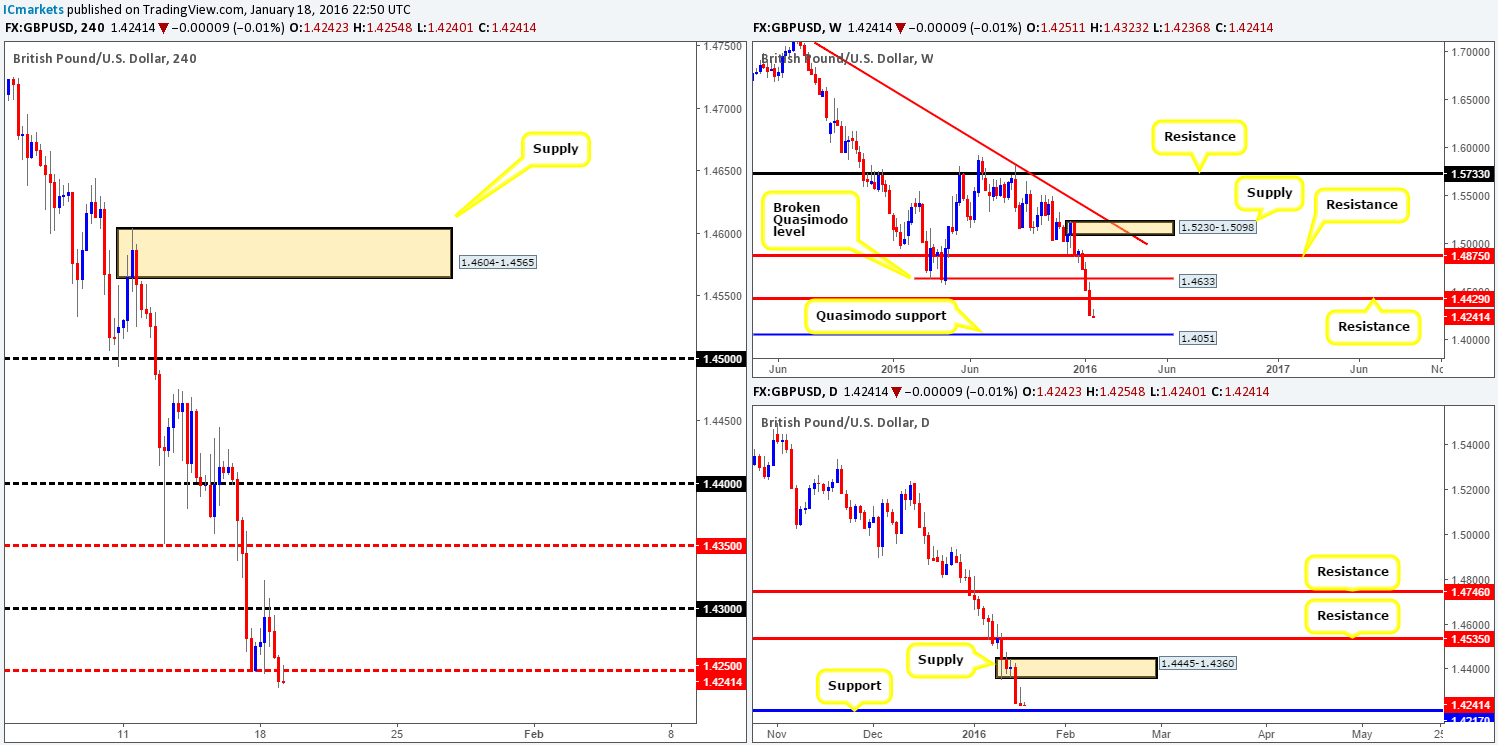
GBP/USD:
During the course of yesterday’s sessions Cable reversed its early gains from psychological resistance 1.4300, resulting in the market closing ten pips below the open at 1.4242. Given that H4 action also closed below mid-level support 1.4250 and is now seen retesting this barrier as resistance, price is likely going to cross swords with psychological support 1.4200 sometime today.
With the above in mind, here is what we have jotted down so far:
- If one is looking for longs, 1.4200 is quite an attractive number due to it merging with daily support drawn from 1.4217. However, we highly recommend only considering this level with the aid of lower timeframe buying confirmation due to where the weekly is positioned at the moment (see below in bold).
- Nevertheless, if, like most, you’re still seeing red for the Pound, selling from 1.4250 could be an option targeting the above buy zone. Should price continue driving lower, however, and break below/retest 1.4200, further selling is likely on the cards. The reason for why is not only is this market extremely bearish right now, but weekly action shows the path south clear down towards a Quasimodo support drawn from 1.4051.
Levels to watch/live orders:
- Buys: 1.4200 [Tentative – confirmation required] (Stop loss: dependent on where one confirms this level).
- Sells: 1.4250 [Tentative – confirmation required] (Stop loss: dependent on where one confirms this level). Watch for bids to be consumed around 1.4200 and then look to trade any retest seen thereafter (lower timeframe confirmation required).
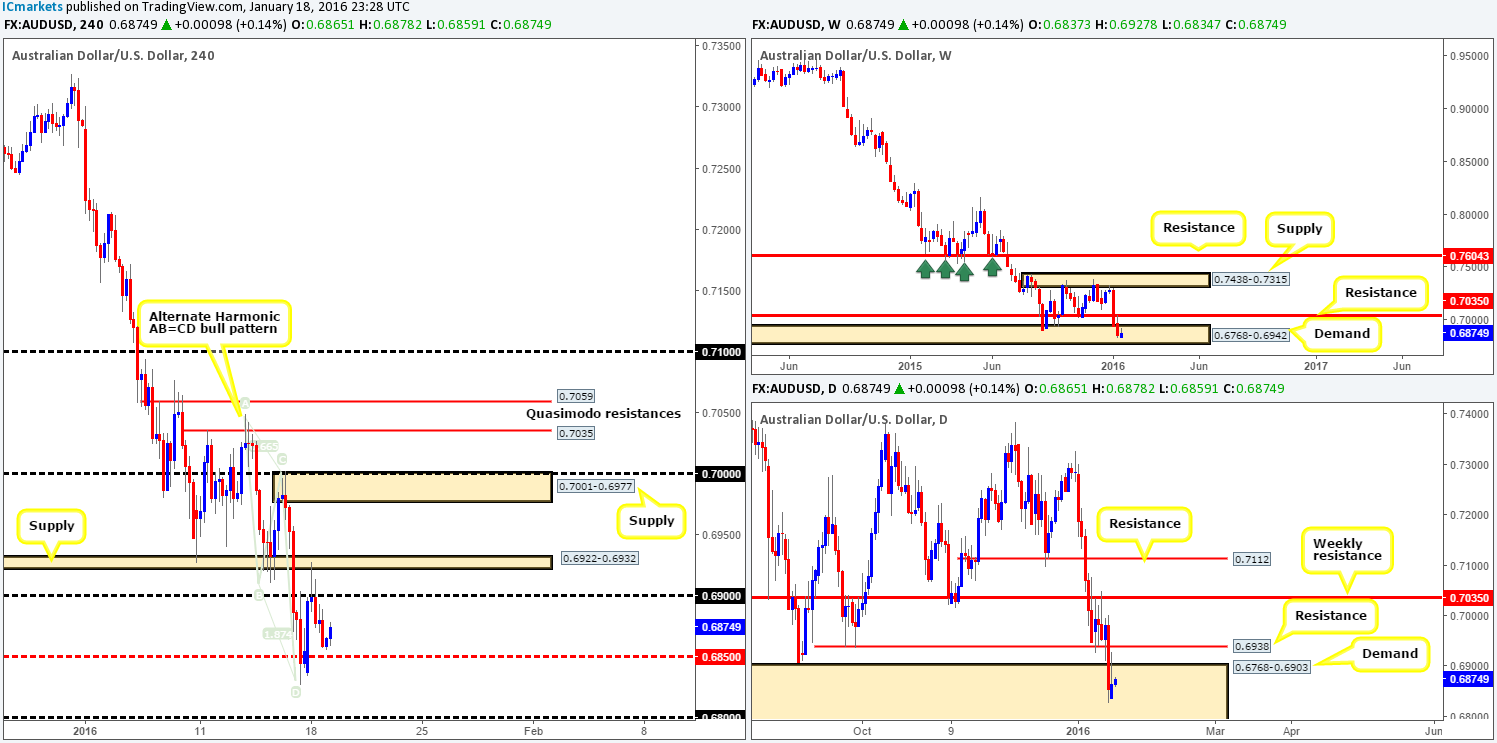
AUD/USD:
For those who read our previous report on the Aussie (http://www.icmarkets.com/blog/monday-18th-january-weekly-technical-outlook-and-review-u-s-bank-holiday-today/), you may recall we spoke about looking to enter long from 0.6850/0.6820. Not only did this area boast a H4 alternate Harmonic AB=CD bullish pattern completing around 0.6821, it also sat within demand on both the weekly and daily timeframes (0.6768-0.6942/ 0.6768-0.6903). Well done to any of our readers who took this trade, price comfortably hit H4 supply (our second take-profit target) at 0.6922-0.6932 before reversing. For anyone still long here, stops should be at breakeven by now as this market could still hit the H4 supply above at 0.7001-0.6977 – the third and final take-profit zone.
However, if like us you missed this move, all may not be lost! Owing to where the higher timeframe action is positioned right now and offers likely weakened above, there could be a chance to enter long once again from mid-level support 0.6850 today. Be that as it may, caution is advised. Bids are potentially weak around this number now and there is always the possibility that price may dive lower to fill bids at psychological support 0.6800 (also positioned deep within both the above said higher timeframe demands).
Levels to watch/live orders:
- Buys: 0.6850 region [Tentative – confirmation required] (Stop loss: dependent on where one confirms this area).
- Sells: Flat (Stop loss: N/A).
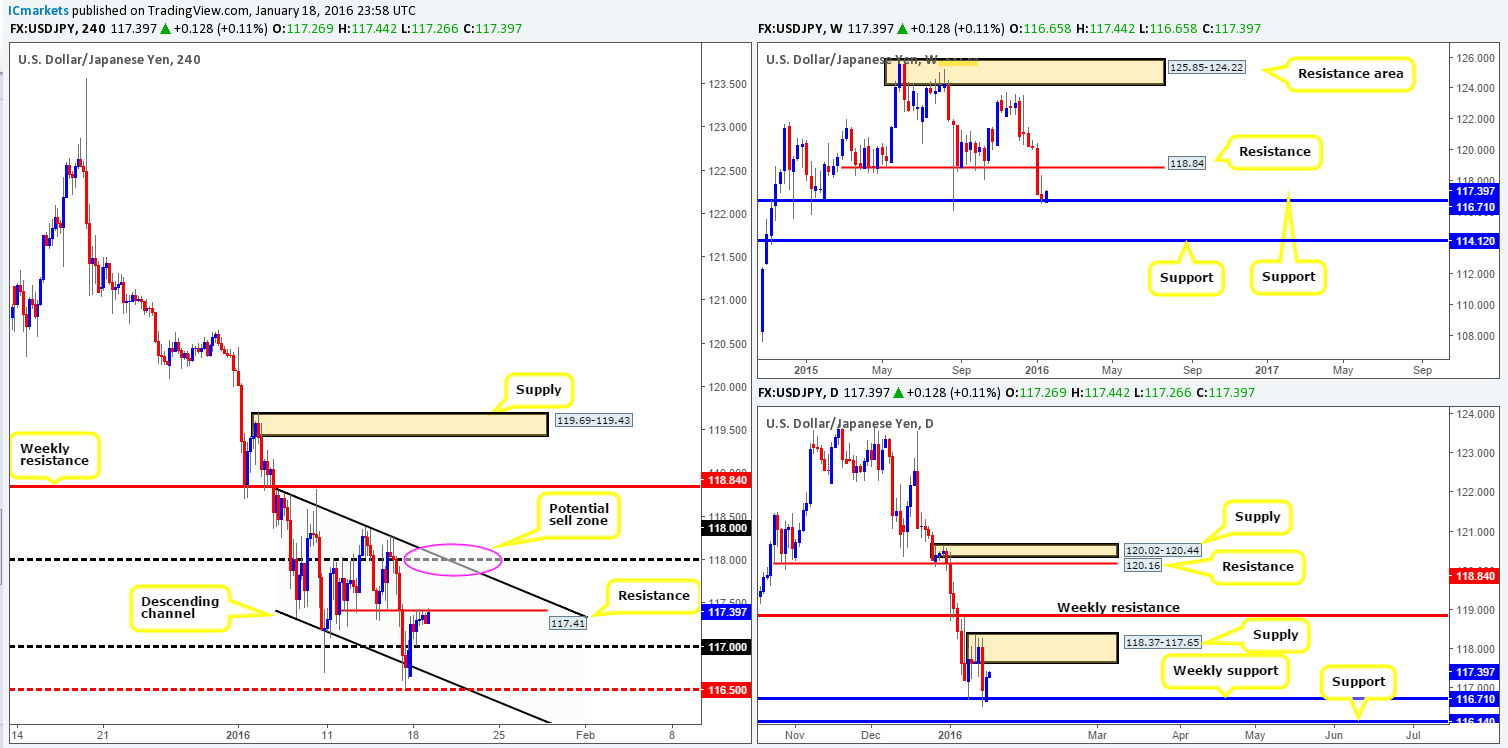
USD/JPY:
The open 116.76 saw a strong wave of bids come into this market, consequently pushing price above psychological resistance 117.00 and into the jaws of minor H4 resistance coming in at 117.41. Technically, the reason for this bounce likely stems from weekly support seen at 116.71. Does this mean one should continue looking to long this market today? Not necessarily.
On the H4, directly above the current resistance lingers psychological resistance 118.00 that fuses beautifully with channel resistance extended from the high 118.81. In addition to this, daily supply at 118.37-117.65 also encompasses this H4 resistance zone! Therefore, although price is bouncing from weekly support, one could potentially look to short (with lower timeframe confirmation) from 118.00 today for an intraday bounce lower. Aiming for any more than a bounce, however, might be a little too risky since getting on the wrong side of weekly buyers will not do your account any favors in the long run!
Levels to watch/live orders:
- Buys: Flat (Stop loss: N/A).
- Sells: 118.00 [Tentative – confirmation required] (Stop loss: dependent on where one confirms this level).
USD/CAD: (Unfortunately we missed the short at 1.4600 due to how quick price moved [a noted number to look for shorts in our previous report]).
The USD/CAD began the week with a whopping great 70-pip gap north, resulting in price hitting both psychological resistance 1.4600 and its partner resistance on the daily timeframe (Quasimodo) at 1.4605. As can be seen from the chart, the sellers wasted no time in filling this gap which ended with the Loonie bottoming out around psychological support 1.4500.
Given that price is trading around a daily resistance level at the moment (see above), and with weekly action also lodged within supply at 1.4666-1.4428, shorts could be a possibility. That being said though, due to how strongly this pair is trending right now, for our team to be given the green light to sell here we’d need to see two things happen. Firstly, a close below 1.4500 would have to take place, and secondly a confirmed retest of this number as resistance.
Should this come to fruition, we can see that there’s little standing in the way of a move lower to at least psychological support 1.4400. Furthermore, check out the awesome H4 demand consumption tail seen marked with a green arrow at 1.4422. This, at least to us, further confirms that below 1.4500 there’s little bid strength since most orders were likely consumed within this spike.
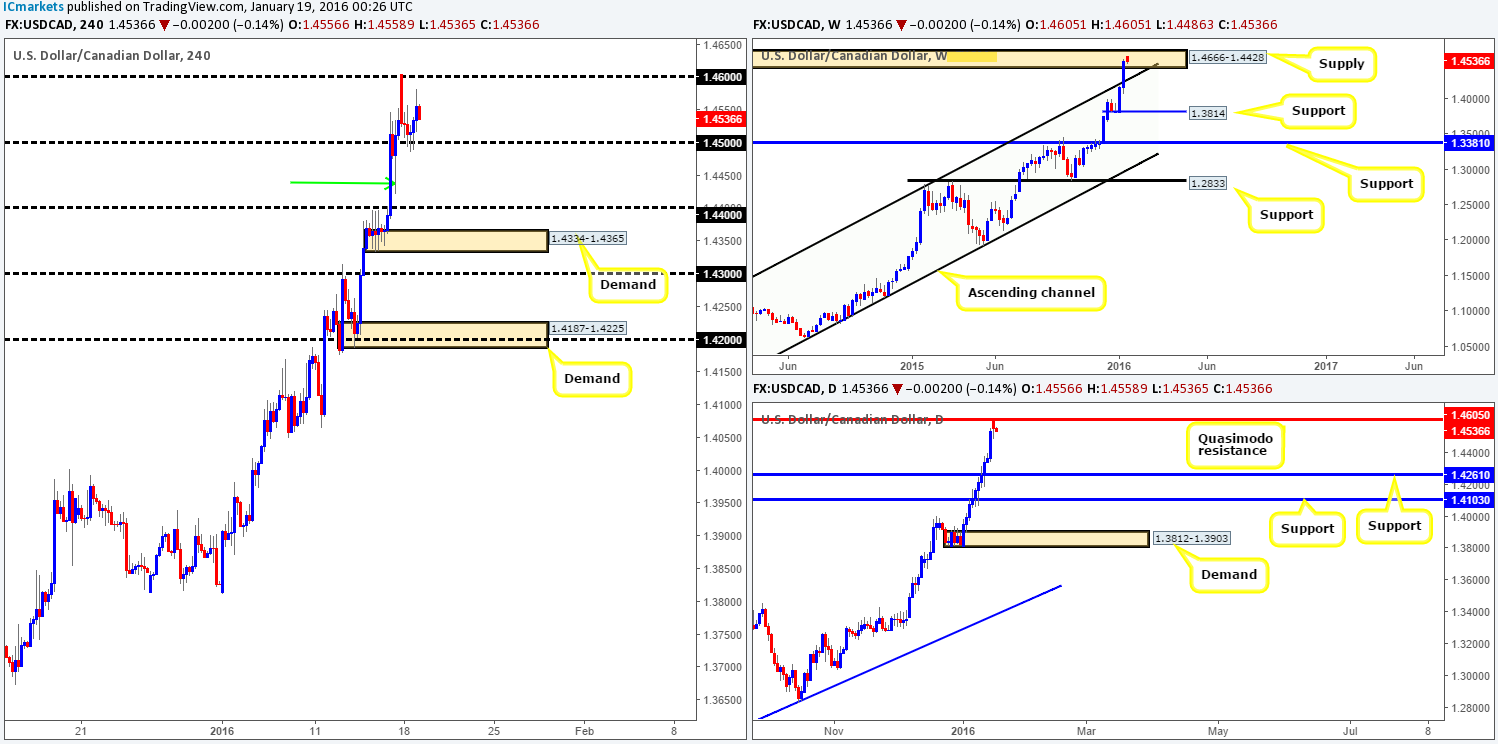
Levels to watch/live orders:
- Buys: Flat (Stop loss: N/A).
- Sells: Watch for bids to be consumed around 1.4500 and look to trade any retest of this number thereafter (lower timeframe confirmation required).
USD/CHF:
Other than the brief surge of buying seen at the open 1.0009 yesterday, market action was very quiet around the mid-level number 1.0050 due to the U.S. being on vacation in observance of Martin Luther King Day. As a result of this, our outlook for this pair remains the same as the previous report…
Beginning with the weekly chart this morning, it’s clear to see that price is capped between a faked supply at 1.0239-1.0131 and a support area seen at 0.9796-0.9902. Meanwhile, down on the daily chart, we can see that the buyers and sellers are hovering between demand at 0.9851-0.9926 and resistance coming in at 1.0123.
Moving down one more level to the H4, the Swissy pair has entered into a phase of consolidation between 0.9931/1.0100. All this means now, at least for us, is any level within this range is considered to be mid-range as we always target the extremes.
That being the case, here is what our team is looking at going into this week:
For buys:
- Between 0.9931 and psychological support 0.9900. Not only is this the extreme of the current range, but it also converges with a Fibonacci 78.6 retracement at 0.9925 and molds together with both the weekly and daily support structures mentioned above (0.9796-0.9902/0.9851-0.9926).
For sells:
- Between psychological resistance 1.0100 and daily resistance at 1.0123 (boasts a 61.8% Fibonacci retracement at 1.0122).
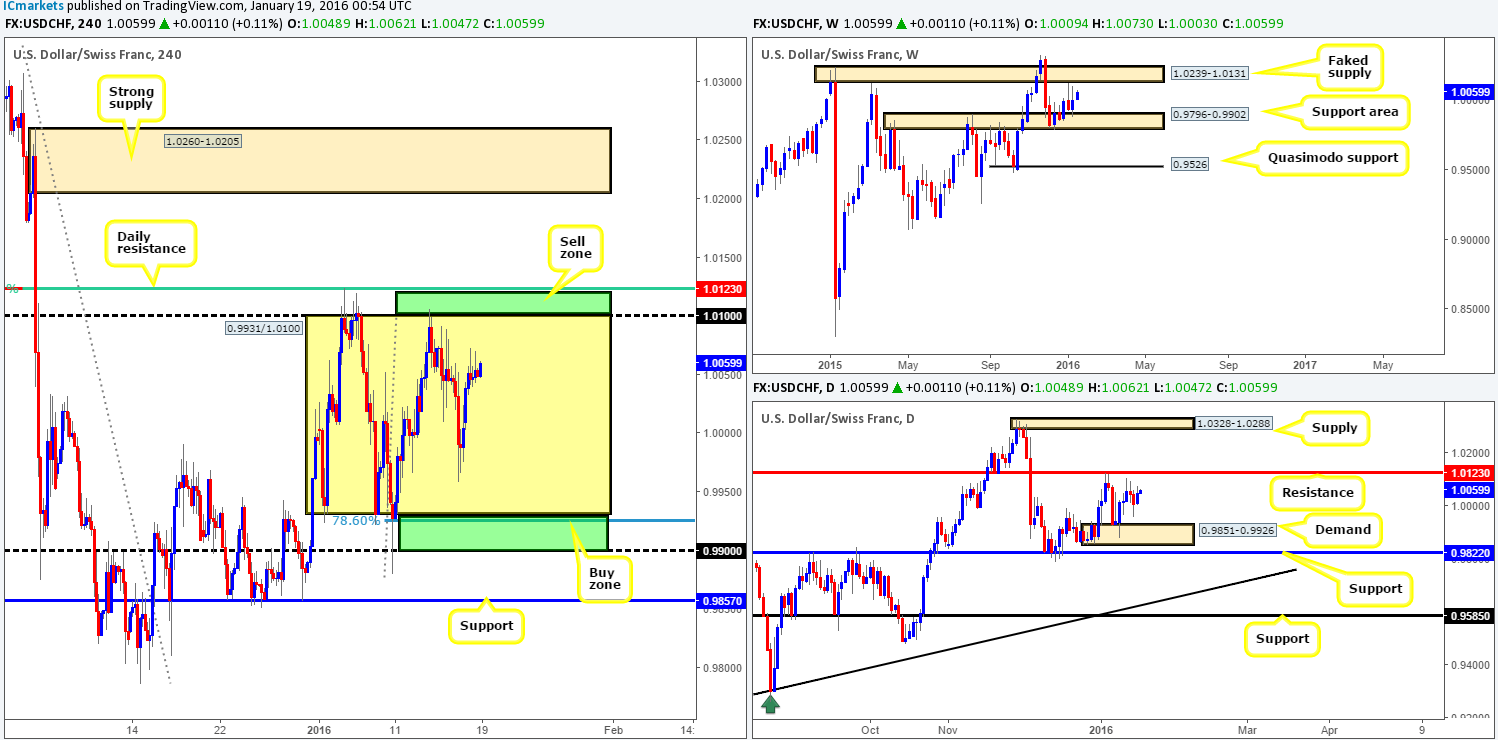
Levels to watch/live orders:
- Buys: 0.9900/0.9931 region [Tentative – confirmation preferred] (Stop loss: dependent on where one confirms this area).
- Sells: 1.0100/1.0123 region [Tentative – confirmation preferred] (Stop loss: dependent on where one confirms this area).
DOW 30:
With the U.S. on vacation yesterday, it’s no surprise that the stock market saw little action. Following the open 15996, price stabbed south to H4 demand at 15783-15899 before jabbing north to resistance at 16070, which is where price traded for the remainder of the day.
In our previous report (http://www.icmarkets.com/blog/monday-18th-january-weekly-technical-outlook-and-review-u-s-bank-holiday-today/), it was noted that our team favors the buy-side of this market due to weekly action trading from support at 15978 , and daily movement recently whipsawing through a support base drawn from 15902-16083 (potential fakeout for higher prices). We also highlighted that although price is trading from higher timeframe supports at the moment, we cannot justify buying with H4 resistance at 16070 holding this market lower.
Therefore, much the same as Monday’s analysis, this market will have to prove to us that it wants higher prices before we commit to a trade. It can do this in one of two ways:
- Close above 16070 and immediately retrace back to demand at 15783-15899 for a market long entry.
- Close above 16070 and retest this number as support. Should this occur, we would require lower timeframe confirmation to be seen following the retest, due to the possibility of a deep fakeout.
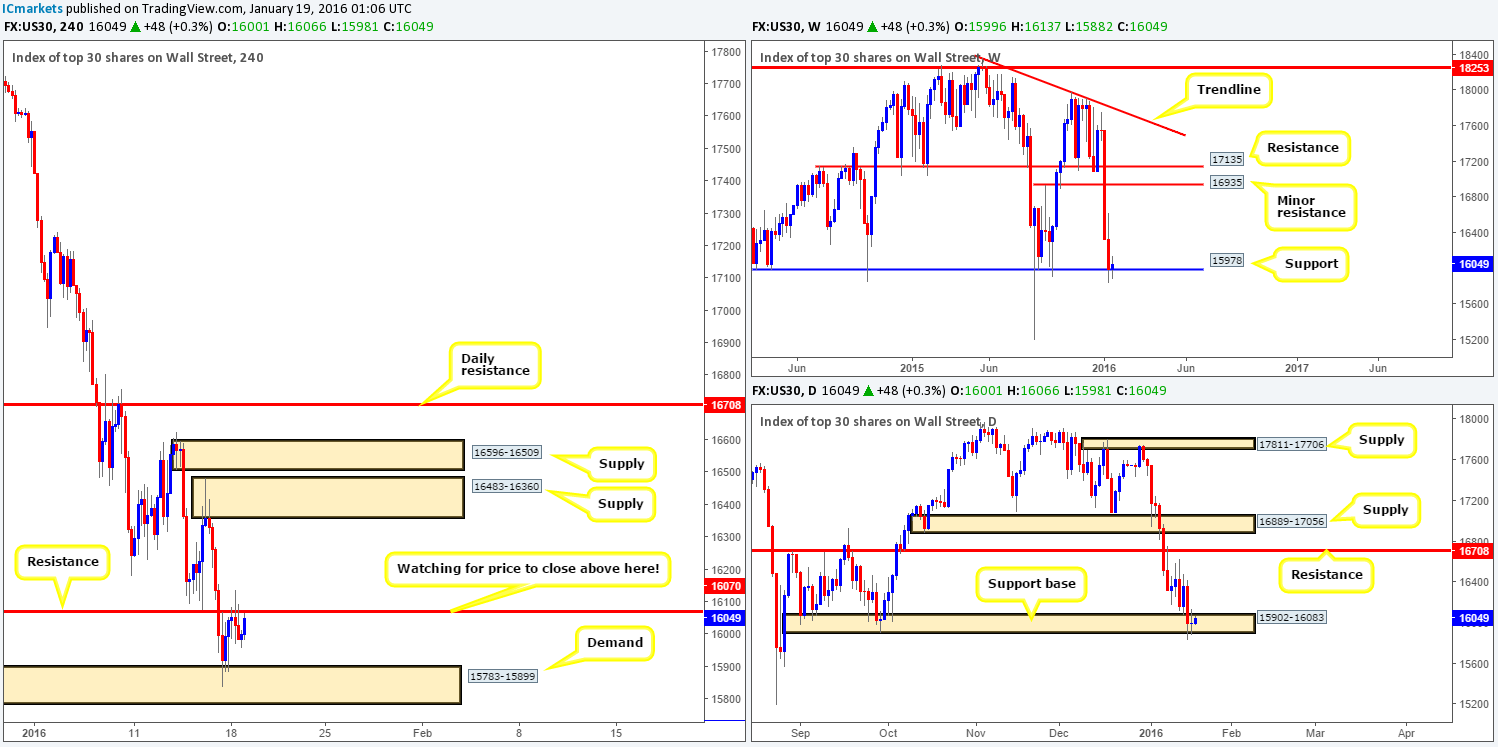
Levels to watch/live orders:
- Buys: Watch for offers to be consumed around 16070 and look to trade any retest seen thereafter (lower timeframe confirmation required). Alternatively, watch for price to close above 16070 and immediately retrace back to demand for a market long entry (Stop loss: 15755).
- Sells: Flat (Stop loss: N/A).
XAU/USD: (Gold)
Gold began the week on a positive note as a relatively conservative stream of bids flowed into the market around the open 1088.7. This pulled the yellow metal to session highs of 1093.1, before reversing and entering into a phase of consolidation for the remainder of the day, as U.S. markets were closed in observance of Martin Luther King Day.
As we mentioned in Monday’s report (http://www.icmarkets.com/blog/monday-18th-january-weekly-technical-outlook-and-review-u-s-bank-holiday-today/), our team is favoring further selling in this market. The reason for why comes from weekly action trading from supply at 1098.6-1121.7, the daily showing room to move lower to at least support at 1078.0 and H4 also showing space to decline lower to demand at 1074.8-1077.1.
As can be seen on the H4 chart, price has already begun selling off. For us to be permitted to sell here, however, we would require price to retrace back up to either the H4 resistance at 1095.6, or the H4 supply just above it at 1103.2-1100.8 (lower timeframe confirmation required at each zone).
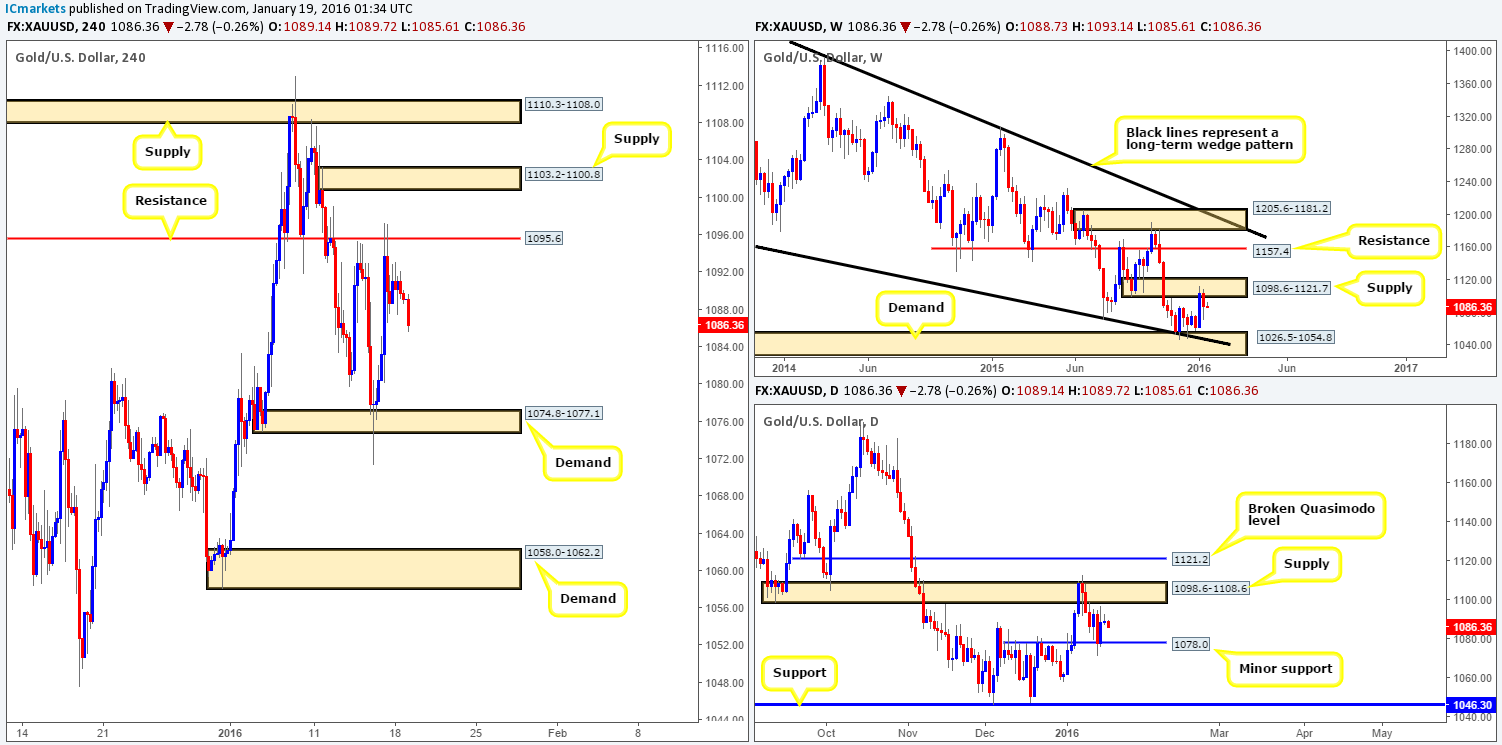
Levels to watch/live orders:
- Buys: Flat (Stop loss: N/A).
- Sells: 1095.6 [Tentative – confirmation required] (Stop loss: dependent on where one confirms this level). 1103.2-1100.8 [Tentative – confirmation required] (Stop loss: dependent on where one confirms this area).


