
EUR/USD:
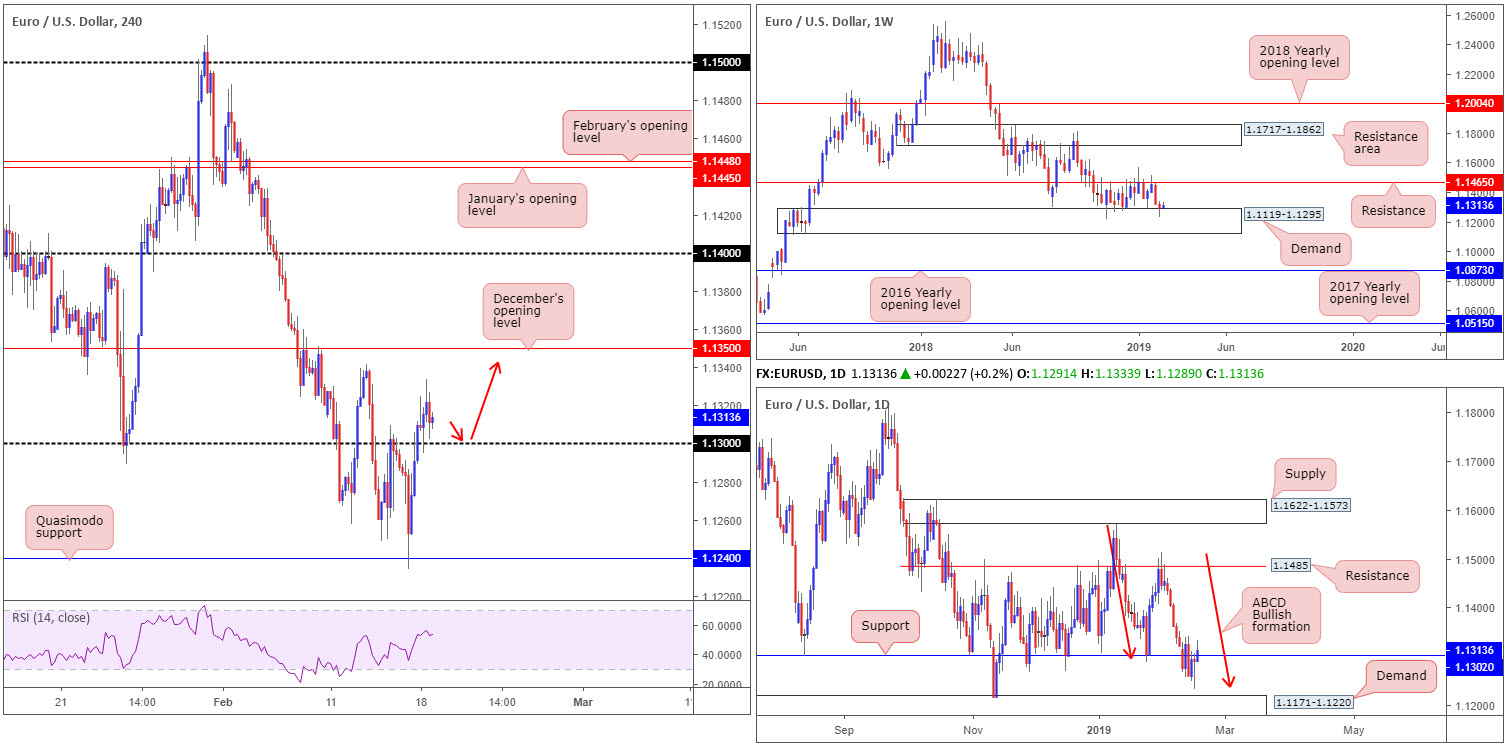
For folks who read Monday’s briefing you may recall the piece highlighting potential long opportunities on a break above/retest at 1.13 on the H4 timeframe. As you can see, the candles did indeed engulf and retest 1.13 in the shape of a H4 bullish pin-bar formation in early London hours Monday. It Might also be worth noting the H1 timeframe also chalked up a bullish pin-bar formation off this number as well. Well done to any of our readers who managed to jump aboard this move.
What gave extra credibility to buyer strength above 1.13 was last week’s segment concluding around the top edge of weekly demand coming in at 1.1119-1.1295: the lower edge of the current weekly range since late October 2018. Further adding to this, Friday’s movement shook hands with a daily ABCD bullish completion point (red arrows) around 1.1240 and ended the day recoiling towards the underside of 1.1302 as daily resistance. Engulfing 1.13 to the upside yesterday, though, also engulfed the said daily resistance (now acting support). The nearest higher-timeframe resistance target can be found on the weekly timeframe around a long standing support/resistance at 1.1465: the upper edge of the current weekly range.
As highlighted in Monday’s report, longs off 1.13 has the 1.1341 Feb 13 high to target on the H4 scale, shadowed closely by December’s opening level plotted at 1.1350.
Areas of consideration:
For those already long off 1.13, focusing on the aforementioned H4 resistance targets is optimal. Those who missed the boat yesterday may, should the H4 candles retest 1.13 again as support today, get a second chance to enter long. Like in Monday’s report, though, waiting for additional H4 candlestick confirmation to form (entry/stop parameters can be defined according to the candlestick formation) is recommended.
Today’s data points: German ZEW Economic Sentiment.
GBP/USD:
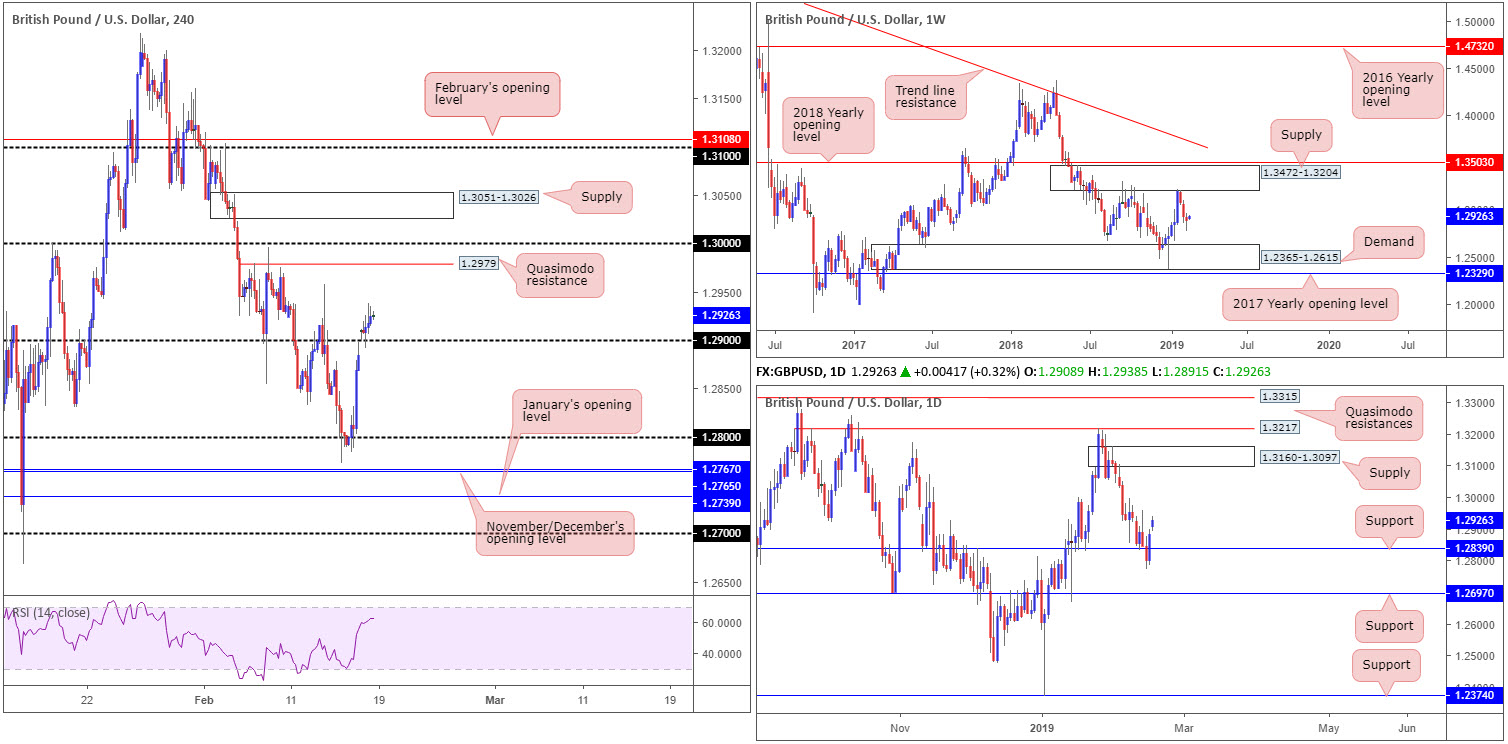
Pound sterling outperformed vs. its US counterpart Monday, in spite of a number of UK political headlines hitting the wires and a thin US session due to observance of Presidents’ Day. Cable, as you can see, kicked off the week on a high note, opening firmly above its 1.29 handle and later retesting the number as support in early London hours (check the H1 timeframe as the retest came by way of a bullish pin-bar pattern).
To the upside on the H4 timeframe, traders have the 1.2958 Feb 13 high to target, tailed closely by Quasimodo resistance at 1.2979 and then the key figure 1.30. Also worth noting above 1.30 is a striking H4 supply zone at 1.3051-1.3026.
On a broader outlook, weekly price, after declining for three consecutive weeks from supply based at 1.3472-1.3204, could potentially explore lower ground over the coming weeks in the direction of demand drawn from 1.2365-1.2615. Contrary to weekly flow eyeing lower levels, nonetheless, daily activity snapped back above resistance at 1.2839 Friday in strong fashion (now acting support). Further buying could materialise on the back of this, possibly dragging the pair as far north as supply at 1.3160-1.3097, sited just south of the current weekly supply.
Areas of consideration:
The short-term outlook bodes well for those looking to buy the pair, according to our technical studies, targeting the aforementioned H4 resistances. Traders have the option of either drilling down to the lower timeframes at current price and searching for a resistance-turned support setup to trade, or wait and see if the H4 candles retest 1.29 as support again and enter off on the back of a H4 bullish candlestick pattern (entry/stop parameters can be defined according to the candlestick formation).
Today’s data points: UK Average Earnings Index 3m/y; UK Unemployment Rate; UK Claimant Count Change.
AUD/USD:
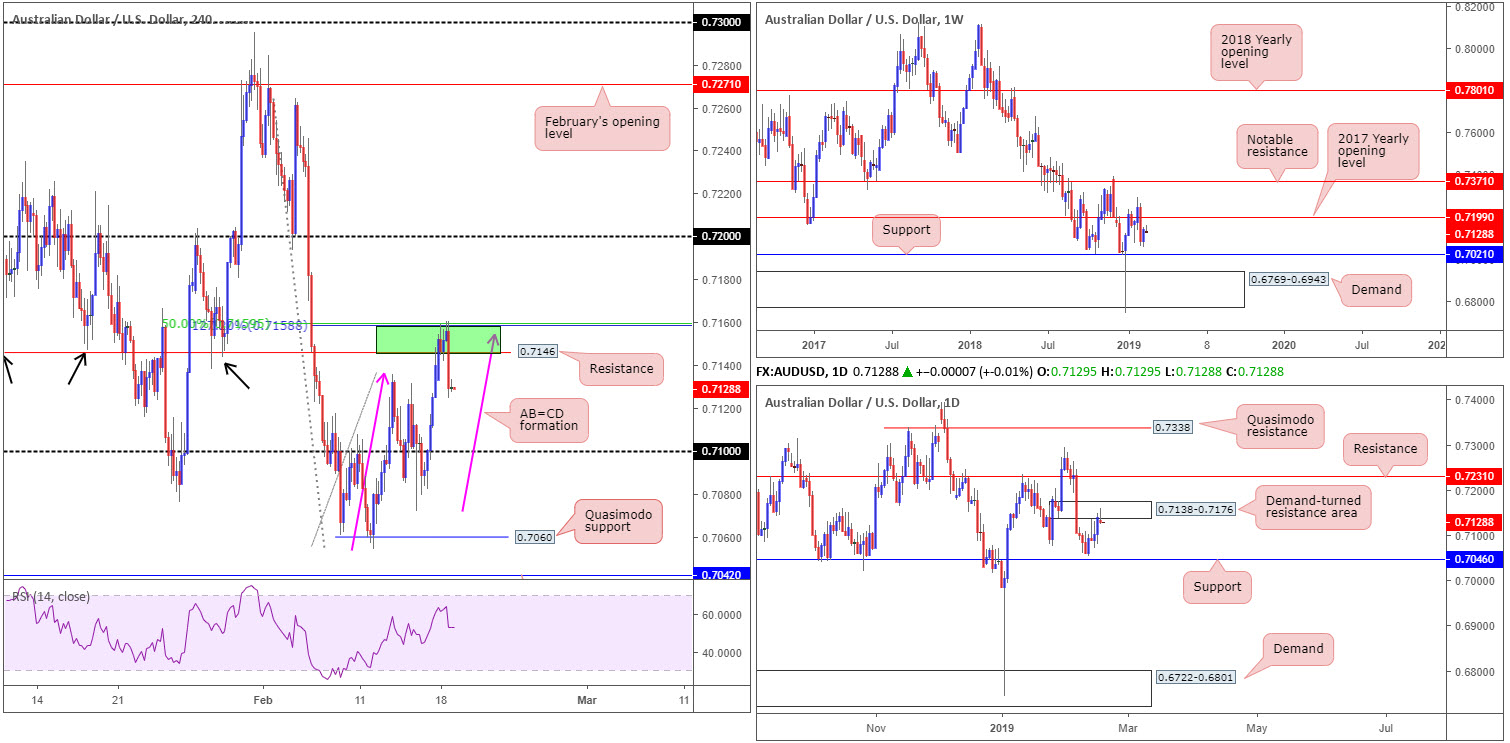
Although the H4 candles marginally breached the upper boundary of a 0.7160-0.7146 sell zone marked in green Monday, the pair, as expected, turned lower from this neighbourhood. The key observation here was the area’s levels: a nice-looking H4 AB=CD bearish pattern (pink arrows) that completed around 0.7155, a H4 resistance level at 0.7146, a H4 127.2% Fibonacci ext. point (connected to the AB=CD formation) at 0.7158 and a 50.0% H4 resistance value at 0.7159. What was also technically appealing out of this zone is the daily demand-turned resistance area coming in at 0.7138-0.7176, which, as you can see, is currently producing a bearish pin-bar response, as we write.
Well done to any of our readers who managed to jump aboard the move out of 0.7160-0.7146 yesterday. The next support target on the H4 timeframe falls in around 0.71.
Areas of consideration:
Aside from a sell at 0.7160-0.7146, the research team does not see much else to hang its hat on today. That is, of course, unless you fancy the look of the daily bearish pin-bar formation at the underside of the daily supply mentioned above at 0.7138-0.7176, targeting daily support at 0.7046 (entry/stop parameters can be defined according to the candle’s structure).
Today’s data points: Limited.
USD/JPY:
It was another pretty much sideways day Monday, largely due to US banks closing in observance of Presidents’ Day and limited macroeconomic news. As a result, much of the following report will echo related views expressed in Monday’s briefing.
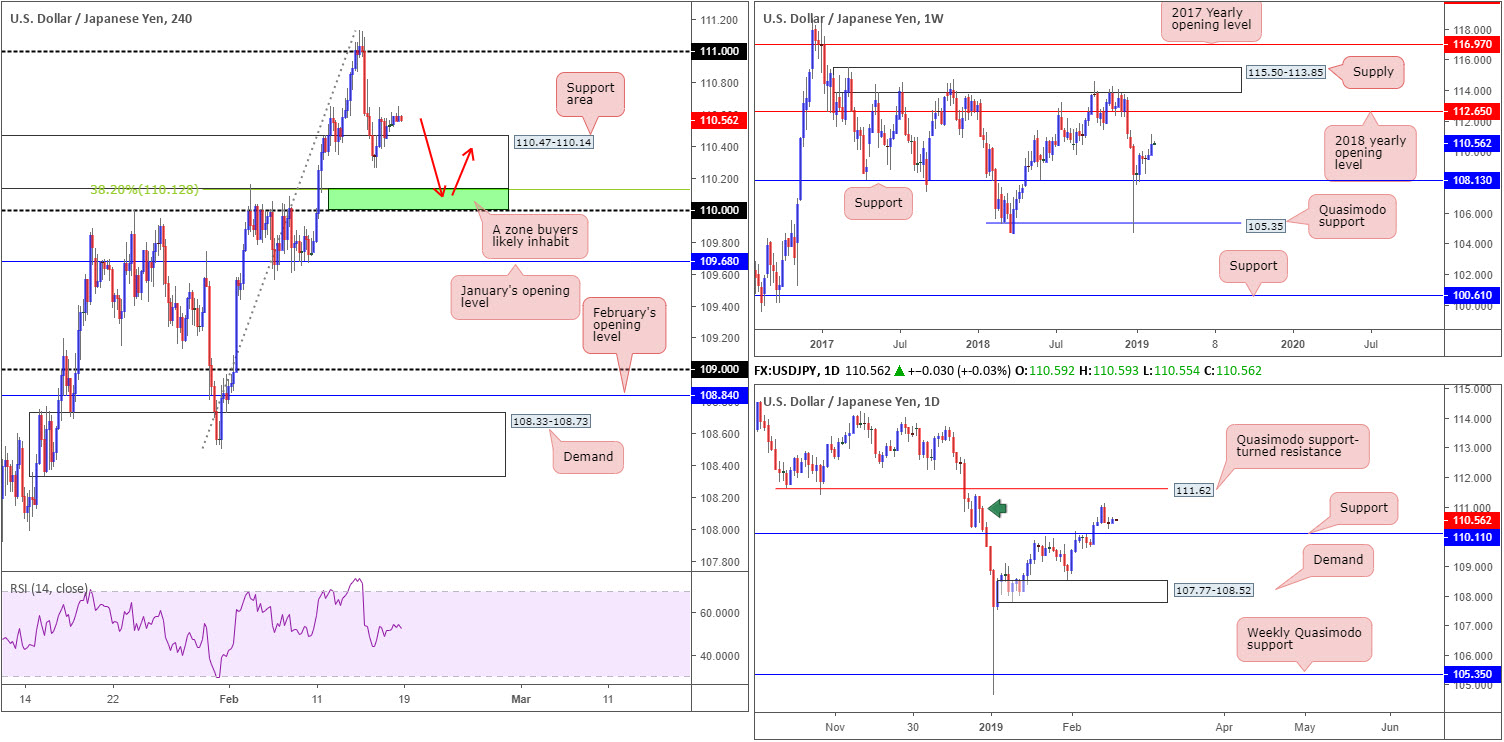
Beginning from the top this morning, we can see USD/JPY bulls went on the offensive last week, achieving highs at 111.12. As long as the unit remains above support drawn from 108.13, upside on this timeframe is relatively free until connecting with its 2018 yearly opening level at 112.65.
Following Thursday’s strong bearish rotation candle on the daily timeframe, the market has generated little follow-through movement. Surrounding structure on the daily timeframe consists of a supply area at 111.40-110.27 (green arrow), a support level coming in at 110.10 and a Quasimodo support-turned resistance at 111.62. The aforementioned support level will likely enter the fold sometime this week, which we believe will hold ground given where we’re trading on the weekly timeframe. This may eventually run stops above the current supply and bring in sellers from 111.62.
Climbing down to the H4 candles, traders will observe the market trading within the upper limit of a rather large support area at 110.47-110.14. Beneath the current support zone, traders may also want to pencil in daily support mentioned above at 110.11, shadowed closely by the 110 handle. Both levels boast relatively strong history, with the daily barrier positioned close by a 38.2% H4 Fibonacci support value at 110.12.
Areas of consideration:
Having observed weekly action poised to attack higher levels this week, as well as daily support plotted nearby, the green zone marked on the H4 timeframe between 110/110.12 (the round number 110, the daily support at 110.11 and the 38.2% H4 Fibonacci support at 110.12) remains worthy of the watchlist today/this week. The only caveat, nevertheless, is the possibility of a stop run materialising through 110 (common viewing around psychological numbers) before an advance is seen. To help avoid being stung, waiting for additional H4 candlestick confirmation to form out of the zone is an idea (entry/stop levels can be defined according to the candlestick’s rules of engagement).
Today’s data points: Limited.
USD/CAD:
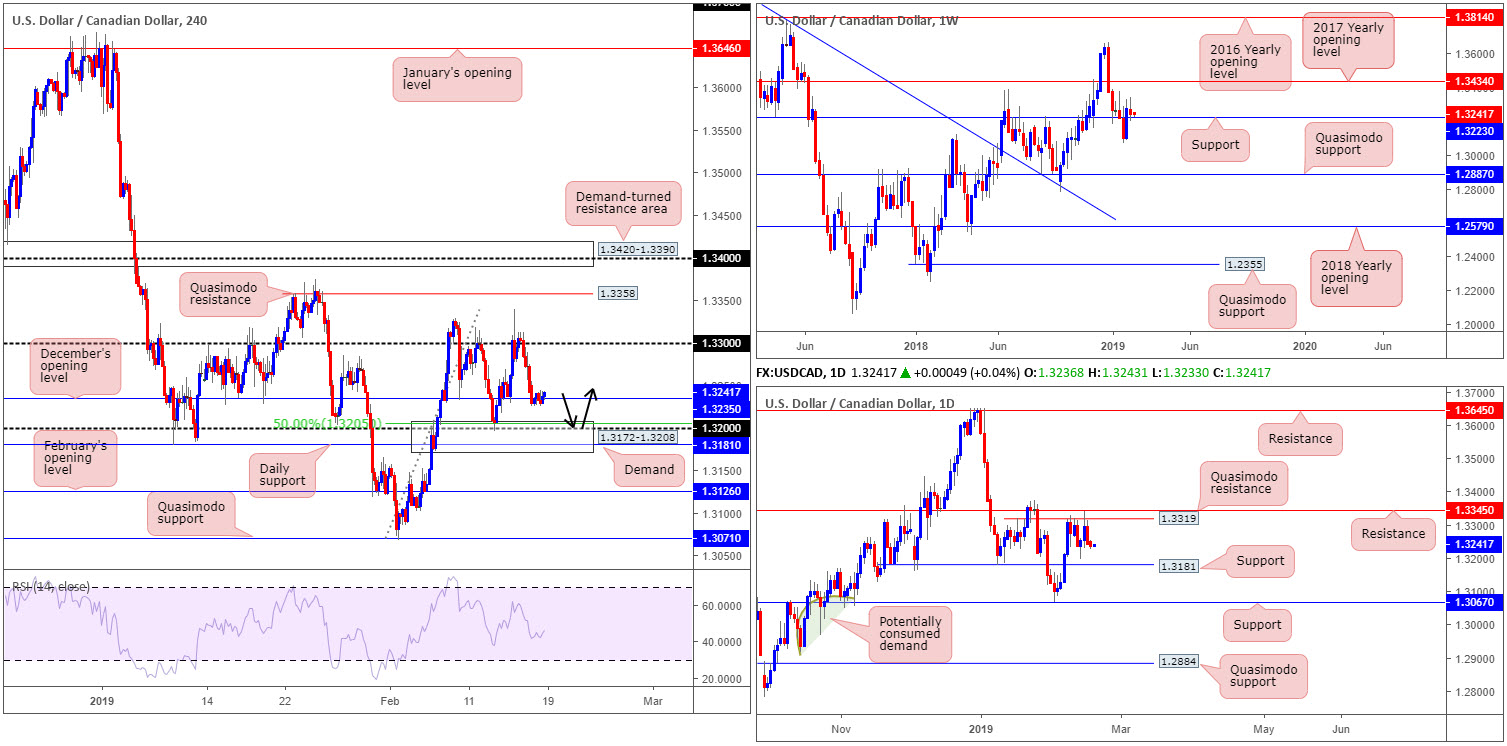
In similar fashion to the USD/JPY, the USD/CAD is also little changed this morning, spending Monday’s segment flipping between gains/losses around December’s opening level at 1.3235 on the H4 timeframe. In view of yesterday’s lacklustre performance, the research team’s outlook remains unchanged.
After reclaiming two weeks’ worth of losses and recapturing weekly resistance at 1.3223 two weeks ago, last week’s action retested 1.3223 as support and contained losses. By and large, though, the research team are uninspired by the response off the said support. While an advance towards the 2017 yearly opening level at 1.3434 is still not out of the question, traders should prepare for the possibility of price crossing beneath 1.3223 this week and perhaps making a run in the direction of weekly Quasimodo support coming in at 1.2887.
Since Feb 7, the daily candles have had upside capped by Quasimodo resistance at 1.3319, shadowed closely by another coating of resistance priced in at 1.3345. Friday’s motion, as you can see, concluded the week by way of a near-full-bodied bearish candle and, therefore, could spur additional selling this week towards support dressed nearby at 1.3181.
Underneath 1.3235 mentioned above on the H4 timeframe, nearby support rests at 1.32 (merges with a 50.0% support value at 1.3205), tailed closely by the daily support level mentioned above at 1.3181. Note 1.32 and 1.3181 are also enveloped within a proven demand area seen at 1.3172-1.3208.
Areas of consideration:
The H4 demand area mentioned above at 1.3172-1.3208 remains of interest for a potential long play, having noted its surrounding confluence (see above in bold). With stop-loss orders set beneath 1.3172, buyers will likely be looking for a H4 close above December’s opening level before reducing risk to breakeven. Ultimately, to secure reasonable risk/reward, however, the underside of 1.33 stands as an initial take-profit target.
Today’s data points: Limited.
USD/CHF:
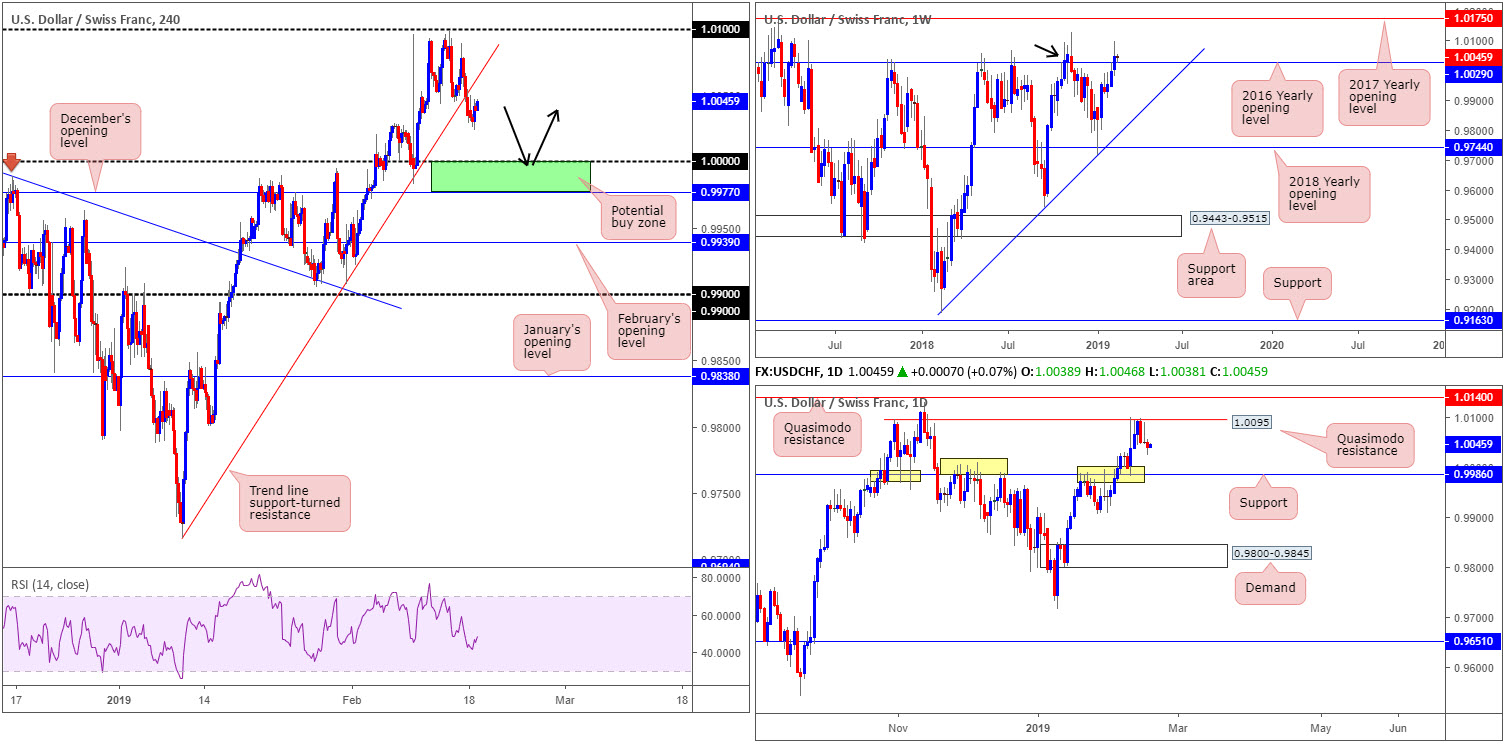
Kicking this morning’s report off from the top, recent movement on the weekly timeframe retested the 2016 yearly opening level at 1.0029 as support. Though this is considered an indication price is likely to head higher, possibly towards the 2017 yearly opening level at 1.0175, the barrier’s history as a resistance may still draw in sellers as it did in November 2018 (black arrow).
Despite weekly flow suggesting a possible continuation to the upside this week, daily players failed to overthrow Quasimodo resistance at 1.0095 last week. What’s also notable from a technical perspective is Friday’s movement closing in the shape of a bearish pin-bar formation, which generated a small downside move Monday. The next downside target on the daily timeframe is seen around a long-standing resistance/support at 0.9986.
H4 trend line support (extended from the low 0.9716), as you can see, was consumed in recent sessions, though the candles established support at lows of 1.0024, bolstered by the 2016 yearly opening level mentioned above on the weekly timeframe at 1.0029. Aside from the recently broken trend line support acting as potential resistance, the next area of resistance falls in around the 1.01 handle (positioned just north of the daily Quasimodo resistance at 1.0095). To the downside, however, 1.0000 (parity) is seen, followed closely by December’s opening level at 0.9977. Note this widely watched round number is located 14 pips above the daily support at 0.9986.
Areas of consideration:
While weekly price is bouncing from 1.0029, this is still considered a possible resistance zone, according to our technical reading. This, and daily price trading from a Quasimodo resistance with room to move lower, could see 1.0000 brought into view.
The combination of the daily support mentioned above at 0.9986 and 1.0000 offers a support area to keep an eye on this week, which may bounce price higher (stop-loss orders can be planted below December’s opening level at 0.9977 – green). In regards to an initial upside target, it’s a little difficult to judge at this point having not witnessed the approach.
Today’s data points: Limited.
Dow Jones Industrial Average:
As expected, US equities took on a sober approach Monday as US banks were closed in observance of Presidents’ Day. Given this, much of Monday’s outlook remains intact.
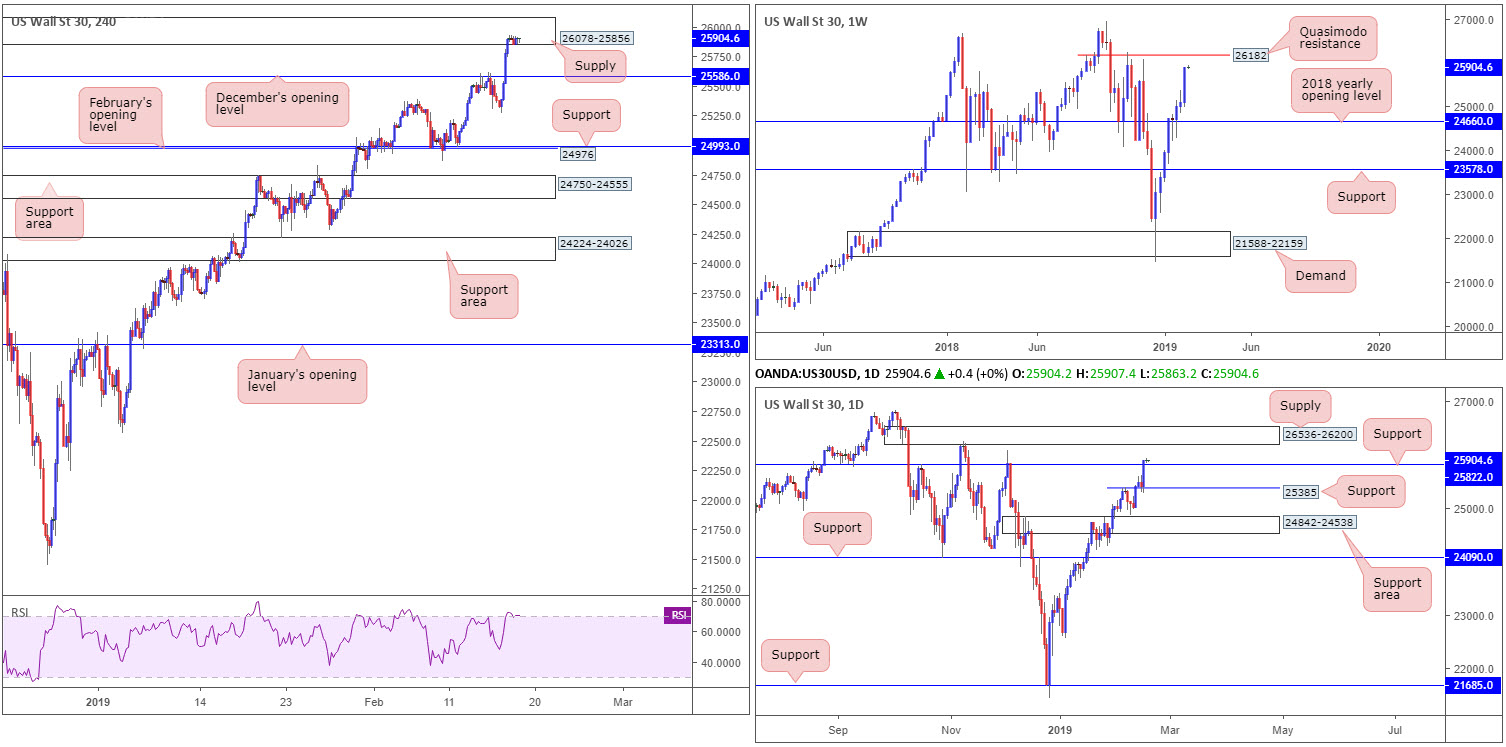
Since clearing and retesting the 2018 yearly opening level at 24660 as support on the weekly timeframe, the Dow Jones Industrial Average, in the shape of a near-full-bodied bull candle, reflects a strong bullish stance, up 800 points last week. Further buying this week has Quasimodo resistance at 26182 to target.
Recent trade also observed the daily candles establish support off 25385 (broken high-turned support) and marginally close above 25822. In the event this level holds firm as support this week, upside appears reasonably free until connecting with supply at 26536-26200 (sited just north of the weekly Quasimodo resistance).
Trade optimism provided fresh impetus Friday, pulling the candles beyond December’s opening level at 25586 into the walls of a supply zone coming in at 26078-25856, where price remained Monday by way of a tight consolidation. Note this supply is positioned directly beneath daily supply mentioned above at 26536-26200.
Areas of consideration:
Although US equities trade with a strong upside bias, notable resistance is on the horizon. We have Quasimodo resistance out of the weekly timeframe at 26182, which is sited just beneath daily supply at 26536-26200, though is positioned above H4 supply at 26078-25856. Therefore, taking a long position in this market is difficult, according to our technical studies.
As for selling this week, the research team notes to wait and see if the unit connects with the weekly Quasimodo resistance 26182. Bringing in weekly sellers from here, and also daily sellers from nearby supply at 26536-26200, is likely enough to draw in sellers for a bounce lower. For conservative traders concerned about trading countertrend, waiting for a H4 bearish candlestick formation to print off 26182 is an option. This not only helps decipher whether sellers are active or not, it also provides entry/stop parameters to work with.
Today’s data points: Limited.
XAU/USD (GOLD):
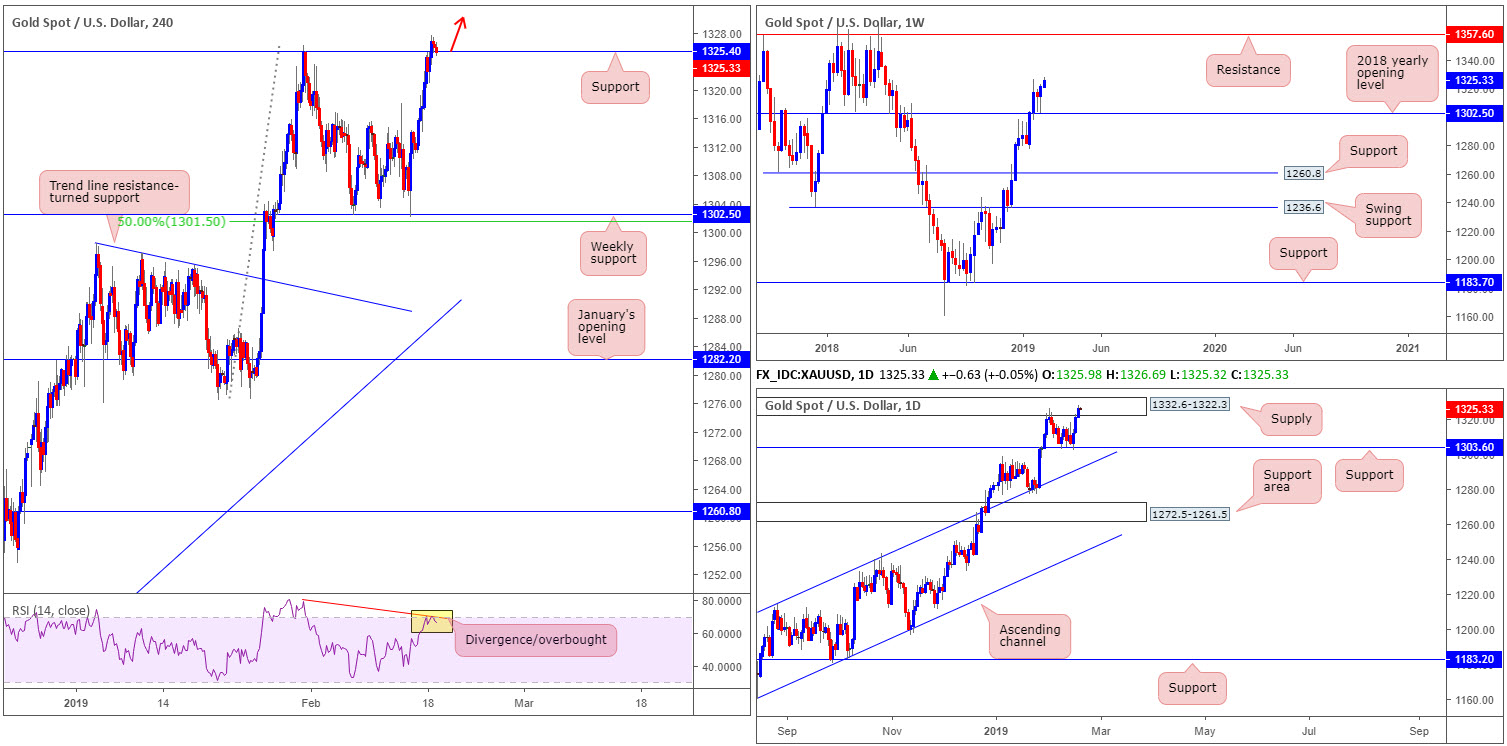
Demand for the yellow metal continued to be seen Monday, registering its third consecutive daily gain following the strong move observed off the 2018 yearly opening level at 1302.5 on the weekly timeframe (this was a noted level for buying last week – well done to those still long this market). With respect to upside targets from the current angle, buyers could potentially stretch this market as far north as weekly resistance plotted at 1357.6.
For traders who read Monday’s briefing you may recall the piece highlighted potential longs above H4 resistance at 1325.4. As can be seen from the H4 chart this morning, the level has indeed suffered a breach to the upside and was swiftly retested as support soon after. Although this barrier is housed within daily supply at 1332.6-1322.3, scope to move higher on the weekly timeframe could potentially drive buying within the current supply. Despite this, the H4 RSI indicator displays a clear divergence/overbought reading at the moment.
Areas of consideration:
Should the H4 candles hold ground at support 1325.4 (as we write, the level is being tested again) and chalk up a notable H4 bullish candlestick formation this would, given the room seen to move higher on the weekly timeframe, likely be sufficient enough to condone a long in this market (entry/stop levels can be defined according to the pattern). Should this come to fruition, reducing risk to breakeven upon viewing a decisive H4 close above the top edge of daily supply is an idea, with the next upside target not entering the frame until 1350.7: a H4 Quasimodo resistance level. Therefore, like the long off 1302.5, there appears to be plenty of room for high risk/reward here.
The accuracy, completeness and timeliness of the information contained on this site cannot be guaranteed. IC Markets does not warranty, guarantee or make any representations, or assume any liability with regard to financial results based on the use of the information in the site.
News, views, opinions, recommendations and other information obtained from sources outside of www.icmarkets.com.au, used in this site are believed to be reliable, but we cannot guarantee their accuracy or completeness. All such information is subject to change at any time without notice. IC Markets assumes no responsibility for the content of any linked site. The fact that such links may exist does not indicate approval or endorsement of any material contained on any linked site.
IC Markets is not liable for any harm caused by the transmission, through accessing the services or information on this site, of a computer virus, or other computer code or programming device that might be used to access, delete, damage, disable, disrupt or otherwise impede in any manner, the operation of the site or of any user’s software, hardware, data or property.


