
A note on lower timeframe confirming price action…
Waiting for lower timeframe confirmation is our main tool to confirm strength within higher timeframe zones, and has really been the key to our trading success. It takes a little time to understand the subtle nuances, however, as each trade is never the same, but once you master the rhythm so to speak, you will be saved from countless unnecessary losing trades. The following is a list of what we look for:
- A break/retest of supply or demand dependent on which way you’re trading.
- A trendline break/retest.
- Buying/selling tails/wicks – essentially we look for a cluster of very obvious spikes off of lower timeframe support and resistance levels within the higher timeframe zone.
- Candlestick patterns. We tend to only stick with pin bars and engulfing bars as these have proven to be the most effective.
We search for lower timeframe confirmation between the M15 and H1 timeframes, since most of our higher-timeframe areas begin with the H4. Stops are usually placed 5-10 pips beyond confirming structures.
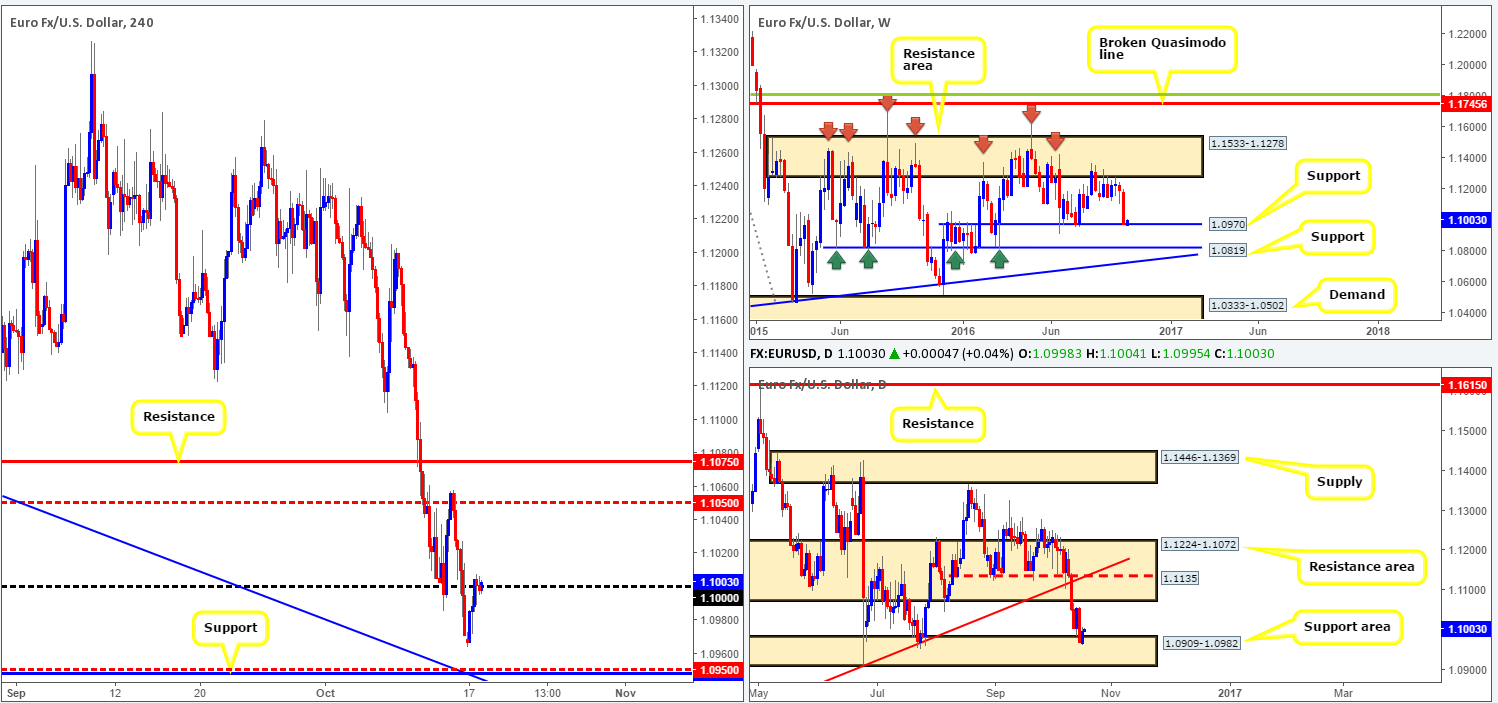
EUR/USD:
Across the board, the US dollar declined in value yesterday, resulting in the EUR pulling back and testing the key figure 1.10 going into the US session. To our way of seeing things, 1.10 looks vulnerable. Our reasoning lies within the higher-timeframe structures. Over on the weekly chart, price is currently shaking hands with a support level coming in at 1.0970, while down on the daily chart, the pair is now seen crossing swords with a support area formed at 1.0909-1.0982. The next upside target on the higher timeframes is a daily resistance area drawn from 1.1224-1.1072.
Our suggestions: While to many traders, a bounce lower from the 1.10 neighborhood is a logical scenario. Nevertheless, we would have to humbly disagree here given the situation over on the bigger picture (see above). As such, we’re looking for a decisive CLOSE ABOVE 1.10 today, as this will likely do two things. Firstly, confirm upside strength from the aforementioned higher-timeframe supports, and secondly, open up the floodgates for price to challenge the H4 mid-way resistance 1.1050/H4 resistance1.1075. Remember guys, this H4 resistance also represents the underside of the daily resistance area (1.1072) we mentioned above: the next upside target on the higher timeframes. Therefore, expect some opposition around this region.
A close above 1.10 followed by a retest that holds firm would, at least in our book, be sufficient enough to condone a long entry in this market, targeting 1.1050/1.1075. Fundamentally, however, we have US CPI data scheduled to hit the wire at 12.30pm GMT today, so do remain vigilant around this time!
Levels to watch/live orders:
- Buys: Watch for a decisive close above 1.10 followed by a firm retest as support (Stop loss: beyond the supporting candle).
- Sells: Flat (Stop loss: N/A).
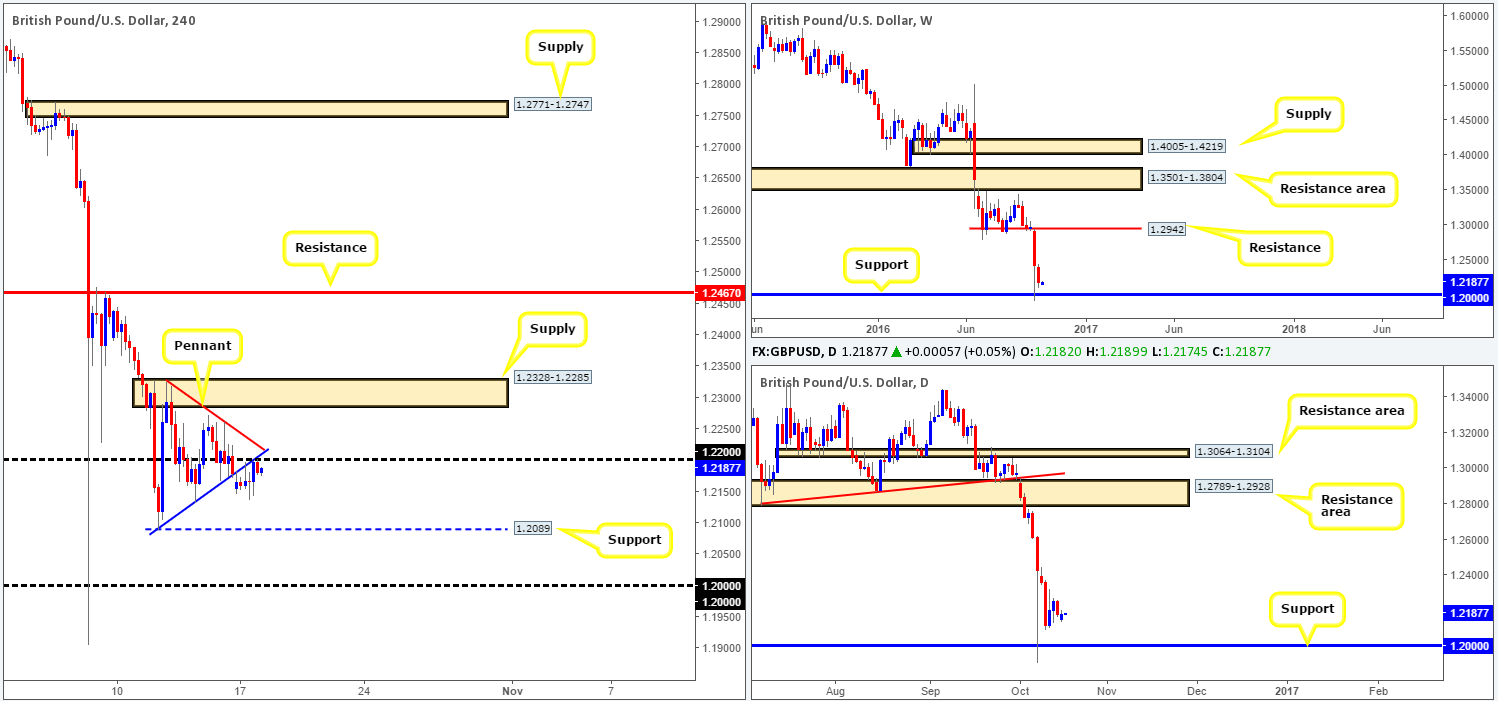
GBP/USD:
For the most part, it was a relatively quiet day’s trading yesterday. From the H4 chart, we can see that cable gapped lower in the morning, consequently placing the candles beyond the lower edge of a bearish pennant formation (1.2342/1.2089). Following this, price went on to retest the underside of the pennant edge on three occasions. The third test, however, as you can see, boasts psychological resistance from 1.22, which is currently holding the unit lower.
This – coupled with the pair clearly entrenched within a downtrend at present, as well as both the weekly and daily structures signaling further downside to 1.20 may be on the cards, shorts from 1.12 is certainly somewhere we’d consider an attractive location to trade from, targeting H4 support at 1.2089 as an immediate take-profit zone.
Our suggestions: While the 1.12 region is a logical area for price to weaken from, one may want to note that we have a string of UK data scheduled for release at 8.30am today, including CPI y/y and PPI reports, along with US CPI data at 12.30pm GMT. Therefore, to avoid the dreaded fakeout, which is common around psychological boundaries, we will not consider this a valid sell zone until a lower timeframe sell signal has been seen. This could be either a break below demand followed by a retest, a trendline break/retest or simply a collection of well-defined selling wicks around the 1.12 mark. Generally speaking, we search for lower timeframe confirmation between the M15 and H1 timeframes, since most of our higher-timeframe areas begin with the H4. Stops are usually placed 5-10 pips beyond confirming structures.
Levels to watch/live orders:
- Buys: Flat (Stop loss: N/A).
- Sells: Keep an eye on lower timeframe action around the underside of the recently broken H4 pennant formation. (Stop loss: dependent on where one confirms this area).
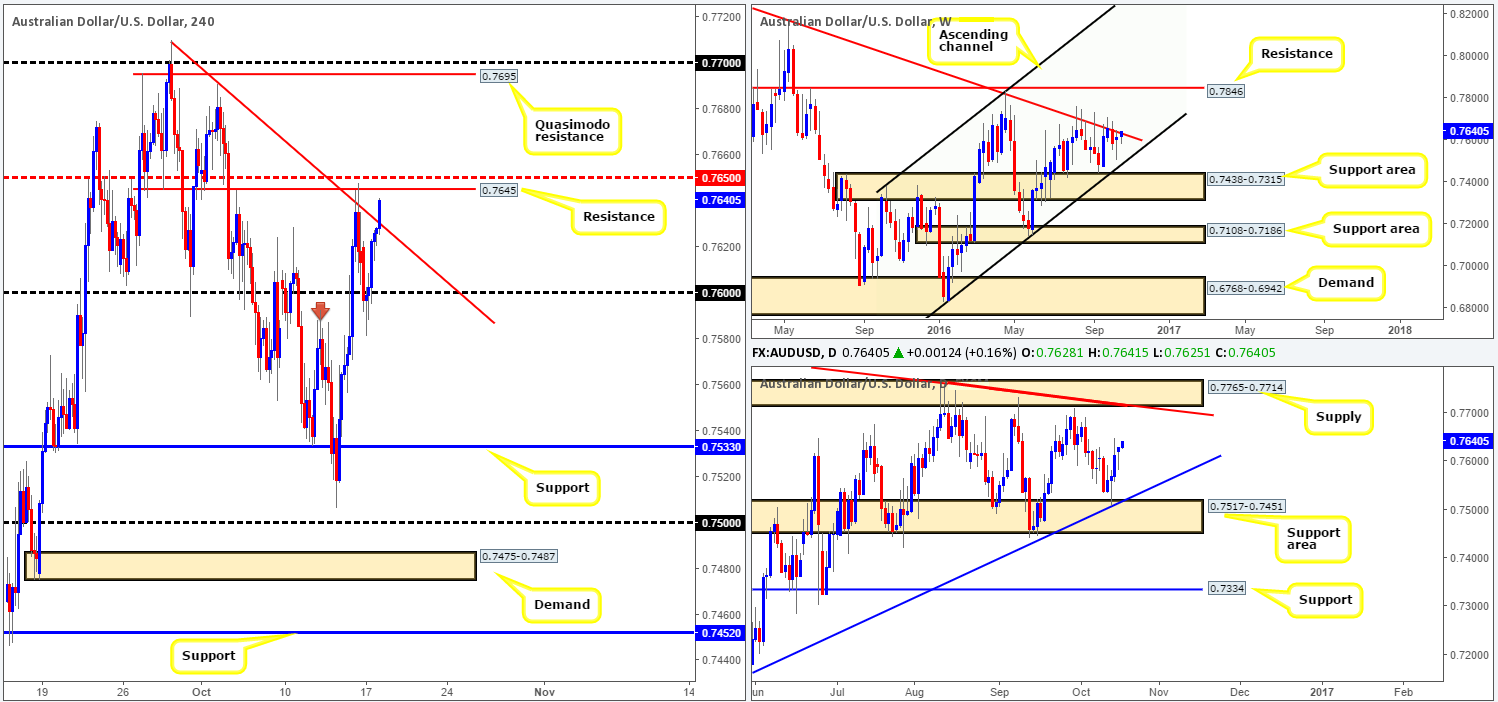
AUD/USD:
The Aussie rose against a generally weaker dollar yesterday, following a whipsaw through the 0.76 handle and a test of the recently broken highs (now acting support [red arrow]) at 0.7587 around the London open. Price continued to rally as we entered into the US segment, and, as you can see from the H4 chart, has just recently broke above a trendline resistance extended from the high 0.7713.
With price nearing a H4 resistance level seen at 0.7645, backed by a H4 mid-way line coming in at 0.7650, what’s the most likely scenario for the commodity currency today? Well, the above said H4 resistance is a proven level, in our opinion, and seeing as how it’s positioned nearby a weekly trendline resistance (0.8295), we feel the bulls will struggle to push beyond this region today.
Our suggestions: Technically speaking, the above noted H4 resistance level is a high-probability zone for a bounce. Be that as it may, the daily candles show price trading mid-range between a supply seen at 0.7765-0.7714 and a support area at 0.7517-0.7451, thus we could potentially see the Aussie rally despite the weekly structure in place (see above). Therefore, for us to become sellers from 0.7645, a H4 bearish close would need to be seen beforehand.
Data points to consider today are the RBA minutes (set to be released in 30 or so minutes), which provide market participants a detailed record of the reserve board’s most recent meeting regarding interest-rate policy, and also US CPI data at 12.30pm GMT.
Levels to watch/live orders:
- Buys: Flat (Stop loss: N/A).
- Sells: 0.7650/0.7645 ([H4 bearish close required] Stop loss: ideally beyond the trigger candle).
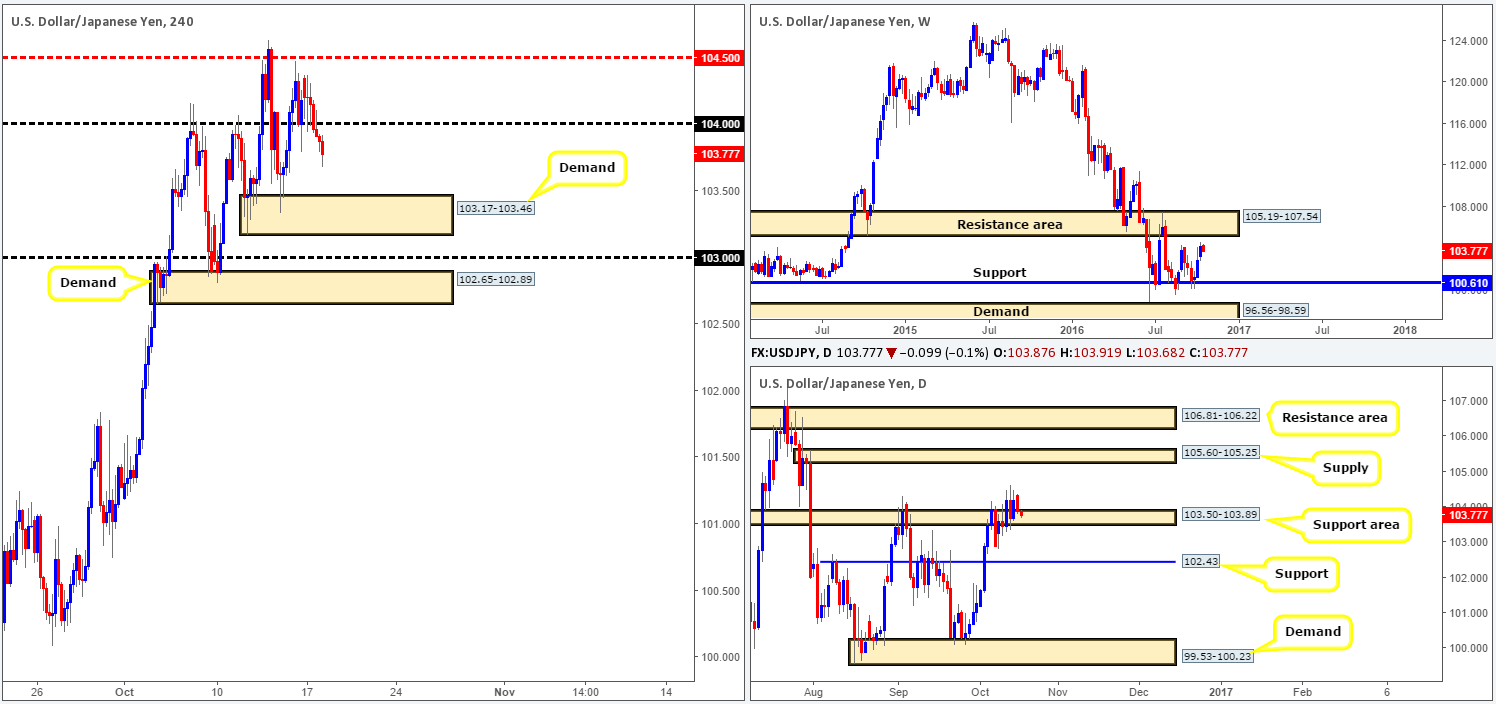
USD/JPY:
Following Sunday’s gap higher, the H4 candles failed to sustain this momentum and turned red. Mid-way through the London session, the pair broke through bids at the 104 handle and shortly after retested it as resistance. As US traders entered the fight, further selling was seen, eventually bringing price down to lows of 103.79. As we write, we see no reason, at least from a technical standpoint, why the unit will not continue selling off down to H4 demand coming in at 103.17-103.46.
Over on the daily chart, we can see that price is currently retesting a daily support area drawn from 103.50-103.89. The other key thing to note here is that the above mentioned H4 demand area sits directly below this daily zone. Looking up to the weekly chart, we still believe that the buyers will push this market north to test the underside of a nearby resistance area coming in at 105.19-107.54, following its recent breach of highs chalked up on the 29/08 around the 104.32ish range.
Our suggestions: Given the above factors our attention will mostly be driven toward looking for lower timeframe long entries (see the top of this report) within the H4 demand mentioned above at 103.17-103.46. The reason we require confirming action from the lower timeframes is simply in attempt to avoid the possibility of getting stopped out on a whipsaw down to 103 handle. In addition to this, do keep in mind that we have US CPI data at 12.30pm GMT today.
Levels to watch/live orders:
- Buys: 103.17-103.46 ([lower timeframe confirmation required] Stop loss: dependent on where one confirms this area).
- Sells: Flat (Stop loss: N/A).
USD/CAD:
Kicking this morning’s analysis off with a look at the weekly timeframe, we can see that the sellers are beginning to make some noise within the supply zone at 1.3295-1.3017. Should this continue the next downside target can be seen at a trendline support extended from the high 1.1278. In support of further selling, daily action also shows room for the pair to continue driving lower down to at least support penciled in at 1.3029.
For those who read our previous report you may recall us highlighting the H4 trendline resistance extended from the low 1.30 as a probable reversal area. Unfortunately, the rebound from this line printed a strong and rather large H4 bearish candle – much too large to consider an entry. Well done to any of our readers who managed to nail a short from here!
Our suggestions: In view of yesterday’s selloff and recent break through the 1.31 handle, price is now seen teasing the top edge of a H4 broken Quasimodo line (mid-range) at 1.3085. According to the higher timeframes (see above), further selling is likely on the cards, so a long from here is not something we’d recommend. With that in mind, we’re looking for a decisive close below 1.3085 followed up by a retest as resistance. Should this come to fruition along with a H4 bearish candle, we’ll take a short targeting 1.3029: the daily support, followed closely by the key figure 1.30. Nevertheless, you may want to take note that not only do we have US CPI data hitting the wire today at 12.30pm GMT, we also have the Canadian manufacturing sales report being released simultaneously. Therefore, do remain vigilant during this time!
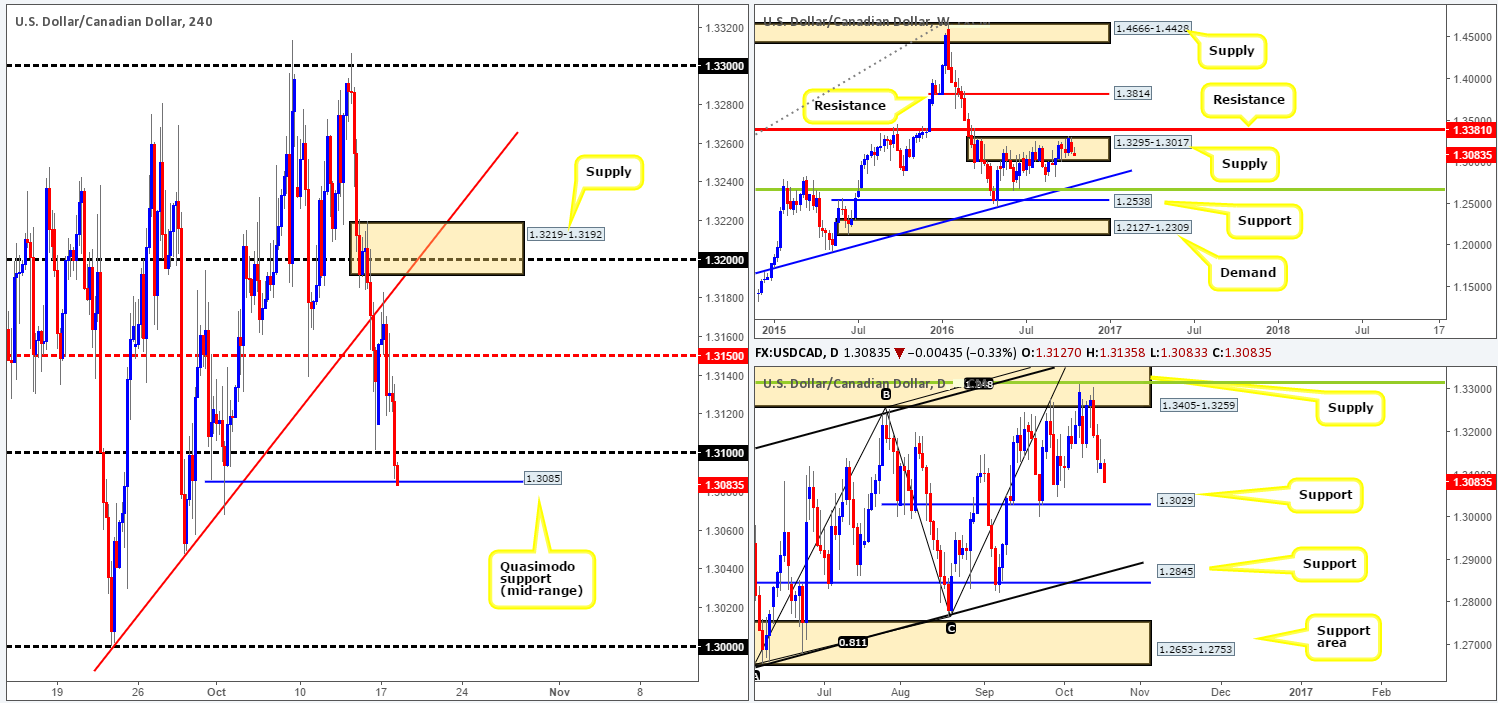
Levels to watch/live orders:
- Buys: Flat (Stop loss: N/A).
- Sells: Watch for a close beyond 1.3085 and look to trade any retest seen thereafter ([H4 bearish close required] Stop loss: ideally beyond the trigger candle).
USD/CHF:
After a brief stint above the 0.99 handle, the US dollar pushed marginally lower against the Swiss Franc during the course of yesterday’s sessions. At the time of writing, the Swissy is seen trading just ahead of a H4 broken Quasimodo level coming in at 0.9863.
Although the H4 candles appear to be entering into a phase of consolidation at the moment between 0.99/0.9863, our team’s focus remains on the Quasimodo resistance level coming in just above 0.99 at 0.9927 (not seen on the chart). This is due to its connection with the underside of both the weekly supply at 0.9928 and daily supply at 0.9921 (see the two green circles).
Our suggestions: In that the USD/CHF remains relatively unchanged as far as structure is concerned, we still have a pending sell order set at 0.9926 with a stop placed above the top edge of daily supply (0.9956) at 0.9960. In the event that order is filled today, we’ll be looking for price to close beyond 0.99 and work its way back down to the aforementioned H4 broken Quasimodo line support. On the date front, keep an eye on US CPI data scheduled for release at 12.30pm GMT.
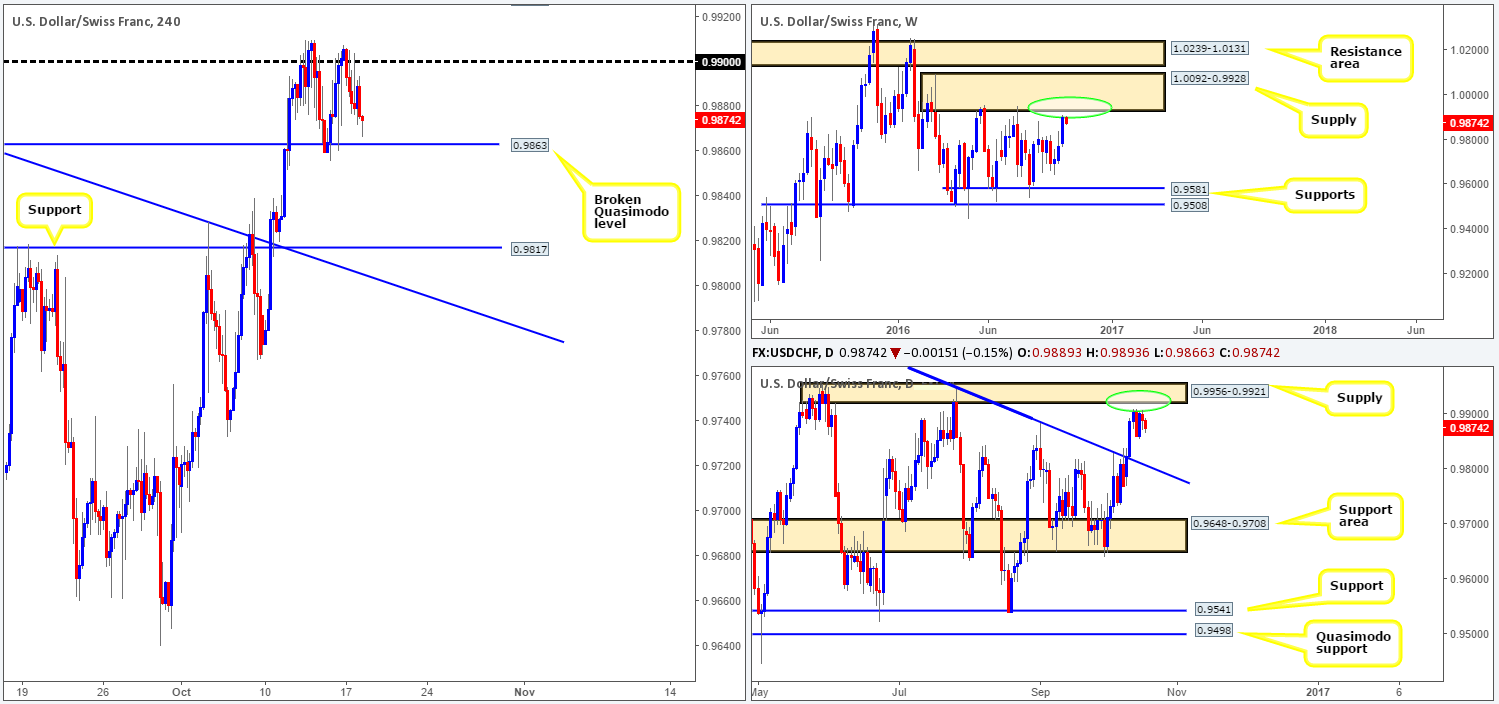
Levels to watch/live orders:
- Buys: Flat (Stop loss: N/A).
- Sells: 0.9926 ([pending order] Stop loss: 0.9960).
DOW 30:
The equity market struggled to find its feet during the course of yesterday’s sessions. It was only when we saw the index strike the H4 support boundary at 18066 amid the US afternoon segment, did price begin show bullish tendencies. Although the bulls have defended this zone, we still feel the more attractive area is seen below at 17999: a H4 Quasimodo support. This is simply because it fuses with nearby weekly support at 17977 and also the daily broken Quasimodo line at 18018. Despite this, should the DOW continue to advance today, the next area likely on the hit list is the H4 trendline resistance taken from the low 17959.
Our suggestions: As far as our team is concerned, the only areas we have interest in at the moment is the above noted H4 Quasimodo support and the H4 resistance area at 18321-18349. This resistance zone houses a daily resistance level at 18322 and is located just below weekly resistance at 18365.
However, to avoid being stopped out by a whipsaw, we’d recommend waiting for a H4 close to take shape at both areas highlighted in bold prior to risking capital.
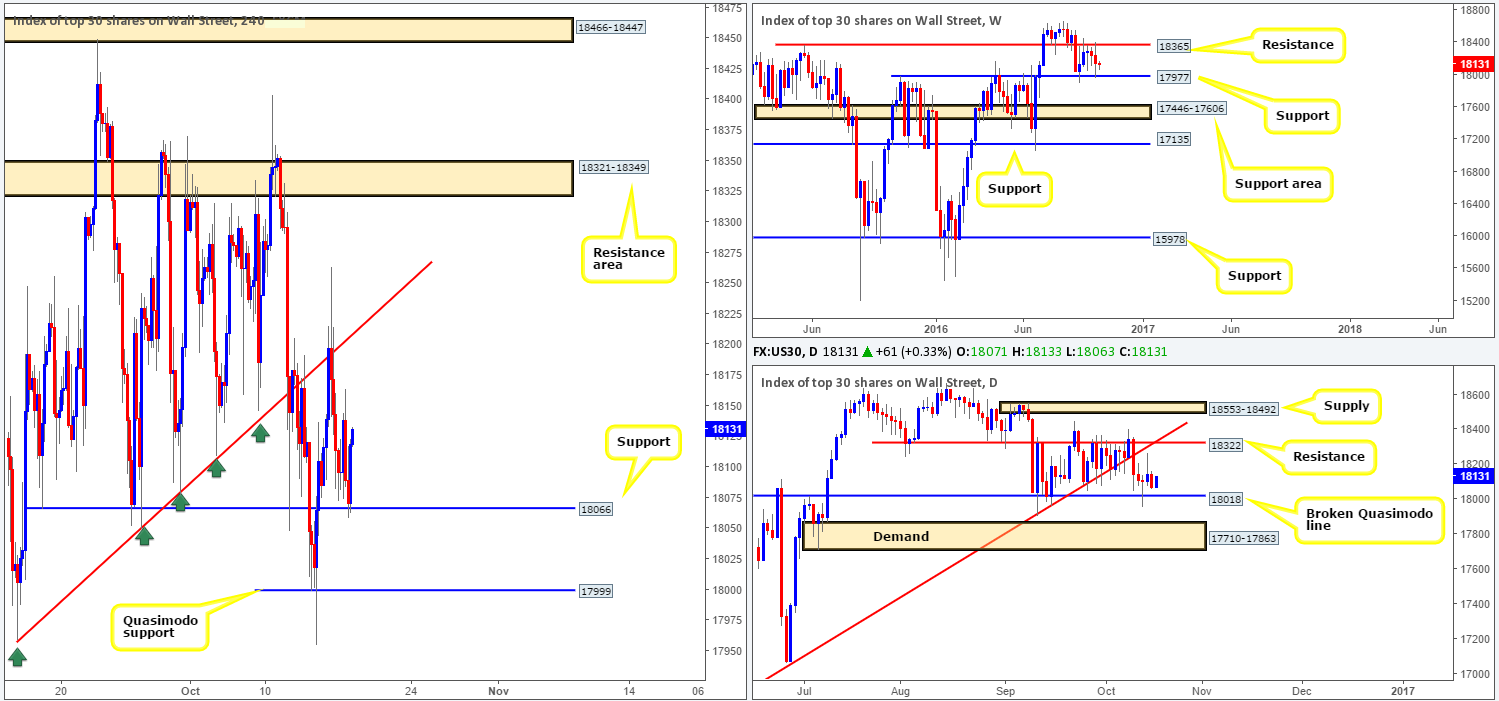
Levels to watch/live orders:
- Buys: 17999 ([H4 bullish candle required prior to pulling the trigger] Stop loss: ideally beyond the trigger candle).
- Sells: 18321-18349 ([H4 bearish close required prior to pulling the trigger] Stop loss: ideally beyond the trigger candle).
GOLD:
Recent action shows that the yellow metal extended its bounce north from H4 support at 1249.7 to a current high of 1260.2. While this move is effectively bolstered by a daily demand zone registered at 1234.6-1244.9, there is a lot of wood to chop through seen between the (H4) 1261.0/1258.0ish region (green circle), followed by a nearby H4 supply sitting at 1268.1-1265.0. It is also worth noting that gold’s weekly action took out a major support area at 1307.4-1280.0 (now acting resistance) two weeks ago and has potentially set the stage for a continuation move south down to the support area logged in at 1205.6-1181.2, which happens to converge nicely with two trendline supports (1130.1/1071.2).
Our suggestions: To become buyers in this market, we’d need to see the H4 supply zone at 1277.1-1272.4 taken out. However, this still would be considered a risky buy as by that point price would be trading within striking distance of the weekly resistance area at 1307.4-1280.0.
In regard to selling, we’d require price to close below the H4 demand base seen at 1234.6-1241.3, which sits within the current daily demand area mentioned above. A close below this region would likely open the doors down to daily demand at 1206.8-1217.5 (sits just above the weekly support area at 1205.6-1181.2).
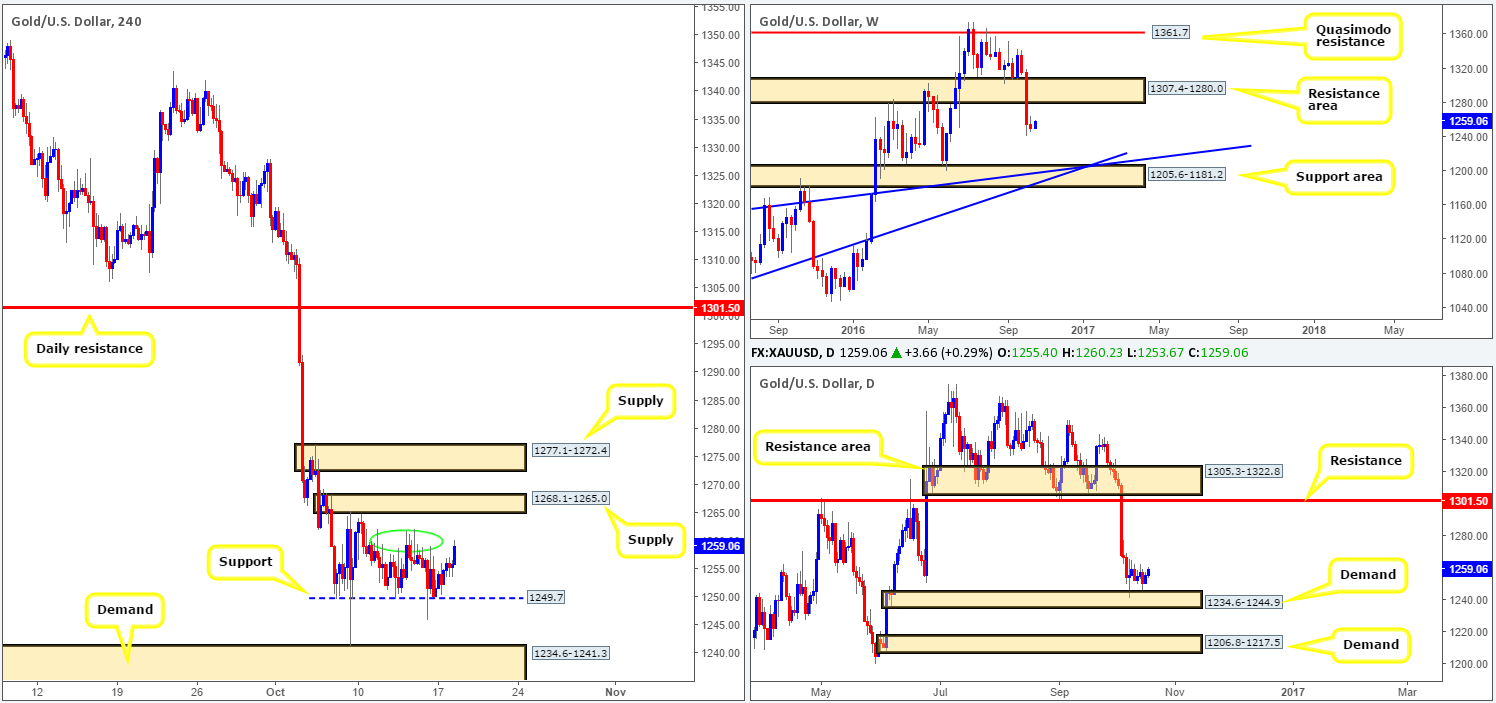
Levels to watch/live orders:
- Buys: Flat (Stop loss: N/A).
- Sells: Flat (Stop loss: N/A).


