
EUR/USD:
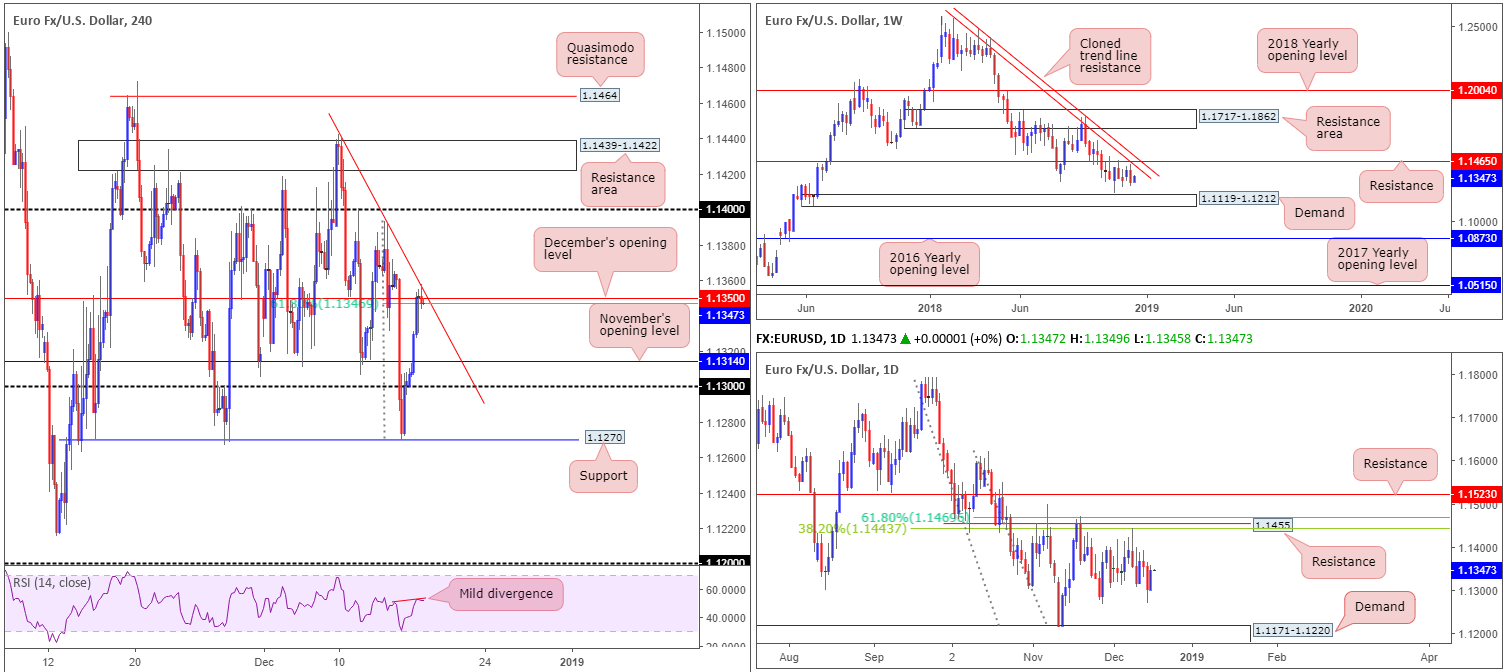
EUR/USD bulls went on the offensive Monday, strengthened by a fading US dollar on the back of significantly weaker-than-expected Empire State manufacturing and NAHB indices, as well as US President Trump renewing his criticism on the Federal Reserve.
up 0.42% on the day, the H4 candles overthrew November’s opening level at 1.1314 and concluded the day shaking hands with December’s opening level at 1.1350, which happens to merge closely with a rather steep trend line resistance (extended from the high 1.1442) and a 61.8% Fibonacci resistance value at 1.1347. In addition to this, it might also be worth noting the RSI indicator is printing a mild divergence reading.
Aside from H4 confluence positioned around 1.1350, higher-timeframe action displays limited resistance around this area. In fact, the next obvious area of resistance on the bigger picture does not emerge until we reach 1.1450+. In terms of the weekly timeframe, we have resistance priced in at 1.1465 that brings with it a nearby cloned trend line resistance (extended from the high 1.2413). Daily movement, on the other hand, shows resistance circulating around the 1.1455 region, which happens to closely converge with two Fibonacci resistances: a 61.8% and a 38.2% at 1.1469 and 1.1443, respectively.
Areas of consideration:
As far as we can see, there’s equal opportunity to trade this market both long and short today.
Having seen limited higher-timeframe involvement around December’s opening level at 1.1350 on the H4 timeframe, traders are urged to employ a cautious stance, despite local confluence. Should the H4 candles chalk up a reasonably well-defined bearish candlestick configuration (entry/stop parameters can be defined according to this pattern), a short from this neighbourhood could be an option, targeting November’s opening level at 1.1314 as an initial take-profit zone, followed closely by the 1.13 handle.
In the event we head for higher ground today and firmly print a H4 close above 1.1350, however, a long opportunity on any retest of 1.1350 as support (preferably in the shape of a bullish candlestick pattern as this helps avoid an unnecessary loss and also provides entry/stop levels to work with) could be in the offing, targeting 1.14 as the initial port of call.
Today’s data points: German Ifo Business Climate; US Building Permits and Housing Starts.
GBP/USD:
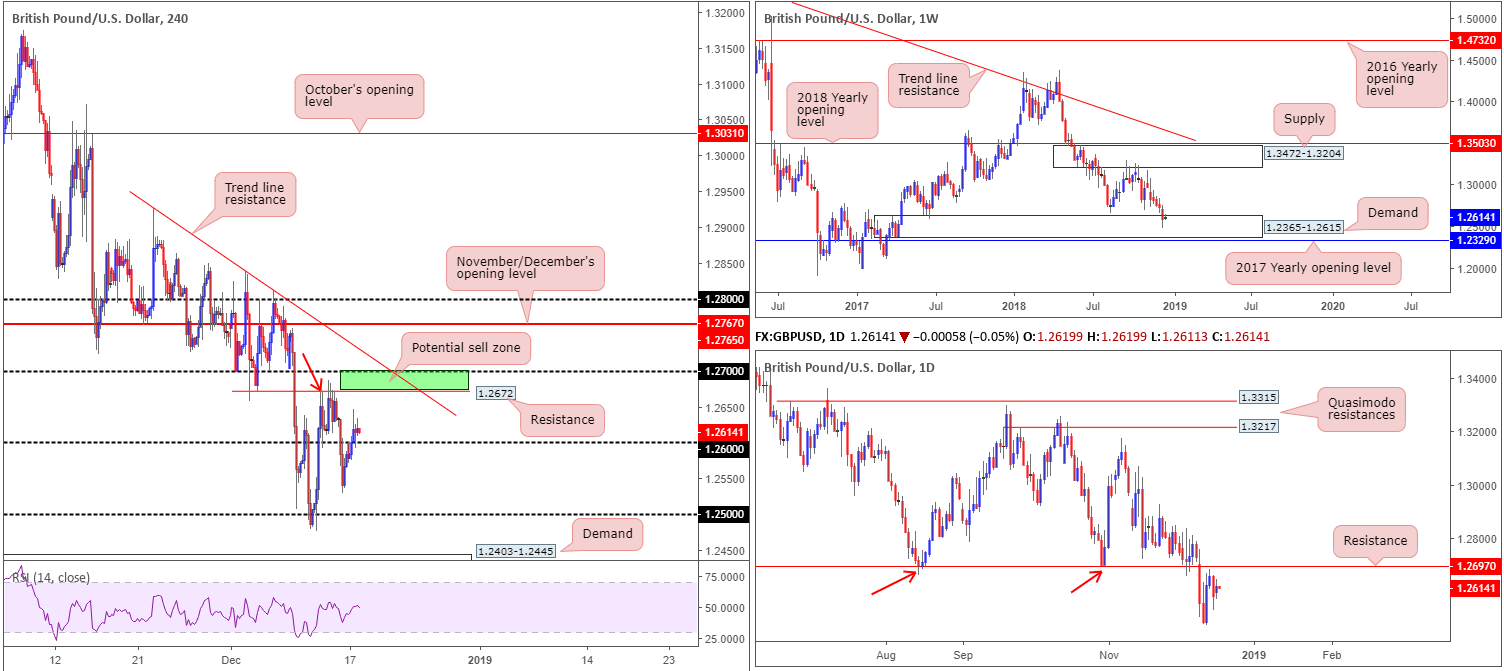
In recent sessions, the market witnessed a half-hearted close above 1.26 form on the H4 timeframe. While technically this is considered a bullish indication, the British pound remains fragile amid reports Labour Party leader Corbyn will call for a no confidence motion in PM May. This – coupled with a waning US dollar and PM May’s statement to the commons Monday reiterating the current deal is the only deal – weighed on buyer enthusiasm.
If 1.26 holds as support today, H4 resistance priced in at 1.2672 is the next hurdle in the firing range, shadowed closely by the 1.27 handle. Note 1.2672 also represents a Quasimodo resistance (red arrow). Also eye catching around the 1.27 neighbourhood is daily resistance coming in at 1.2697. Not only does this barrier hold significant history, room to push lower from here is seen towards support drawn from 1.2374 (not visible on the screen).
On the other side of the field, nevertheless, weekly buyers and sellers are seen battling for position within the upper limits of demand at 1.2365-1.2615. While the current demand may offer some respite this week, traders might want to pencil in the possibility of a fakeout through this area to bring in buyers from 1.2329: the 2017 yearly opening level.
Areas of consideration:
In regard to the higher timeframes the current trend remains clear: DOWN.
However, with respect to higher-timeframe structure, conflicting signals are present: we have weekly price trading from demand, though at the same time we also have daily price languishing just south of resistance.
Despite the above, the research team notes two possible scenarios:
- A long at current price, targeting 1.2672. Recent H4 candles witnessed a bullish pin-bar formation retest 1.26 as support. This, given we’re coming from weekly demand, could be enough to draw in buyers. As for stop-loss orders, beyond the pin-bar candlestick’s tail (1.2592) is an option.
- A bounce from 1.27/1.2672 (green) on the H4 timeframe is also something to consider, knowing it fuses with daily resistance highlighted above at 1.2697. By entering into a short from here, though, you’ll be selling against possible buying out of weekly demand. For that reason, traders are urged to only enter on the back of additional candlestick confirmation (entry/stop parameters can be defined according to this pattern), and reduce risk to breakeven/take partial profits once/if 1.26 re-enters the fray.
Today’s data points: US Building Permits and Housing Starts.
AUD/USD:
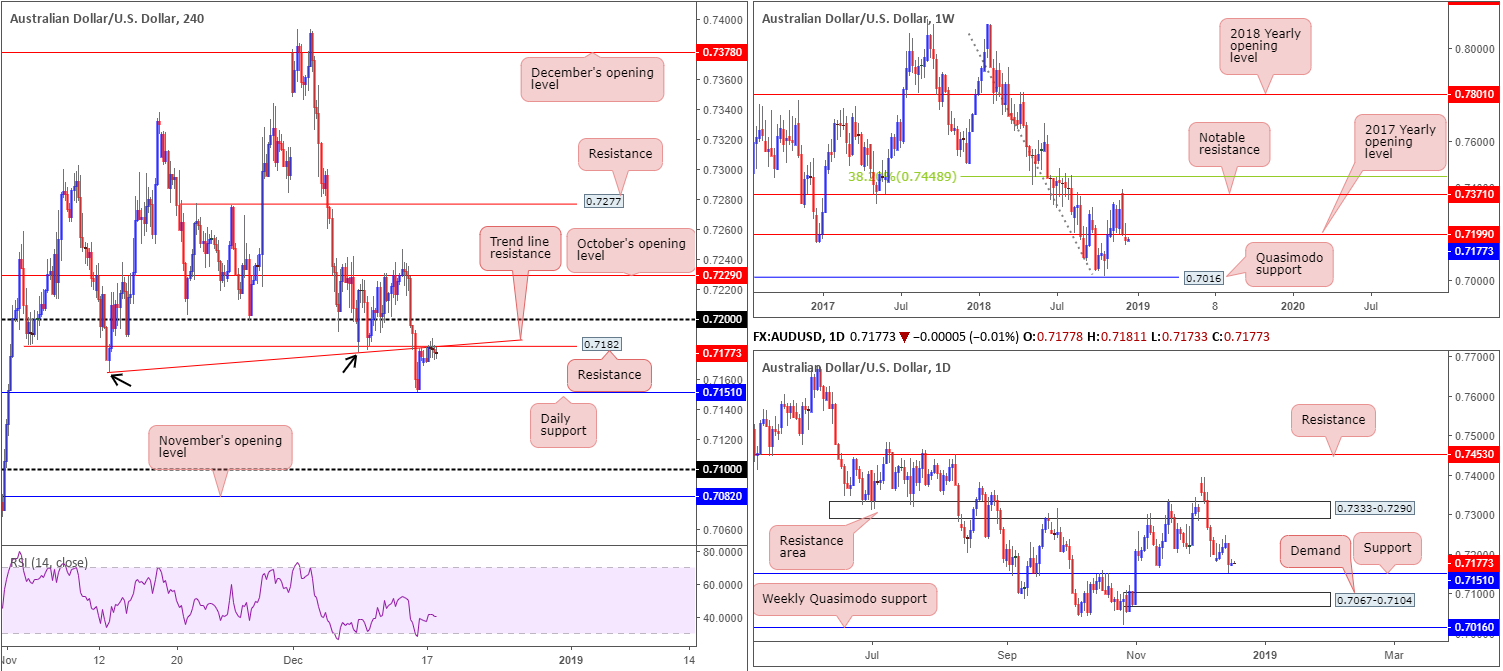
Shaped by several H4 indecision candles around the underside of H4 resistance at 0.7182, AUD/USD movement was incredibly quiet Monday despite a USD selloff, concluding trade +0.09%.
In light of this, much of the following report echoes thoughts put forward in Monday’s briefing…
From the weekly timeframe, upward momentum struggled to regain control of the 2017 yearly opening level at 0.7199 last week, closing in the shape of a bearish pin-bar formation beneath 0.7199. Candlestick enthusiasts will likely be drawn to this pattern this week, particularly given room is seen for the unit to trade as far south as a Quasimodo support priced in at 0.7016.
On closer examination, the research team notes daily price rebounded from support at 0.7151 Friday. Boasting reasonably attractive history, traders might want to consider the possibility of an advance taking shape from here towards a resistance area coming in at 0.7333-0.7290. In the event we do push for lower ground this week, however, as the weekly timeframe suggests, demand at 0.7067-0.7104 is in view.
Areas of consideration:
The retest of 0.7182 as resistance on the H4 timeframe is interesting. Not only because of its convergence with a H4 trend line resistance (extended from the low 0.7164), but also due to the fact weekly price suggests lower levels may be on the cards. The only caveat to this concept, of course, is the daily timeframe seen trading from support.
Should H4 price chalk up a notable bearish candlestick configuration off 0.7182 today (entry/stop parameters can be defined according to this pattern), this would potentially be sufficient enough to draw in sellers and overthrow daily support.
In the matter of take-profit targets from 0.7182, aside from the current daily support at 0.7151, the top edge of daily demand at 0.7104 would be first in line, followed by the 0.71 handle on the H4 timeframe and then November’s opening level drawn from 0.7082. Traders are urged to consider reducing risk to breakeven once/if H4 price closes under the current daily support.
Today’s data points: US Building Permits and Housing Starts.
USD/JPY:
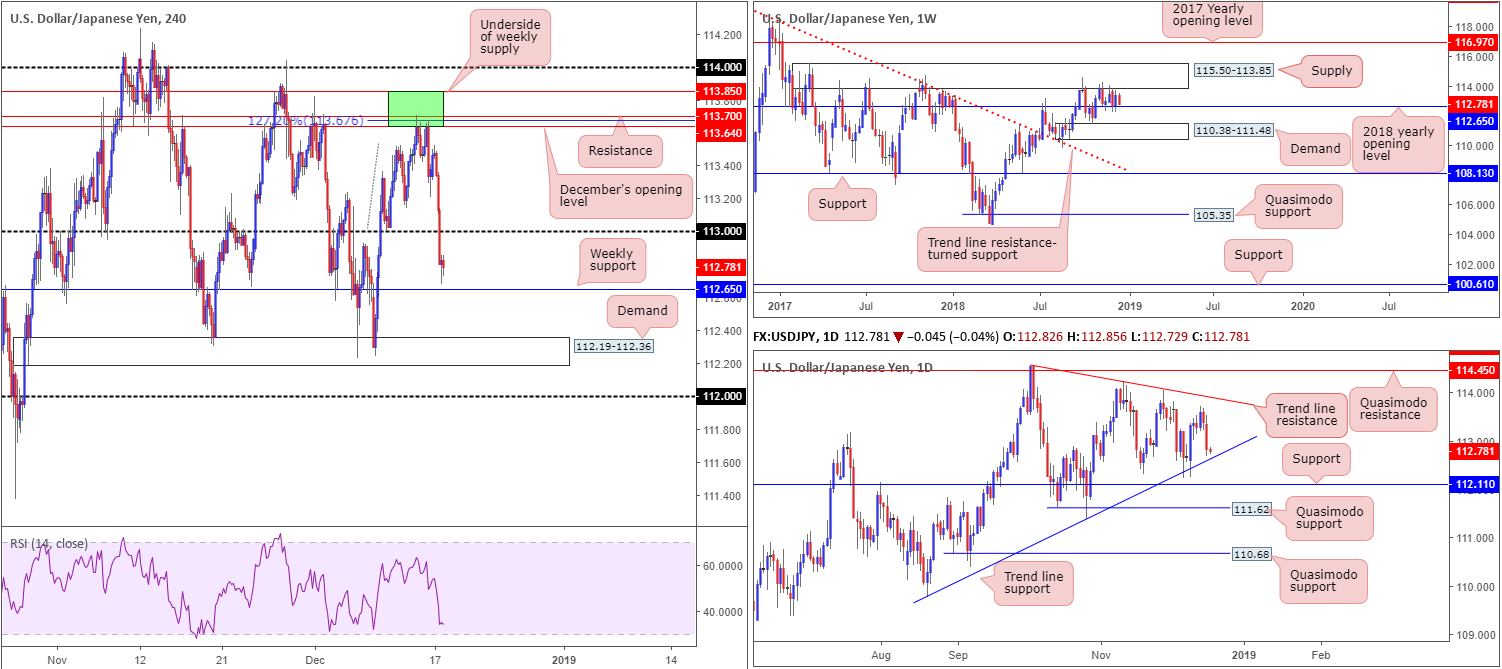
For those who read previous reports on this market you may recall the research team highlighted a nice-looking sell zone on the H4 timeframe (green) at 113.85/113.64. The area consisted of the underside of a weekly supply at 113.85, a H4 resistance level at 113.70, December’s opening level at 113.64 and a H4 AB=CD 127.2% bearish completion at 113.67. Friday’s response from the zone was reasonable, allowing traders to lock in partial profits and reduce risk to breakeven. Well done to those who held their positions over the weekend!
Supported by a slide in equity prices across the globe and US Treasuries dipping lower, the Japanese yen was among the top performers Monday as traders favoured its safe-haven status. H4 action on the USD/JPY, as you can see, ended the day washing through orders at 113 and potentially set the stage for further selling towards demand priced in at 112.19-112.36.
While traders on the H4 are likely expecting further downside to be seen, caution is advised. Higher-timeframe structure reveals support is in the offing. Weekly price is visibly hovering just north of its 2018 yearly opening level at 112.65, while daily movement concluded Monday’s session within striking distance of trend line support (etched from the low 109.77).
Areas of consideration:
The research team notes to expect buying pressure to enter the market around the weekly support 112.65 (the 2018 yearly opening level), as the level converges beautifully with the aforementioned daily trend line support.
Should you consider 112.65 a viable platform for longs this morning, consider waiting and seeing if H4 price chalks up a bullish candlestick formation (entry/stop parameters can be defined according to this pattern) before pulling the trigger, with the underside of 113 being the most logical upside target seen from here. The reason for additional confirmation is to help avoid being whipsawed out of a trade on a fakeout into nearby H4 demand at 112.19-112.36.
Today’s data points: US Building Permits and Housing Starts.
USD/CAD:
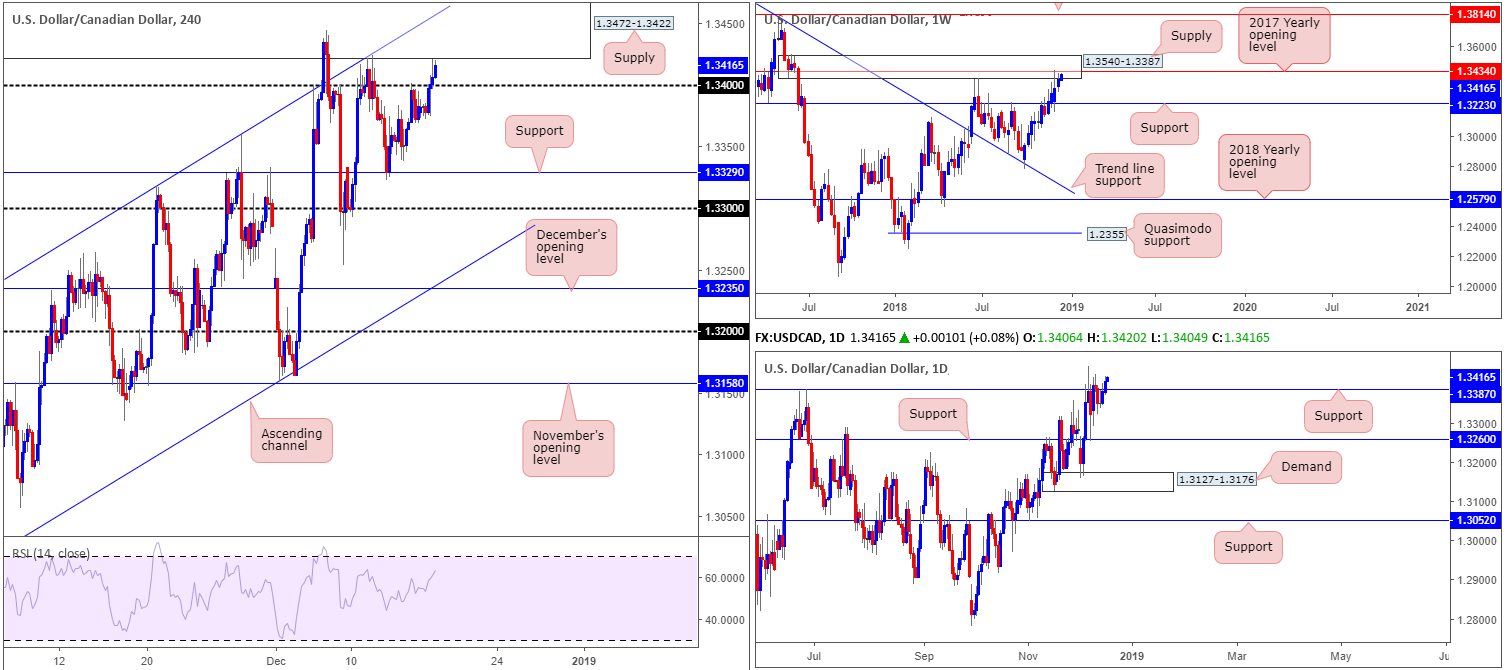
Kicking this market off from the top this morning, weekly supply at 1.3540-1.3387 (houses the 2017 yearly opening level within at 1.3434) remains in the fold. This, as you can probably see from the chart, is a notable supply zone that could eventually prove troublesome for buyers. A move lower from this point will likely target support coming in at 1.3223.
Despite weekly structure, daily flow recently crossed above resistance coming in at 1.3387 (essentially represents the underside of weekly supply). This, by and of itself, possibly unlocks the door towards resistance priced in at 1.3533 (not seen on the screen, though is located within the upper limit of the current weekly supply).
Although the greenback experienced broad-based selling pressure Monday, the USD/CAD managed to remain in positive territory as the Canadian dollar struggled to find demand amid a selloff in oil markets. Although H4 price reclaimed 1.34+ status, though, notably large supply is visible overhead at 1.3472-1.3422.
Areas of consideration:
Neither a long nor short is attractive at this time.
As we have weekly supply in play at 1.3540-1.3387, along with H4 price nearing the underside of a H4 supply residing around 1.3472-1.3422, buying this market, despite daily price suggesting higher levels, is incredibly chancy from a technical perspective.
At the same time, selling this pair, although firmly in agreement with both weekly and H4 structure, nearby support could emerge off 1.34 and also daily support mentioned above at 1.3387.
Today’s data points: US Building Permits and Housing Starts.
USD/CHF:
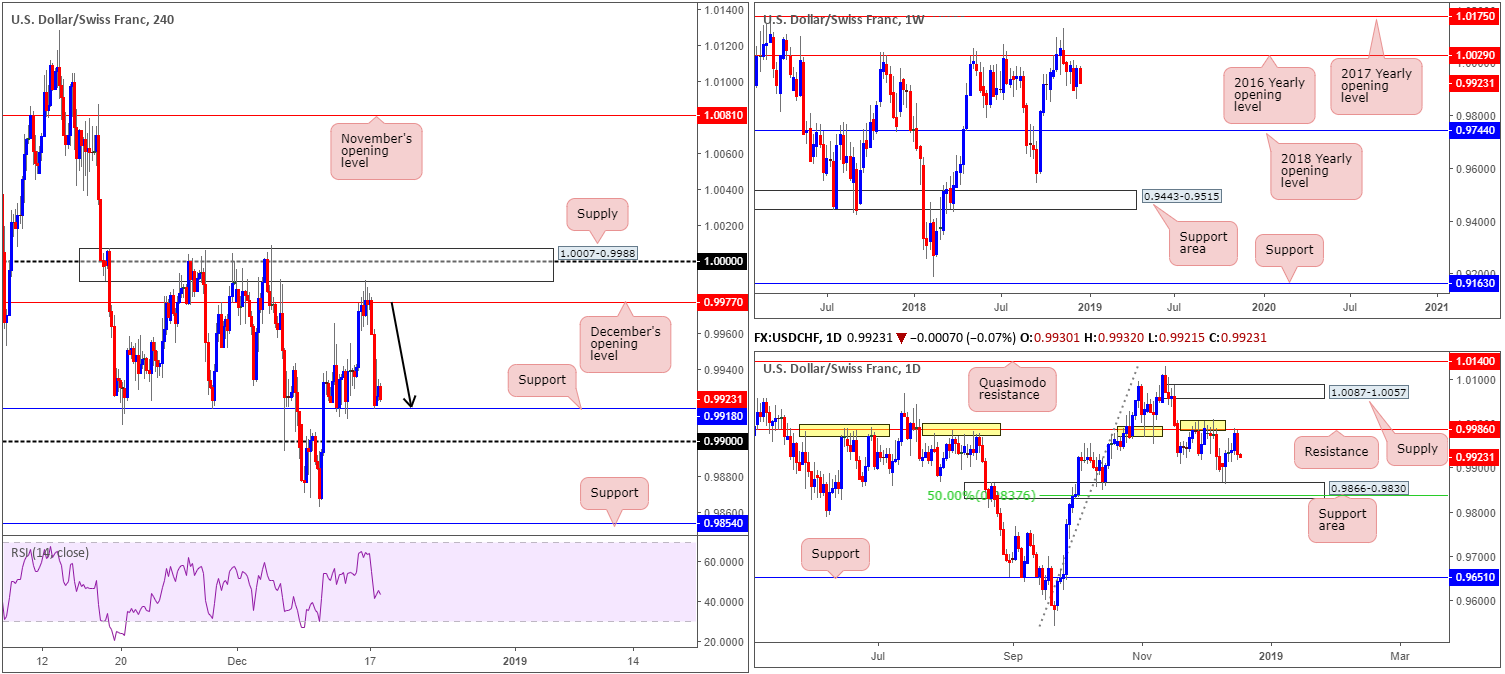
USD/CHF sellers kicked off the week on a high note, forcing the H4 candles lower from December’s opening level priced in at 0.9977. The move was backed by broad-based USD selling and a flight-to-safety boosting demand for the Swiss Franc. For those who read Monday’s briefing you may recall the research team highlighted 0.9977 as a potential sell zone due to the following:
- Strong H4 supply circulating above at 1.0007-0.9988.
- 0000 (parity) housed within the supply zone.
- Daily resistance located at 0.9986. As you can see, this level (yellow) boasts incredibly strong historical significance.
Well done to any of our readers who managed to sell 0.9977 Monday as H4 action struck the first take-profit target: support at 0.9918.
Areas of consideration:
Aside from the short out of 0.9977, further downside, according to the daily timeframe which shows room to stretch as far south as a support area coming in at 0.9866-0.9830, could be on the cards.
The next support target beyond the current H4 support level is the 0.99 handle on the H4 timeframe, followed by the top edge of the aforementioned daily support area at 0.9866.
A H4 close beneath 0.99, therefore, opens up the path to possible intraday shorts, targeting 0.9866, followed by H4 support at 0.9854. It is recommended, however, only to consider positions sub 0.99 that offer at least 1:1 risk/reward ratio to 0.9866, whether that be on a breakout play or on a retest to the underside of 0.99.
Today’s data points: US Building Permits and Housing Starts.
Dow Jones Industrial Average:
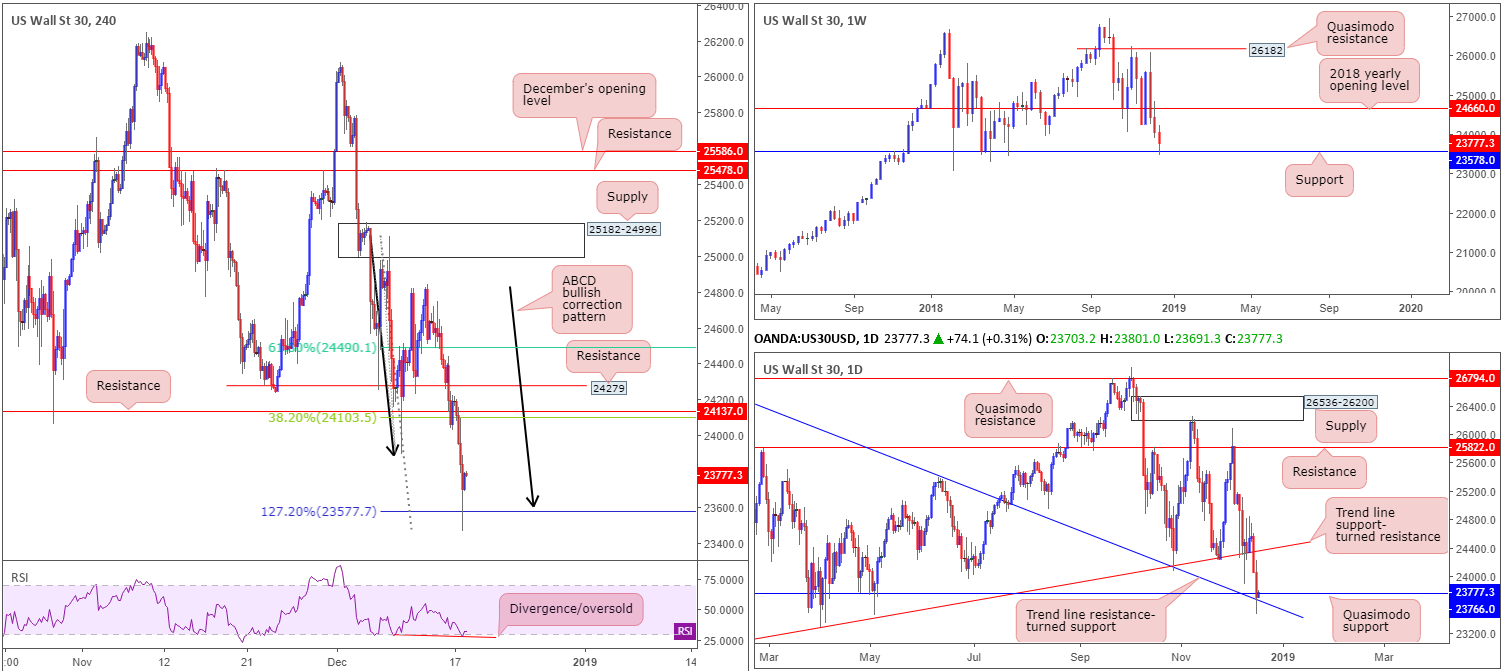
Pressured southbound by the prevailing risk-off mood, the Dow Jones Industrial Average concluded Monday’s segment down 1.49% open/close. Registering its second consecutive daily loss, weekly price recently crossed swords with support carved from 23578. Boasting reasonably sound historical significance, there’s a chance equities may stage a recovery from this point, targeting a possible retest of the 2018 yearly opening level at 24660.
Supporting the notion above, daily movement recently tested Quasimodo support at 23766 that merges with a trend line resistance-turned support (extended from the high 26670). This – coupled with weekly support – could be enough for a recovery play this week. In addition to this, H4 flow completed a nice-looking ABCD 127.2% bullish pattern yesterday at 23577, reinforced by a divergence/oversold reading out of the RSI indicator.
Areas of consideration:
According to our technical studies, all three timeframes suggest an advance may be in the offing, with an initial upside target positioned around H4 resistance at 24137/38.2% H4 Fibonacci resistance at 24103.
Entering long at current price with stop-loss orders positioned beneath yesterday’s low (23465) is certainly an option today. Note this offers more than 1:1 risk/reward ratio to the first upside target.
Today’s data points: US Building Permits and Housing Starts.
XAU/USD (Gold):
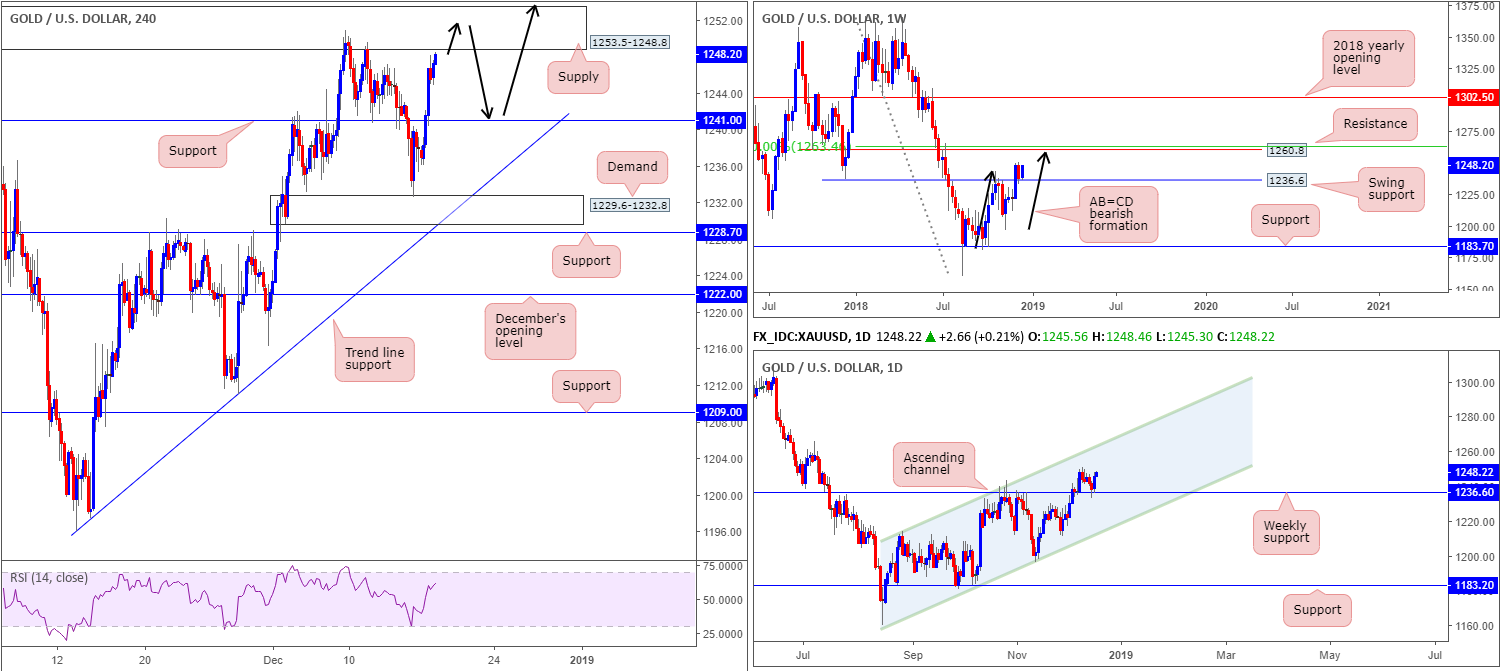
After touching gloves with the top edge of H4 demand at 1229.6-1232.8 Friday, Monday’s sessions extended the rebound in strong fashion, reaching highs of 1248.1. Given the demand area is positioned just south of a clean weekly support level, the rebound from this area should not really come as much of a surprise.
As you can see, recent buying landed the H4 candles within close proximity to a supply zone coming in at 1253.5-1248.8, which held price action lower last week. Should we manage to overthrow this area this week, the next port of call in terms of upside targets fall in around weekly resistance at 1260.8, followed by a daily channel resistance (etched from the high 1214.3). What’s also interesting about 1260.8 from a technical perspective is it converges closely with an AB=CD bearish completion point (black arrows) and a 50.0% resistance value at 1263.4 (green).
Areas of consideration:
Medium-term selling from the current H4 supply is tempting given its performance over the course of last week, though at the same time it is an area that has a number of red flags pinned to it. This is simply due to the fact the higher-timeframe weekly resistance at 1260.8 is hovering above the zone and, therefore, likely to draw in additional buying until we reach the base.
With the above in mind, the research team remain optimistic in this market. One possible scenario is a retest play off H4 resistance-turned support at 1241.0 (black arrows). Should H4 price retest the level in the shape of a bullish candlestick pattern (entry/stop parameters can be defined according to this pattern), this – coupled with both weekly and daily charts exhibiting room to press higher – is likely enough to draw in buyers with an ultimate target placed at the weekly resistance level highlighted above at 1260.8.
The use of the site is agreement that the site is for informational and educational purposes only and does not constitute advice in any form in the furtherance of any trade or trading decisions.
The accuracy, completeness and timeliness of the information contained on this site cannot be guaranteed. IC Markets does not warranty, guarantee or make any representations, or assume any liability with regard to financial results based on the use of the information in the site.
News, views, opinions, recommendations and other information obtained from sources outside of www.icmarkets.com.au, used in this site are believed to be reliable, but we cannot guarantee their accuracy or completeness. All such information is subject to change at any time without notice. IC Markets assumes no responsibility for the content of any linked site. The fact that such links may exist does not indicate approval or endorsement of any material contained on any linked site.
IC Markets is not liable for any harm caused by the transmission, through accessing the services or information on this site, of a computer virus, or other computer code or programming device that might be used to access, delete, damage, disable, disrupt or otherwise impede in any manner, the operation of the site or of any user’s software, hardware, data or property.


