
Key risk events today:
RBA Monetary Policy Meeting Minutes; Australia HPI q/q; German ZEW Economic Sentiment; Canada Manufacturing Sales m/m.
EUR/USD:
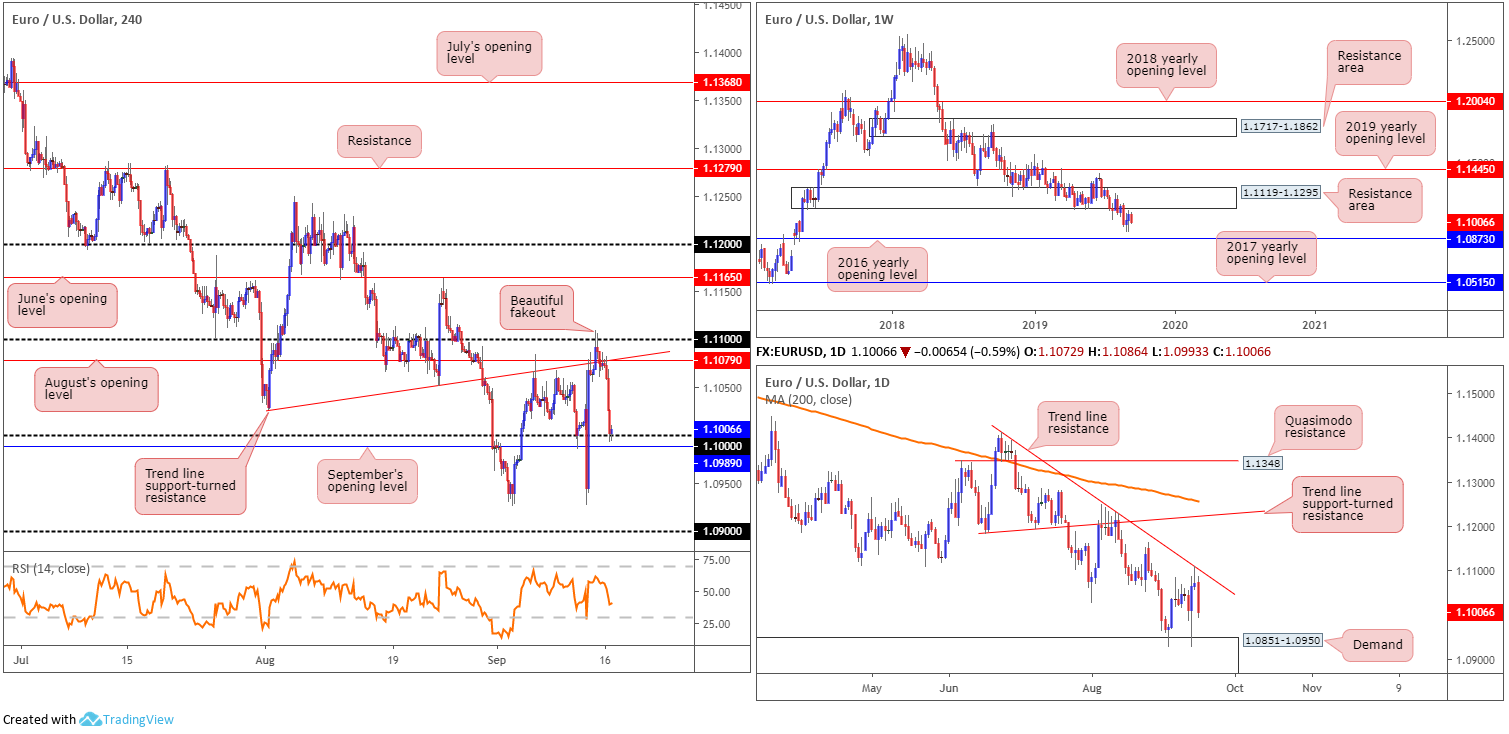
Europe’s single currency kicked off the week swinging into negative territory, erasing more than 60 points, or 0.56% vs. the US dollar. The euro lost out to the dollar on safe-haven grounds after the weekend oil site attacks in Saudi Arabia, aided also by dovish comments from ECB’s Lane who underscored the reasons behind last week’s multi-pronged policy easing.
Wiping out a large portion of last week’s post-European Central Bank (ECB) advance, the H4 candles settled Monday off key figure 1.10, a few points shy of September’s opening level at 1.0989. Traders who read Monday’s report will likely recall the following:
Traders short the fakeout through 1.11 will likely have protective stop-loss orders above the fakeout high 1.1109, and entry at either the 1.1087 H4 candle close or 1.1075. Regardless, the fact we have daily sellers involved (off trend line resistance [see below]), coupled with offered liquidity in the form of buy stops above 1.11, will likely be sufficient to drop price to at least 1.10ish this week, and possibly further, according to higher-timeframe structure.
Well done to any of our readers who managed to hold their short positions.
With respect to higher-timeframe structure, weekly price is turning just south of long-term demand-turned resistance area at 1.1119-1.1295, with the 2016 yearly opening level at 1.0873 fixed as the next downside target. Concerning trend direction, since topping in early 2018 at 1.2555, the long-term trend remains pointing in a southerly bearing.
Last week, according to daily structure, concluded by way of a shooting star formation off the underside of a trend line resistance taken from the high 1.1412 (considered a bearish signal). This was followed through with strong selling yesterday, positioning the unit within striking distance of demand at 1.0851-1.0950 – houses the 2016 yearly opening level inside its lower bounds.
Areas of consideration:
On account of the weekly and daily timeframes, further downside could be in store today/this week, implying 1.10/September’s opening level at 1.0989 on the H4 may give way. The next downside target beyond here is set at the top edge of daily demand coming in at 1.0950, followed possibly by the 1.09 handle.
Therefore, a H4 close south of 1.10 followed up with a retest as resistance, preferably in the shape of a bearish candlestick signal (entry/risk can be determined according to this structure), is considered a strong sell to at least 1.0950.
GBP/USD:
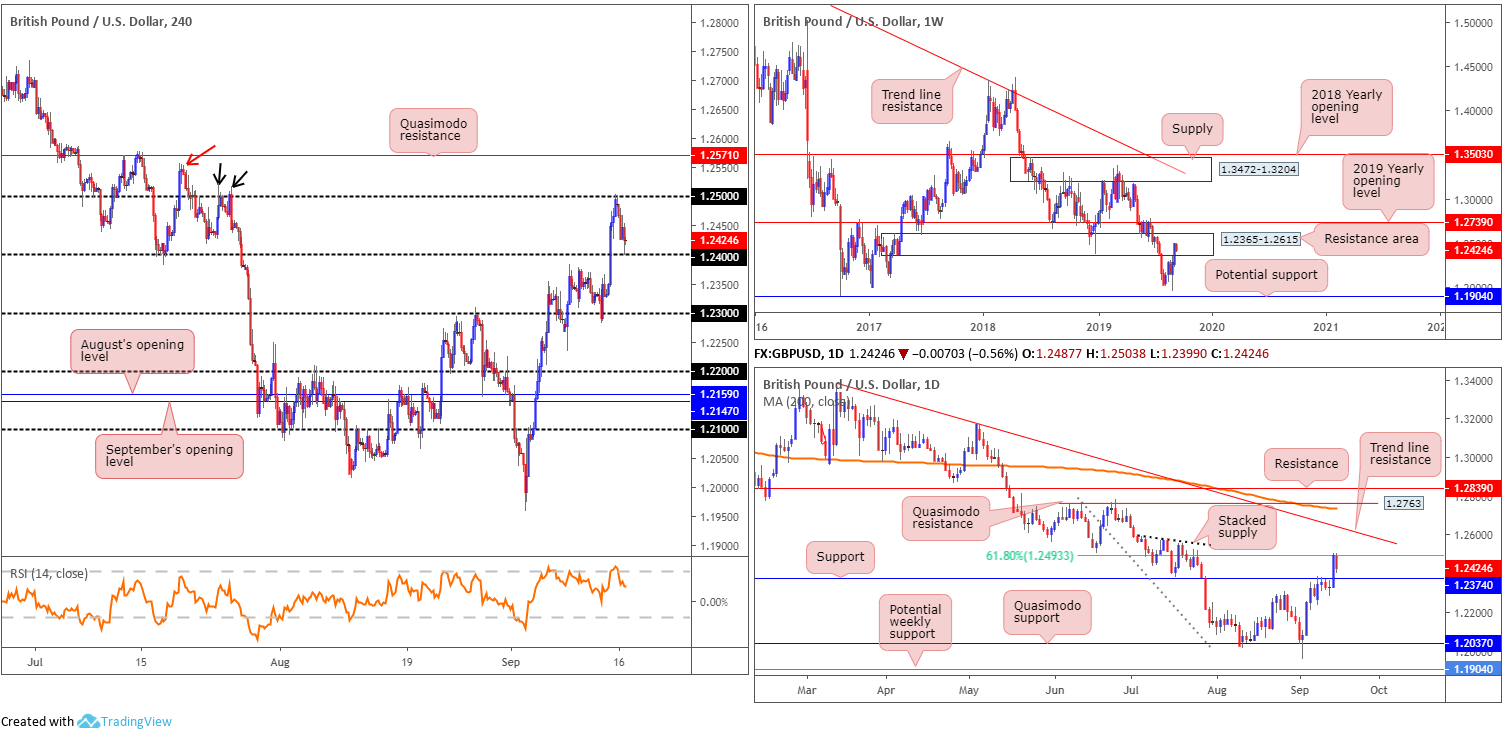
Driven by renewed demand for the US dollar in a risk-averse environment and unpromising Brexit headlines, the British pound gradually depreciated against the buck after losing grip of the 1.25 handle Monday.
Traders who read Monday’s briefing may recall the following:
Shorts from 1.25 are certainly an option today, considering its connection to higher-timeframe resistances. It is recommended, however, that traders consider waiting for additional H4 candlestick confirmation to form before pulling the trigger, as psychological figures are prone to whipsaws/fakeouts. What this does is help identify seller intent and provide entry and risk levels to work with. The first downside target can be found at 1.24, followed by daily support priced in at 1.2374.
1.25’s connection to higher-timeframe structure can be seen in the form of a long-term resistance area coming in at 1.2365-1.2615 and a 61.8% Fibonacci ratio at 1.2493. Monday kicked off the week forming not only a half-hearted shooting star pattern on the H4 off 1.25, but it was also within the range of Friday’s closing candle (an inside candlestick pattern) – both considered bearish signals. Well done to any of our readers who managed to jump aboard the move as price struck the first downside target in recent hours: 1.24.
Areas of consideration:
Traders short 1.25 should have locked in a large portion of their sell at 1.24 and reduced risk to at least breakeven. The next support target, as aired above, is daily support drawn from 1.2374, followed by a potential run towards 1.23 on the H4.
In the event we turn higher this week and revisit 1.25, a break of this figure will possibly unbolt the door to further buying, at least until reaching H4 Quasimodo resistance at 1.2571. For those who want to press this bullish theme, waiting for a retest at 1.25 as support to develop is suggested (entry and risk can be found on the back of the rejecting candle’s structure). Interestingly, the high 1.2558 (red arrow), and the highs set beneath it (black arrows) at 1.2522ish, likely have buy stops plotted above. This may help provide liquidity to also sell the said Quasimodo resistance.
AUD/USD:
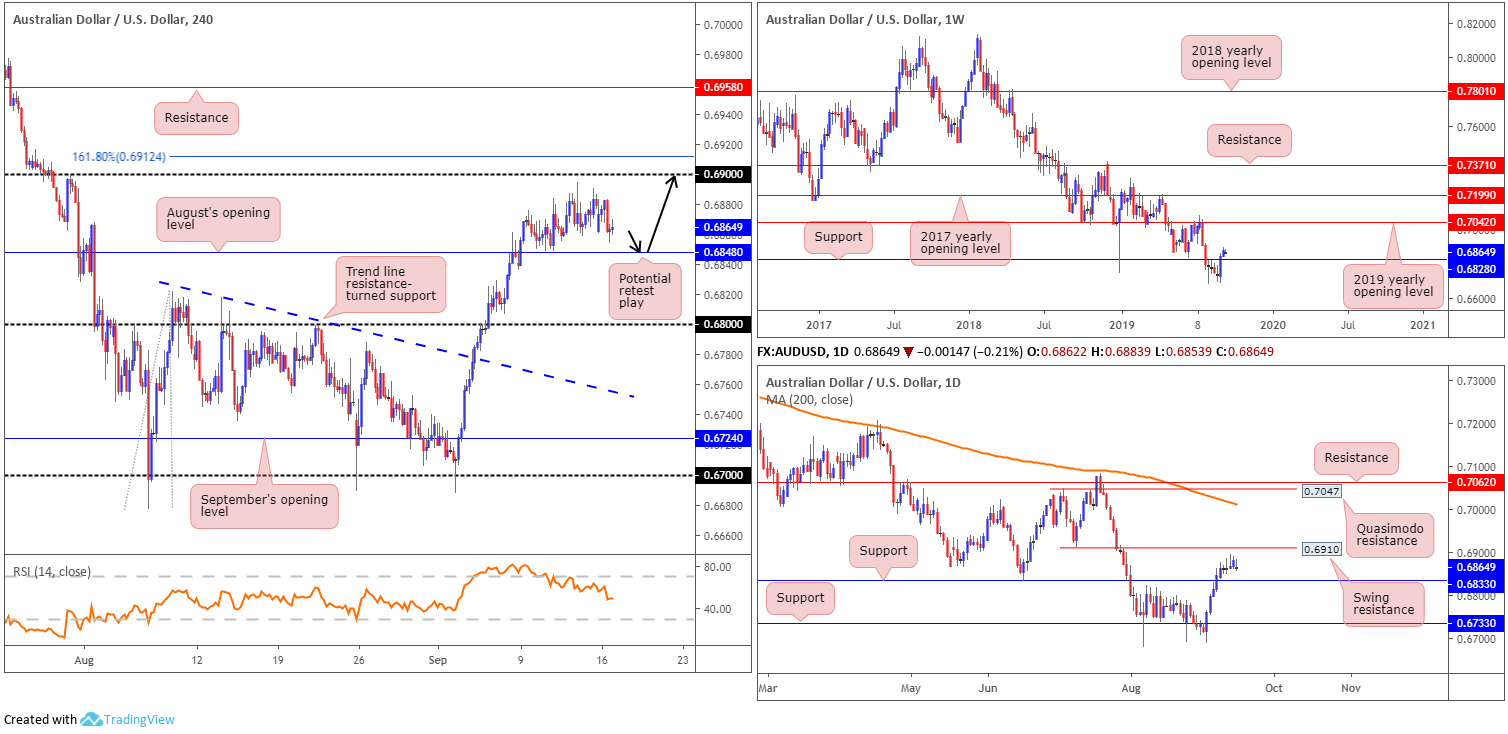
Monday’s risk-off mood benefited the US dollar, guiding flow away from perceived riskier currencies. US/China trade optimism appears to be underpinning China-proxy Aussie, as price continues to hover a few points north of August’s opening level on the H4 timeframe at 0.6848. With upside pointing to 0.69 from current price, closely followed by a 161.8% Fibonacci ext. point at 0.6912, longs remain favoured.
Considering Monday’s action to be somewhat lacklustre, research aired Monday remains in play, according to our chart studies.
From the weekly timeframe:
After staging a healthy comeback in recent weeks, involving the unit reclaiming position above support at 0.6828, further buying materialised last week, consequently posting a modestly healthy gain. If buyers remain in the driving seat, an approach towards the 2019 yearly opening level at 0.7042 is likely on the cards.
Daily perspective:
In conjunction with weekly structure, the daily timeframe also maintained a bullish position north of support at 0.6833. The next upside target on this scale falls in at 0.6910, a swing resistance. However, beyond here the research team has eyes on Quasimodo resistance at 0.7047 and resistance at 0.7062. It might also interest some traders to note the 200-day SMA lurks close by at 0.7011 (orange).
Areas of consideration:
Outlook unchanged.
Considering the bullish theme on the higher timeframes right now, entering long based on a retest at August’s opening level drawn from 0.6848 on the H4 is still the favoured option (black arrows). A retest of this level in the shape of a H4 bullish candlestick signal will likely entice buyers into the market, with eyeballs on 0.69 as the initial upside target, set just beneath daily resistance at 0.6910 and the 161.8% H4 Fibonacci ext. point mentioned above at 0.6912.
Should this trade eventually come to fruition, traders are also urged to take into account the tops formed just south of 0.69 which could house active sellers.
In terms of data, focus shifts to RBA meeting minutes.
USD/JPY:
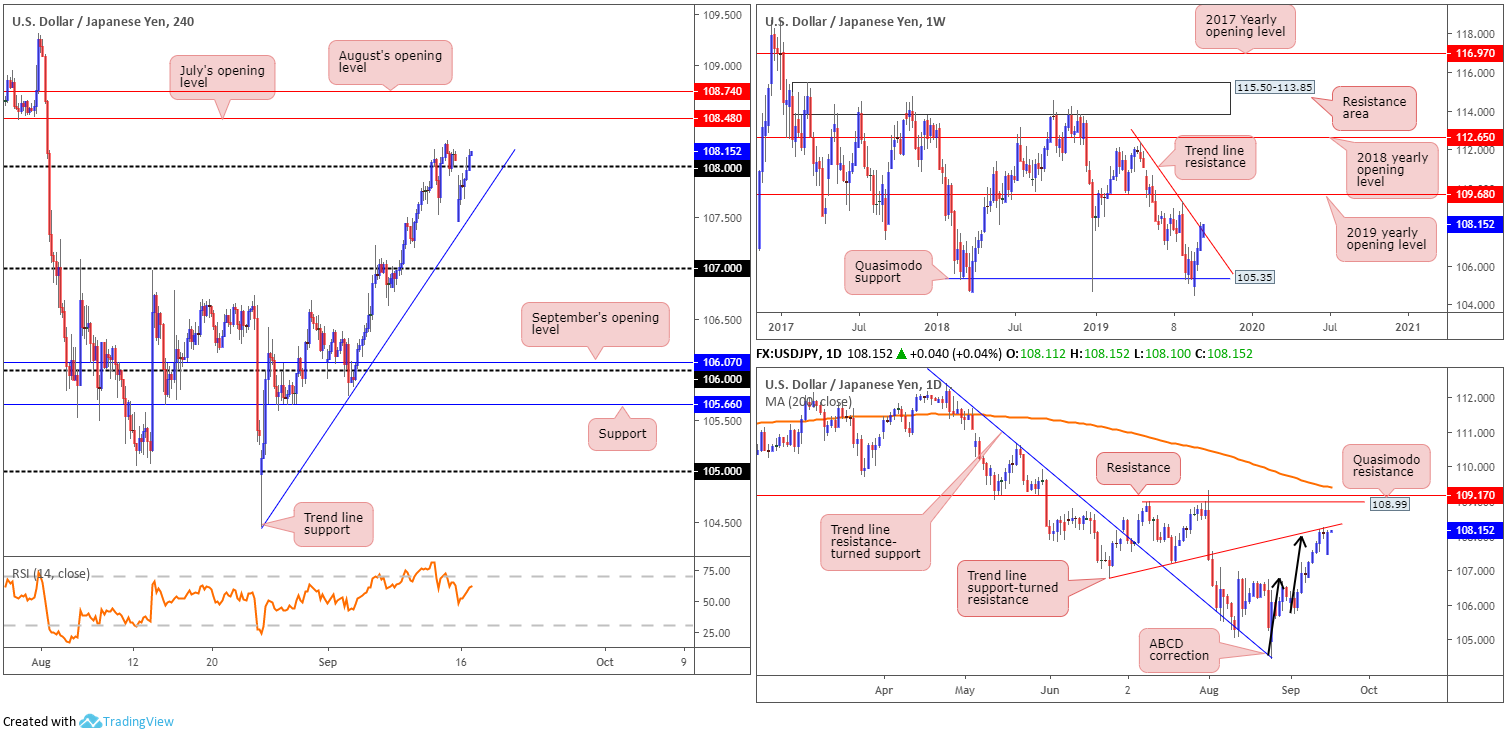
The US dollar opened markedly lower against the Japanese yen Monday, after the weekend oil site attacks in Saudi Arabia prompted a flight-to-safety amid Asia trade. Despite waning US equity markets and US Treasury yields tanking – the 10-year benchmark note fell more than 2.50% – the USD/JPY recovered and filled the opening gap, settling above 108 on the H4 timeframe.
Technically, we have an interesting market at the moment. Weekly flow is seen interacting with a trend line resistance etched from the high 112.40 after staging a recovery from Quasimodo support at 105.35. Additional upside could see the 2019 yearly opening level at 109.68 brought into the mix. The story on the daily timeframe has trade crossing swords with a trend line support-turned resistance (etched from the low 106.78) in the shape of an ABCD correction terminating at 108 (black arrows). Since crossing paths with the said trend line, price action has established little in terms of rejection. In fact, Friday’s candle wrapped up by way of a Doji formation and Monday closed by means of a near-full-bodied bullish candle.
As can be seen from the H4 timeframe, price action is establishing ground above 108, poised to overthrow Friday’s high at 108.25 and approach July’s opening level at 108.48.
Areas of consideration:
Given there’s less than 50 points to play with north of 108 on the H4 timeframe before we reach 108.48, and the fact two trend line resistances remain in motion on the higher timeframes, opting to remain on the sidelines may be the better path to take for now.
USD/CAD:
By all counts, it was a volatile beginning to the week. Despite concluding the prior week a touch south of 1.33, the market kicked off Monday sporting a large downside gap. Geopolitical risk, after the weekend’s attacks on Saudi Aramco facilities, brought itself abruptly into the limelight, with WTI prices surging more than 12% and clocking highs at $63.33/bbl.
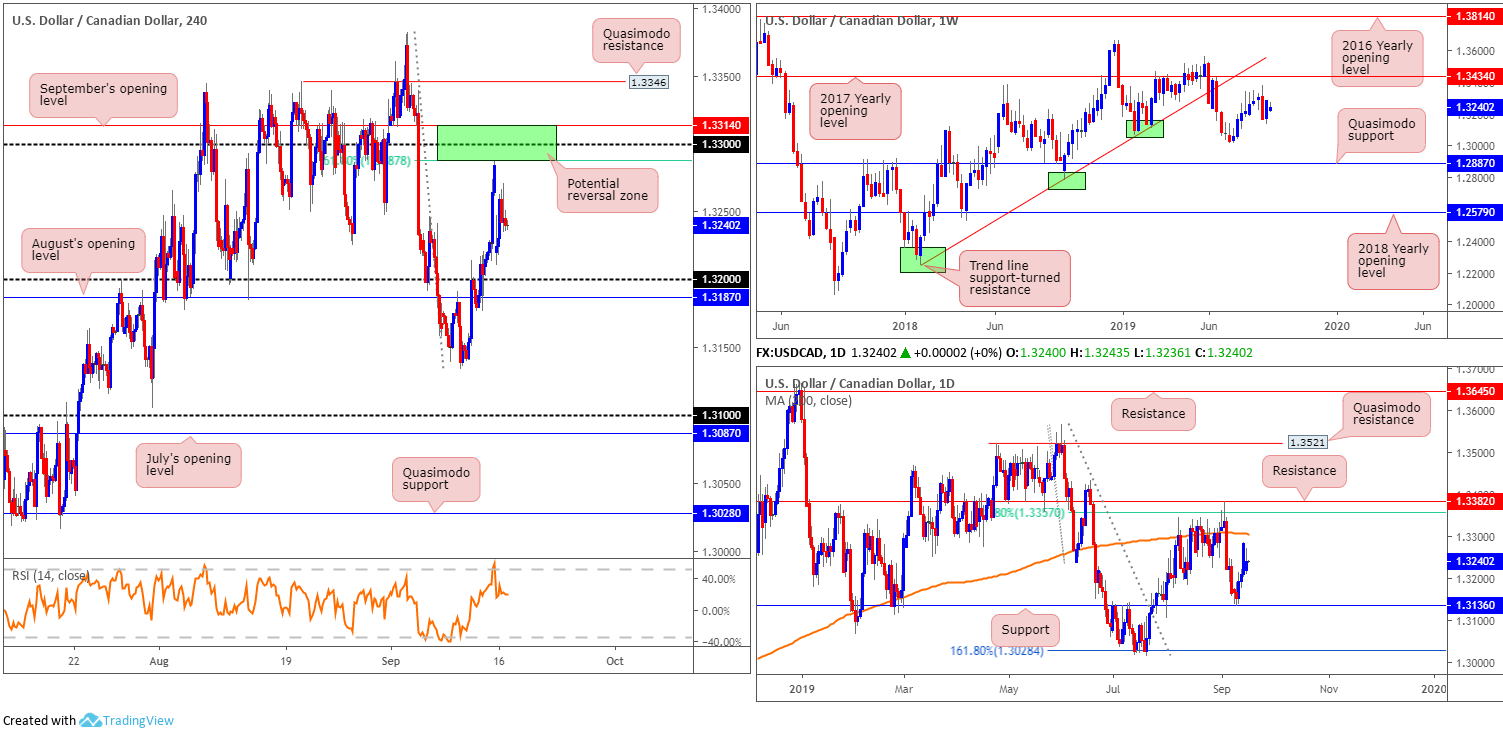
From a technical perspective, the H4 candles trade in no man’s land between 1.33/32 as we head into Asia Pac hours. Bolstering 1.33 we have a 61.8% Fibonacci ratio at 1.3287 and September’s opening level at 1.3314. Just south of 1.32, September’s opening level is seen at 1.3187.
From the weekly timeframe we can see USD/CAD bulls entered an offensive phase last week, consequently correcting a large portion of the prior week’s precipitous decline. Resistance on this timeframe is fixed at the 2017 yearly opening level drawn from 1.3434, closely trailed by a trend line support-turned resistance extended from the low 1.2247. To the downside, nonetheless, we have the 1.3016 July 15 low, followed by Quasimodo support at 1.2887.
Daily price saw the unit dip its toe into a familiar support at 1.3136 last week, which followed through with a bullish engulfing candle Wednesday with additional bidding observed. Resistance in the form of a 200-day SMA (orange) at 1.3307 is now in the offing, tracked by a 61.8% Fibonacci resistance at 1.3357 and resistance at 1.3382.
Areas of consideration:
Outlook unchanged.
The area between September’s opening level at 1.3314, the round number 1.33 and the 61.8% Fibonacci ratio at 1.3287 (1.3314/1.3287) remains a likely zone of interest for sellers this week – even more so knowing we have the 200-day SMA housed within. For traders looking to add a little more confirmation to the mix before engaging, consider waiting for candlestick confirmation to develop. For example, a H4 bearish engulfing formation moulded off the 1.33 handle not only identifies seller intent, it also delivers entry/risk levels to work with. As for downside targets, the 1.32 handle is a logical starting point, followed by August’s opening level at 1.3187.
USD/CHF:
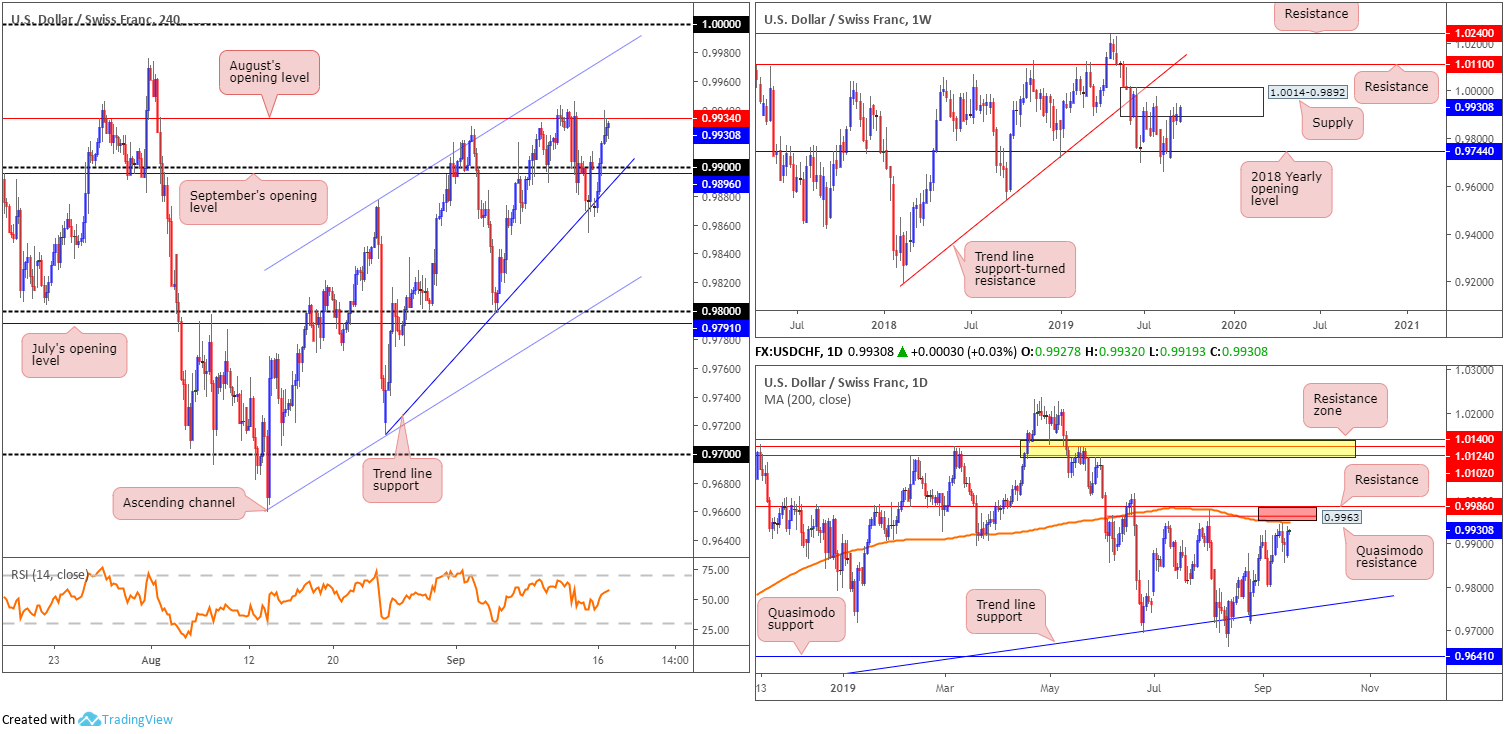
Demand for the safe-haven Swiss franc increased at the beginning of the week, following news of an attack on a Saudi oil facility. USD/CHF gapped lower by 26 points, drawing the pair to lows set a few points shy of Friday’s low at 0.9854. Despite this, things swiftly turned north with the market filling the opening gap, reclaiming 0.99+ status and testing the underside of August’s opening level at 0.9934 on the H4 timeframe.
Daily price, concluding Monday in the form of a bullish engulfing pattern, is now poised to approach a rather interesting area of resistance at 0.9986/0.9953 (Quasimodo resistance at 0.9963, a 200-day SMA [orange – 0.9953] and resistance coming in from 0.9986 [red]).
Despite a lack of seller intent, weekly price, as highlighted in Monday’s weekly report, remains toying with the lower boundary of a familiar supply coming in at 1.0014-0.9892. This is the second time back to the area and, therefore, its strength may be compromised. A rotation lower from here, nevertheless, has the 2018 yearly opening level at 0.9744 in sight. In the event buyers brush aside the said supply (unlikely a straightforward feat but certainly a possibility), resistance at 1.0110 is in view, as is long-term trend line support-turned resistance taken from the low 0.9187.
Areas of consideration:
Outlook unchanged.
The daily resistance area between 0.9986/0.9953 is still open for possible shorting opportunities this week. As emphasised in previous reports, an ideal entry point would be the H4 channel resistance taken from the high 0.9877, as this line intersects with the upper boundary of the said daily zone. A test of the H4 channel area in the shape of a H4 bearish candlestick signal (entry and risk to be set according to this structure) is considered a high-probability setup with the likelihood of a sizeable move occurring from its formation.
Dow Jones Industrial Average:
The Dow Jones Industrial Average snapped an eight-session winning streak Monday, after the weekend oil site attacks in Saudi Arabia. The Dow shed 142.70 points, or 0.52%; the S&P 500 erased 9.43 points, or 0.31% and the tech-heavy Nasdaq 100 declined 40.54 points, or 0.51%.
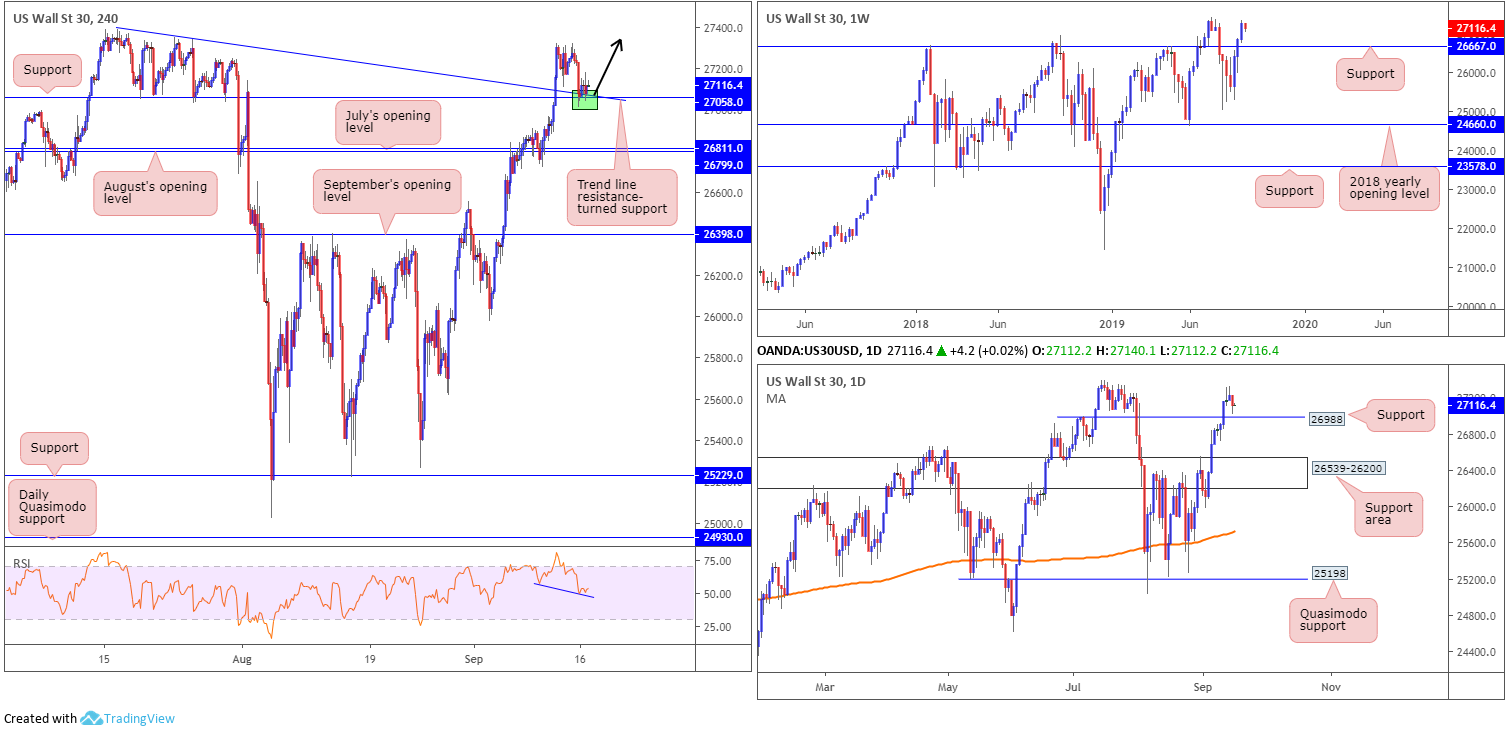
From a technical standpoint, weekly price remains unchanged. US equities notched a third consecutive weekly gain last week, according to the Dow Jones Industrial Average. Adding nearly 400 points, the index settled the week extending its position north of support at 26667 and a short walk from the all-time high 27388.
Daily price, although we pulled back yesterday, also remains unchanged in terms of technical structure. As highlighted in previous reports, the index engulfed Quasimodo resistance at 26988 last week and now serves as possible support. A retest of this barrier may come to fruition before we touch gloves with all-time highs.
With respect to the technical landscape on the H4 scale, last week observed the index overthrow resistance at 27058 (now acting support) and trend line resistance etched from the high 27388. Note this area (green) was retested yesterday and held ground. Interestingly, price action also completed an inside candlestick formation off the said levels, confirmed by hidden divergence on the RSI indicator (blue line), suggesting a move to the upside could be on the cards.
Areas of consideration:
On account of the above, longs remain in favour. A retest at the area between 26988 (the daily support level) and H4 support at 27058 is in motion, with H4 price, via candlestick analysis, portending a move higher. Those who want to press this bullish theme, entry and risk can be set according to the rejecting candlestick’s structure, with a take-profit target fixed at the all-time high underscored above at 27388. For those of more a conservative nature, stop-loss orders can be set beyond daily support at 26988.
XAU/USD (GOLD):
Mounting geopolitical tensions increased the commodity’s safe-haven appeal Monday, following the weekend’s oil site attacks in Saudi Arabia.
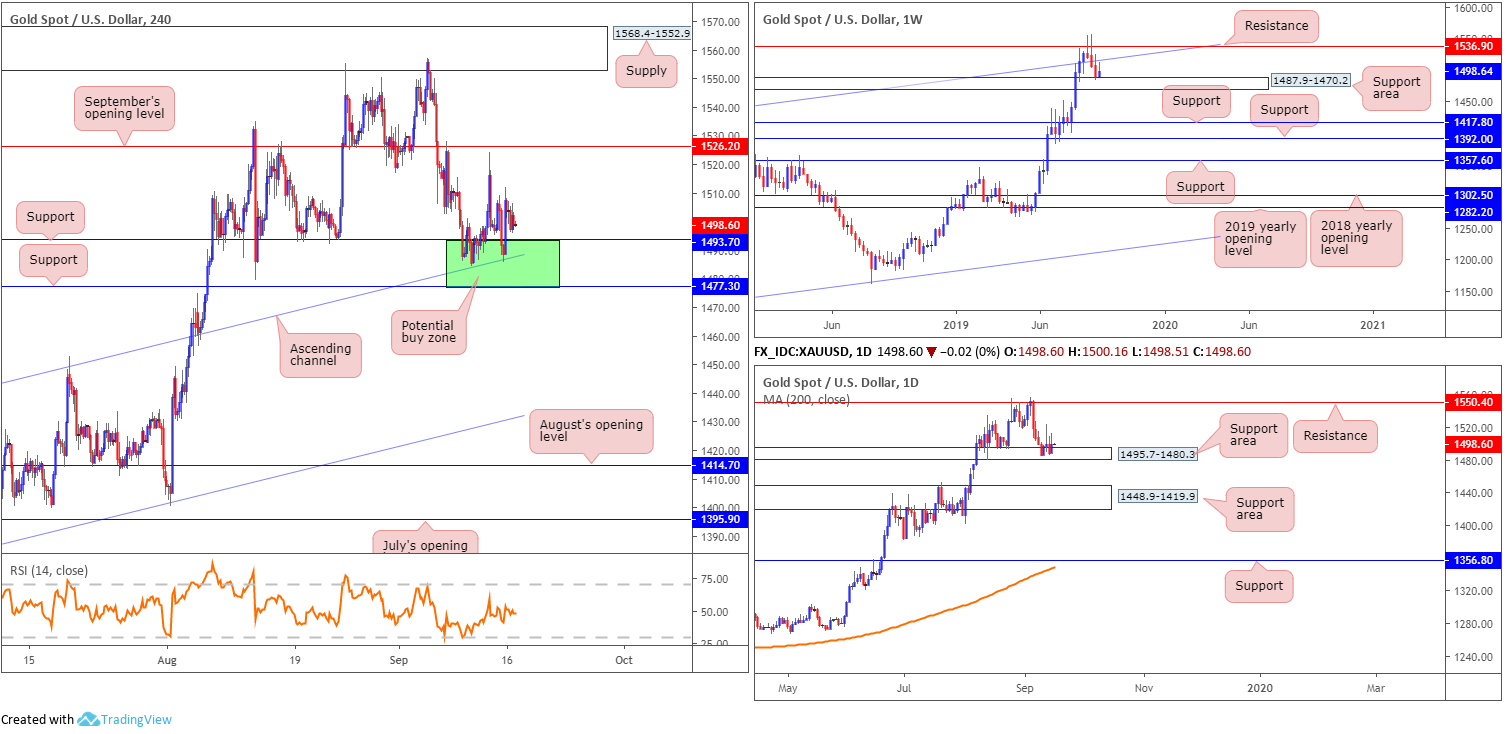
For those who read Monday’s report you may recall the research team highlighted a familiar area of H4 support marked in green at 1477.3/1493.7. Not only does it hold H4 channel support within (pencilled in from the high 1437.7), it merges with a daily support area coming in at 1495.7-1480.3, and the top edge of the weekly support area at 1487.9-1470.2.
Monday’s report went on to underline the following:
Considering the current market trend and the likelihood the current retracement is simply a pullback, the area of support stationed on the H4 timeframe between 1477.3/1493.7 remains an option for long opportunities this week. The research team specifically favours the H4 channel resistance-turned support as an entry point (entered the mix Friday).
Well done to any of our readers who managed an entry out of the said H4 zone. Concerning upside targets, September’s opening level at 1526.2 remains a logical starting point.
Areas of consideration:
Aside from any active longs, it looks as if the H4 candles are preparing for a third retest of the green H4 support zone at 1477.3/1493.7. Should this occur, keep eyes open for H4 bullish signals for additional long positions.
The accuracy, completeness and timeliness of the information contained on this site cannot be guaranteed. IC Markets does not warranty, guarantee or make any representations, or assume any liability regarding financial results based on the use of the information in the site.
News, views, opinions, recommendations and other information obtained from sources outside of www.icmarkets.com.au, used in this site are believed to be reliable, but we cannot guarantee their accuracy or completeness. All such information is subject to change at any time without notice. IC Markets assumes no responsibility for the content of any linked site.
The fact that such links may exist does not indicate approval or endorsement of any material contained on any linked site. IC Markets is not liable for any harm caused by the transmission, through accessing the services or information on this site, of a computer virus, or other computer code or programming device that might be used to access, delete, damage, disable, disrupt or otherwise impede in any manner, the operation of the site or of any user’s software, hardware, data or property.


