
Waiting for lower timeframe confirmation is our main tool to confirm strength within higher timeframe zones, and has really been the key to our trading success. It takes a little time to understand the subtle nuances, however, as each trade is never the same, but once you master the rhythm so to speak, you will be saved from countless unnecessary losing trades. The following is a list of what we look for:
- A break/retest of supply or demand dependent on which way you’re trading.
- A trendline break/retest.
- Buying/selling tails/wicks – essentially we look for a cluster of very obvious spikes off of lower timeframe support and resistance levels within the higher timeframe zone.
We typically search for lower-timeframe confirmation between the M15 and H1 timeframes, since most of our higher-timeframe areas begin with the H4. Stops are usually placed 1-3 pips beyond confirming structures.
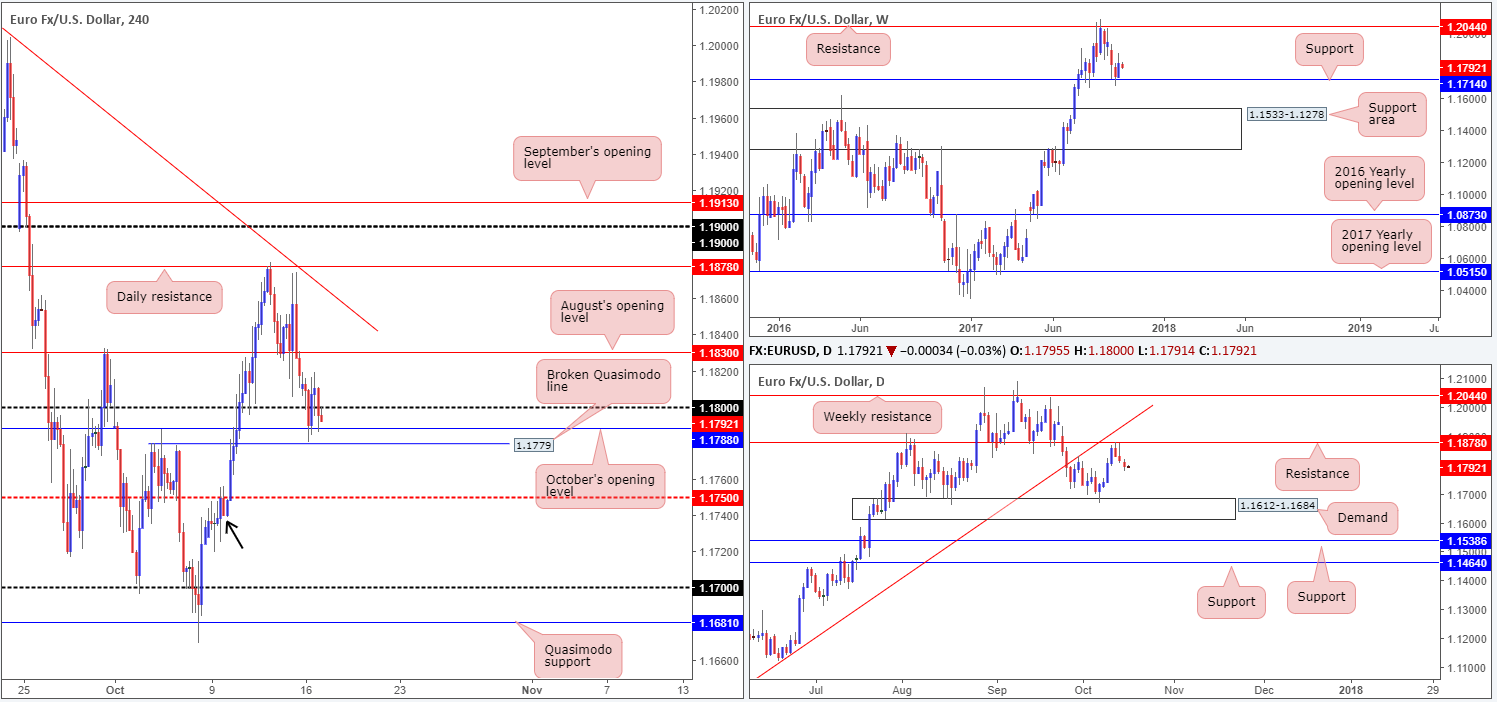
EUR/USD:
As can be seen from the H4 timeframe this morning, the shared currency seized the 1.18 handle in early European trade. This consequently cleared bids and allowed price to shake hands with October’s opening level at 1.1788 and a nearby broken Quasimodo line at 1.1779.
Over on the bigger picture, the pair continues to hold ground above weekly support at 1.1714. Daily price on the other hand, remains trading in a bearish posture after crossing swords with resistance pegged at 1.1878. This is the third consecutive bearish candle printed thus far. As long as the sellers remain in control from this angle, the pair could revisit demand pegged at 1.1612-1.1684 sometime this week (positioned below the aforementioned weekly support).
Suggestions: Despite 1.18 looking as though it’s hanging on by a thread, the said H4 broken Quasimodo level and monthly opening line are still very much in one piece. So, shorting the euro right now is not something we would label high probability, especially given that you’d also be selling into potential weekly flow as well. A break below the current H4 structures opens the door down to the H4 mid-level support at 1.1750 that is seen intersecting with a demand base marked with a black arrow at 1.1739-1.1749. Before sellers get excited, this only frees up 30 pips of space which is not really ideal selling conditions considering risk/reward. Unfortunately, a buy is still just as awkward given the 1.18 resistance level, nearby August opening level at 1.1830 and noted daily resistance.
So with that, the desk will remain flat for the time being.
Data points to consider: German ZEW economic sentiment at 10am; US Import prices at m/m at 1.30pm; US Industrial production m/m and capacity utilization rate at 2.15pm; FOMC member Harker speech at 6pm GMT+1.
Levels to watch/live orders:
- Buys: Flat (stop loss: N/A).
- Sells: Flat (stop loss: N/A).
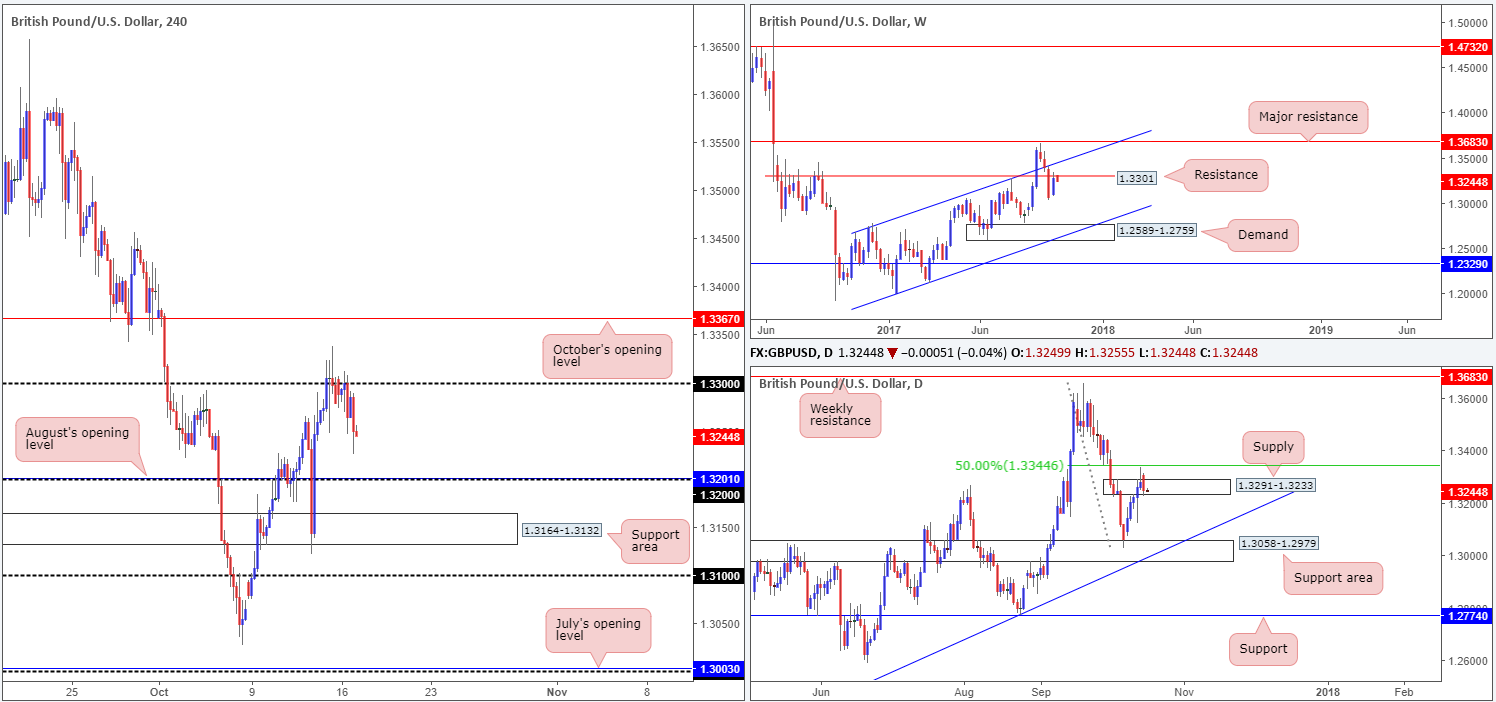
GBP/USD:
Weekly resistance at 1.3301, as you can see, is beginning to establish some resiliency. A pivotal move from this number may force the unit down to channel support extended from the low 1.1986 in the near future. Supply at 1.3291-1.3233 seen on the daily timeframe, although suffering a breach on Friday, remains in play. Yesterday’s near-full-bodied bearish candle could, in our view, point to further downside today/this week.
The 1.33 handle over on the H4 timeframe maintained position on Tuesday and ended the day clocking a low of 1.3225. For those who read Monday’s report you may recall that we highlighted a possible selling opportunity based on Friday’s closing candle (full-bodied bearish candle). Well done to any of our readers who took part in this move. Stops should firmly be at breakeven by now with some profit locked in the bank!
Suggestions: With weekly price still showing potential to the downside and daily price fixed within supply at 1.3291-1.3233, our bias remains bearish.
This could, assuming our bias is accurate, lead to the piece selling off down to the 1.32 handle/August’s opening level at 1.3201, and quite possibly much further according to the higher timeframes (the closest support can be seen in the shape of support area at 1.3058-1.2979). Right now though, we see little opportunity to trade this potential move, unless, of course, the candles retest 1.33 again.
Data points to consider: MPC member Ramsden speaks at 9.15am; UK inflation figures at 9.30am; MPC member Tenreyro speaks at 10.15am; BoE Gov. speaks at 11.15am; US Import prices at m/m at 1.30pm; US Industrial production m/m and capacity utilization rate at 2.15pm; FOMC member Harker speech at 6pm GMT+1.
Levels to watch/live orders:
- Buys: Flat (stop loss: N/A).
- Sells: 1.33 region ([waiting for a reasonably sized H4 bearish candle to form – preferably a full, or near-full-bodied candle – is advised] stop loss: ideally beyond the candle’s wick).
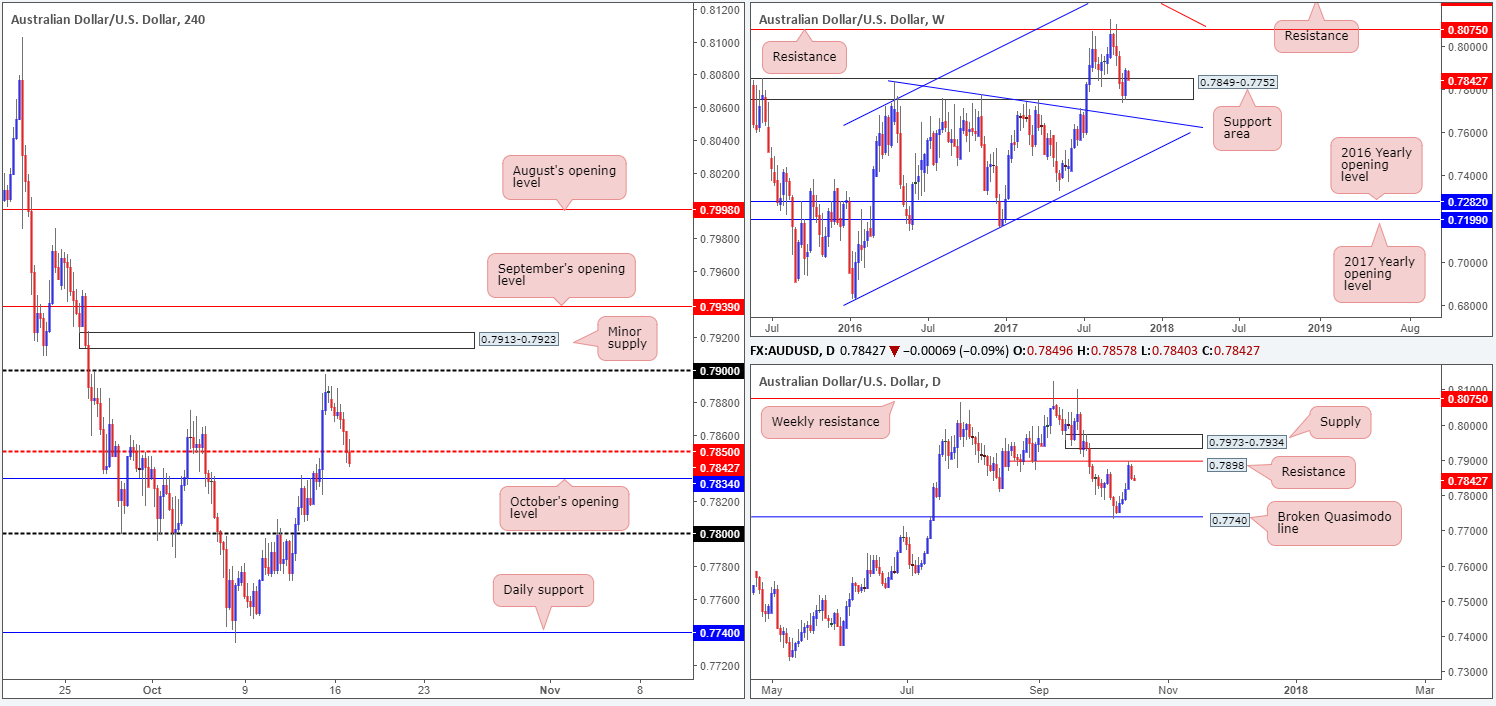
AUD/USD:
Leaving the 0.79 handle unopposed, the commodity currency came under pressure on Monday and concluded trade closing marginally beneath the H4 mid-level support at 0.7850. As can be seen from the H4 timeframe, however, price has since pushed lower and is now seen within striking distance of October’s opening level at 0.7834.
According to daily structure, this move should not really have come as a surprise, given resistance plotted at 0.7898. On the other side of the coin, nevertheless, a stronger than expected rebound was seen from within the lower limits of a weekly support area at 0.7849-0.7752 last week, consequently submerging recent losses and constructing a near-full-bodied bullish candle.
Suggestions: With RBA minutes just around the corner (at the time of writing), and a clear conflict of opinion being seen between the weekly and daily structures at the moment, this, at least in our humble view, is not a tradable market right now.
Therefore, at least for the time being, our team will remain on the sidelines and look to reassess structure following RBA minutes.
Data points to consider: RBA Monetary policy meeting minutes at 1.30am; US Import prices at m/m at 1.30pm; US Industrial production m/m and capacity utilization rate at 2.15pm; FOMC member Harker speech at 6pm GMT+1.
Levels to watch/live orders:
- Buys: Flat (stop loss: N/A).
- Sells: Flat (stop loss: N/A).
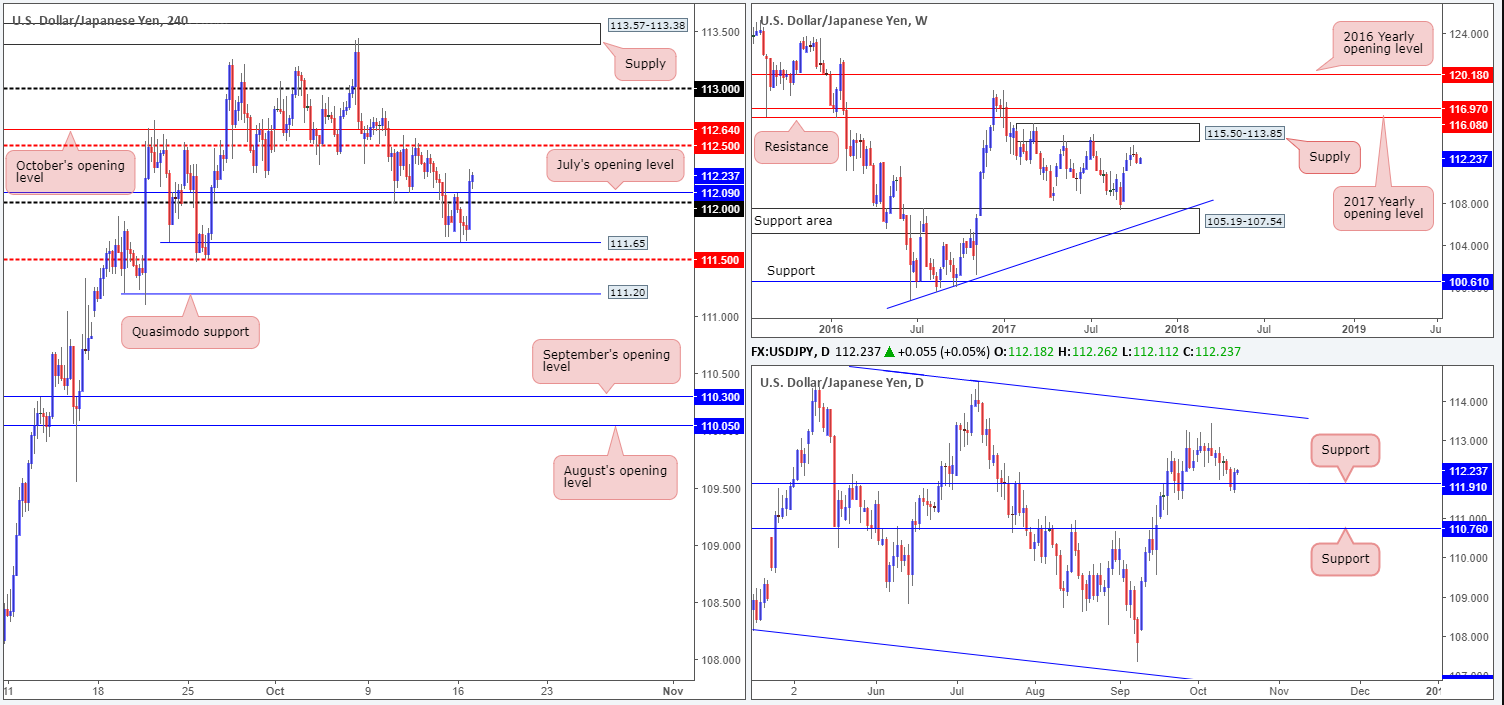
USD/JPY:
USD/JPY bulls, as you can see, went on the offensive during yesterday’s NY afternoon session, closing above both the 112 handle and July’s opening base line at 112.09. Technically speaking, the move was also reinforced by daily support coming in at 111.91.
As far as we can see, the next upside H4 targets can be seen at the mid-level resistance 112.50, followed closely by October’s opening level at 112.64.
A long in this market at current price would be a chancy move given how close the aforementioned H4 resistances are positioned. This is a shame since daily price shows room to extend as far north as a trendline resistance extended from the high 115.50, which happens to intersect beautifully with weekly supply drawn from 115.50-113.85 (the next upside target on the weekly scale).
Suggestions: Watch for H4 price to retest 112 as support and then look to trade any retest seen thereafter. Waiting for a lower-timeframe buy signal to form (see the top of this report for ideas on how to use the lower timeframes as a means of entry) following the retest is advised before pulling the trigger.
Data points to consider: US Import prices at m/m at 1.30pm; US Industrial production m/m and capacity utilization rate at 2.15pm; FOMC member Harker speech at 6pm GMT+1.
Levels to watch/live orders:
- Buys: Watch for H4 price to retest 112 and then look to trade any retest seen thereafter ([waiting for a lower-timeframe buy signal to form following the retest is advised] stop loss: dependent on where one confirms the area).
- Sells: Flat (stop loss: N/A).
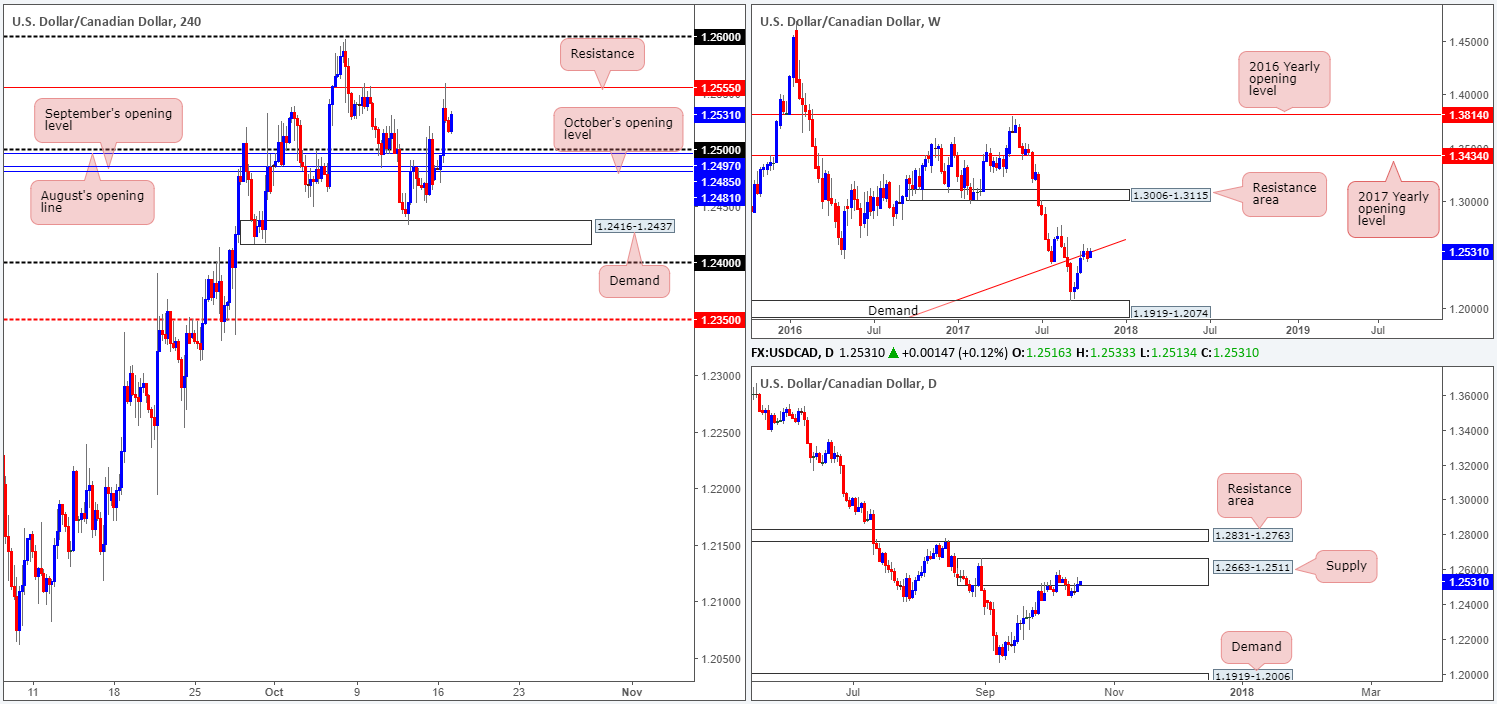
USD/CAD:
A robust session for the USD/CAD yesterday saw H4 price ride through several tech resistances and contest resistance pegged at 1.2555. From a technical point of view, the unit may take on more of a sober approach today and consolidate between the said resistance and 1.25 handle.
Despite H4 structure, the overall direction, we believe, remains south. Not only because of the steep downtrend price has been in since early May (see weekly chart), it’s also to do with higher-timeframe structure. On the weekly timeframe, we can see that the buyers and sellers are currently battling for position around the underside of a trendline resistance extended from the low 0.9633. In conjunction with the weekly timeframe, the daily timeframe shows that the candles remain fixed at supply drawn from 1.2663-1.2511.
Suggestions: Despite the bigger picture pointing to a move lower, however, selling on the H4 timeframe is exceedingly awkward at the minute. Besides the 1.25 handle, there’s also three monthly opening levels (Aug, Sept and Oct) seen positioned directly below between 1.2481/1.2497. And, even if these levels are cleared, traders still have the pleasure of contending with a H4 demand 1.2416-1.2437, shadowed closely by 1.24.
In light of the above notes, remaining flat until more conducive price action presents itself is the route we’ve chosen to take.
Data points to consider: US Import prices at m/m at 1.30pm; US Industrial production m/m and capacity utilization rate at 2.15pm; FOMC member Harker speech at 6pm; CAD Gov. Council member Wilkins speaks at 8.30pm GMT+1.
Levels to watch/live orders:
- Buys: Flat (stop loss: N/A).
- Sells: Flat (stop loss: N/A).
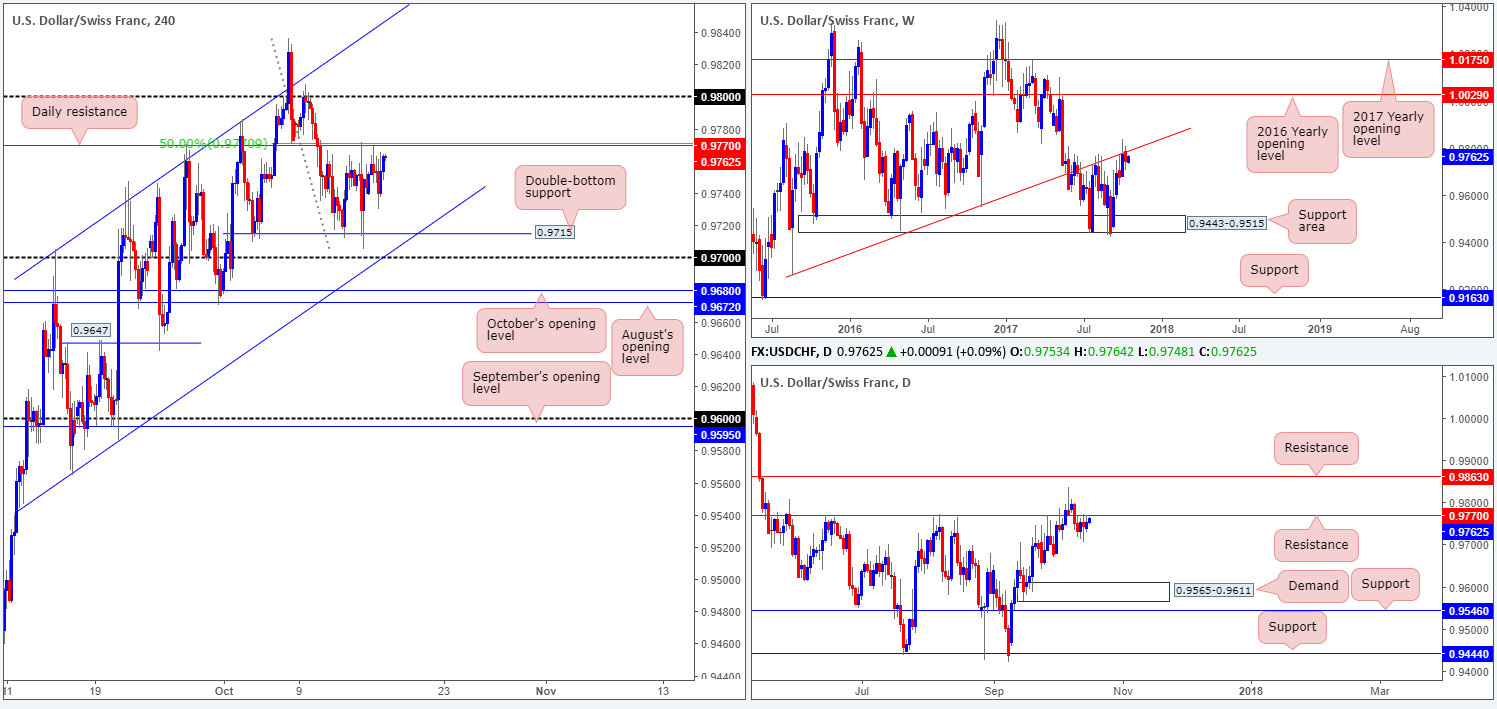
USD/CHF:
The USD/CHF sported a rather quiet session on Monday, fluctuating in a tight 40-pip range directly beneath daily resistance penciled in at 0.9770, which happens to merge beautifully with a H4 50.0% resistance at 0.9774 taken from the high 0.9836. This daily resistance – coupled with weekly price beginning to make a stance around the underside of a trendline resistance etched from the low 0.9257 – could see the unit sell off today/this week.
Suggestions: To take advantage of a possible fade from 0.9770, we would strongly advise waiting for additional H4 confirmation in the form of a full or near-full-bodied bearish candle. This will help confirm if active sellers remain here, since there is a chance that the market may want to bring in sellers from 0.98 before driving lower.
Data points to consider: US Import prices at m/m at 1.30pm; US Industrial production m/m and capacity utilization rate at 2.15pm; FOMC member Harker speech at 6pm GMT+1.
Levels to watch/live orders:
- Buys: Flat (stop loss: N/A).
- Sells: 0.9770 region ([waiting for a reasonably sized H4 bearish candle to form – preferably a full, or near-full-bodied candle – is advised] stop loss: ideally beyond the candle’s wick).
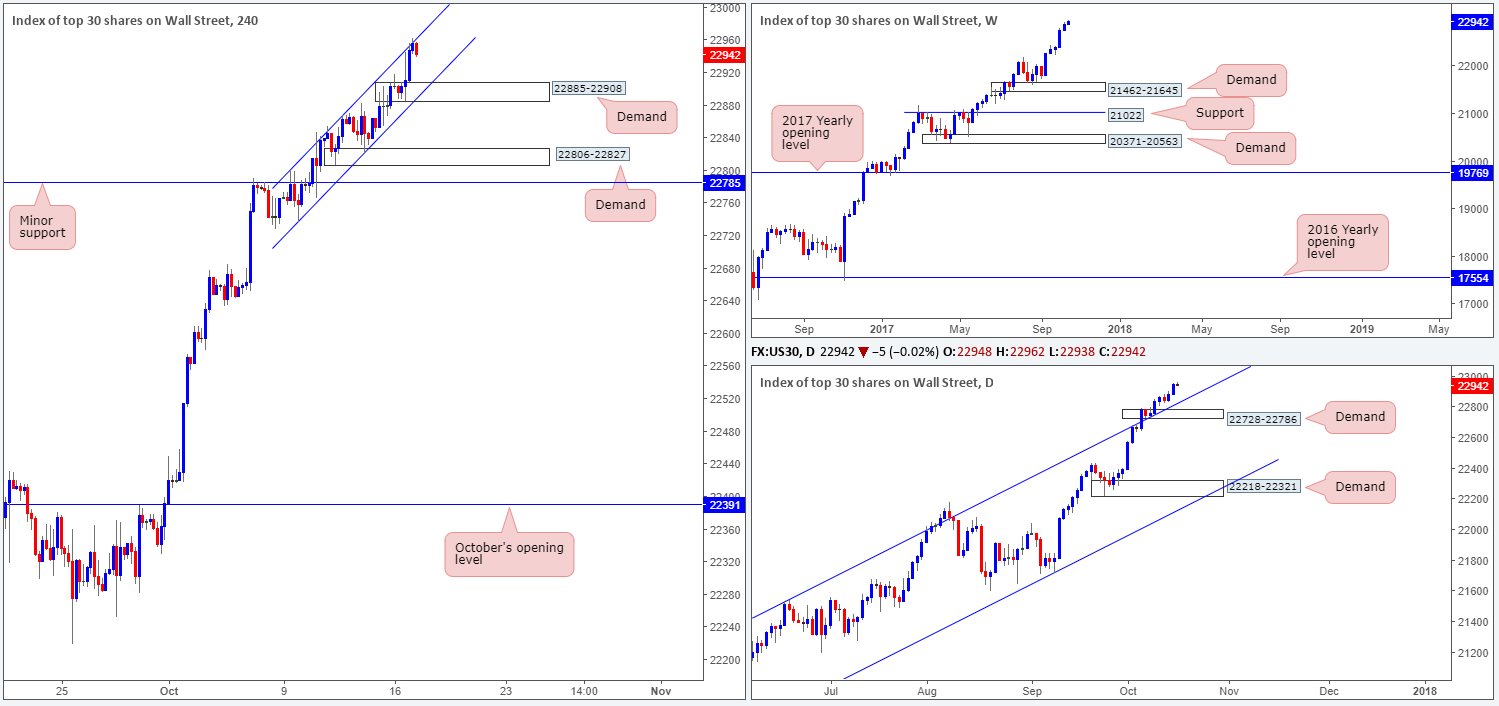
DOW 30:
US equities printed modest gains on Monday, recording a fresh record high of 22956. Technically, what this move did was form a strong-looking H4 demand base at 22885-22908 that aligns perfectly with a H4 channel support etched from the low 22736.
Suggestions: Should this area be tested today and form a full or near-full-bodied H4 bullish candle, we would consider entering into a long position from here, with stops set just below the zone at 22883. Not only because of the converging channel support, but also because of the strong underlying trend the index is in right now.
Data points to consider: US Import prices at m/m at 1.30pm; US Industrial production m/m and capacity utilization rate at 2.15pm; FOMC member Harker speech at 6pm GMT+1.
Levels to watch/live orders:
- Buys: 22885-22908 ([waiting for a reasonably sized H4 bullish candle to form – preferably a full, or near-full-bodied candle – is advised] stop loss: ideally beyond the candle’s tail).
- Sells: Flat (stop loss: N/A).
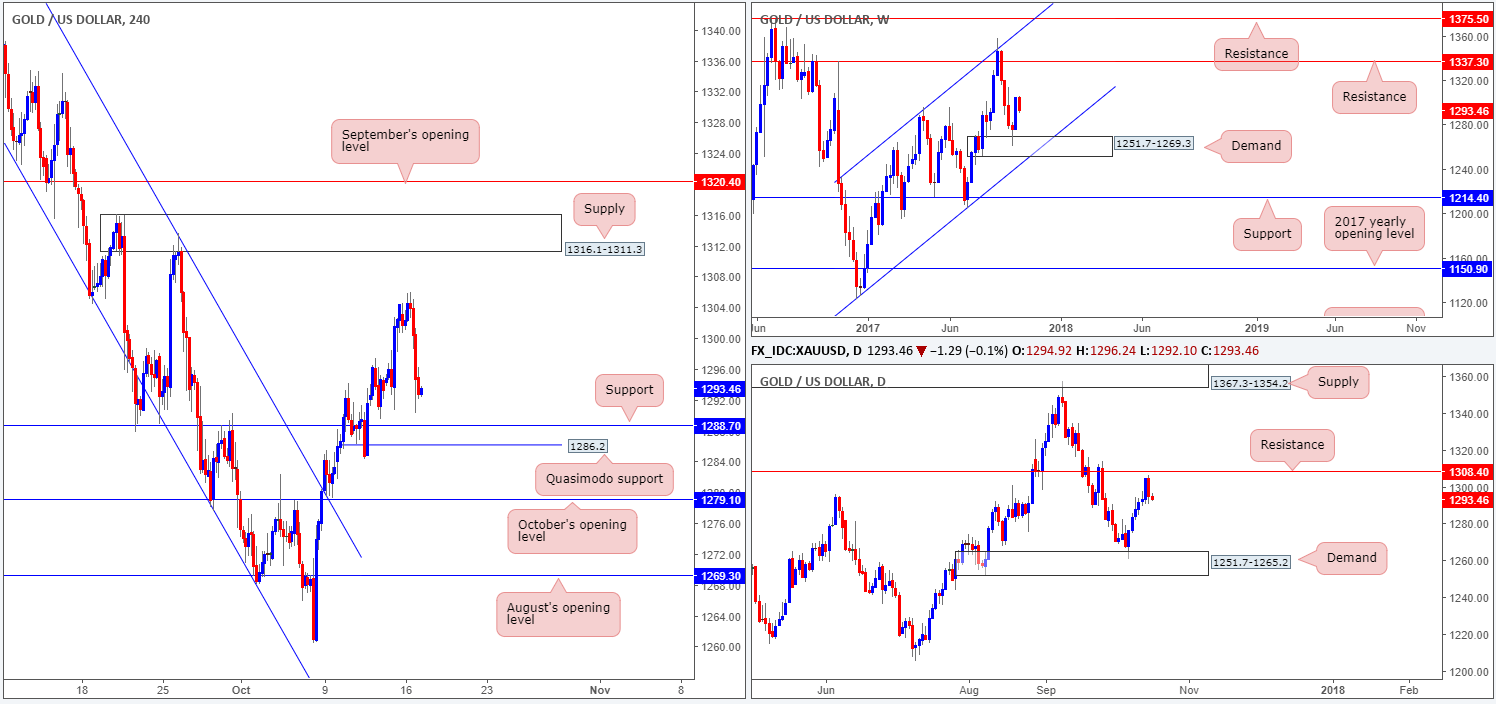
GOLD:
Leaving the daily resistance at 1308.4 unchallenged, the gold market took a turn for the worse on Monday and crushed a six-day bullish phase. Also of particular note on the daily timeframe is the nice-looking bearish engulfing candle that formed! A continued push to the downside from this neighborhood could eventually see the yellow metal cross paths with demand plotted at 1251.7-1265.2. Before this move can come to fruition, nonetheless, nearby H4 support at 1288.7 is standing in the way. Also a little concerning is the H4 Quasimodo support seen lurking just underneath it at 1286.2.
Suggestions: Assuming our higher timeframe analysis is precise, selling is the order of the day. Still, we would not contemplate shorting the metal UNTIL the aforementioned H4 Quasimodo support has been taken out. As you have probably also noticed though, a sell beyond 1286.2 unfortunately does not leave much room for price to stretch its legs before hitting October’s opening level at 1279.1.
In the event that a trade does come to fruition, we would be looking to reduce risk to breakeven at October’s open level. Yes, this may be a little too close for comfort for some people, but the last thing we would want to do is trade short, see the market move in favor and then take a loss!
Levels to watch/live orders:
- Buys: Flat (stop loss: N/A).
- Sells: Watch for H4 price to close below 1286.2 and then look to trade any retest seen thereafter ([waiting for a lower-timeframe sell signal to form [see the top of this report] following the retest is advised to secure a tight entry] stop loss: dependent on where one confirms the level).


