
EUR/USD:
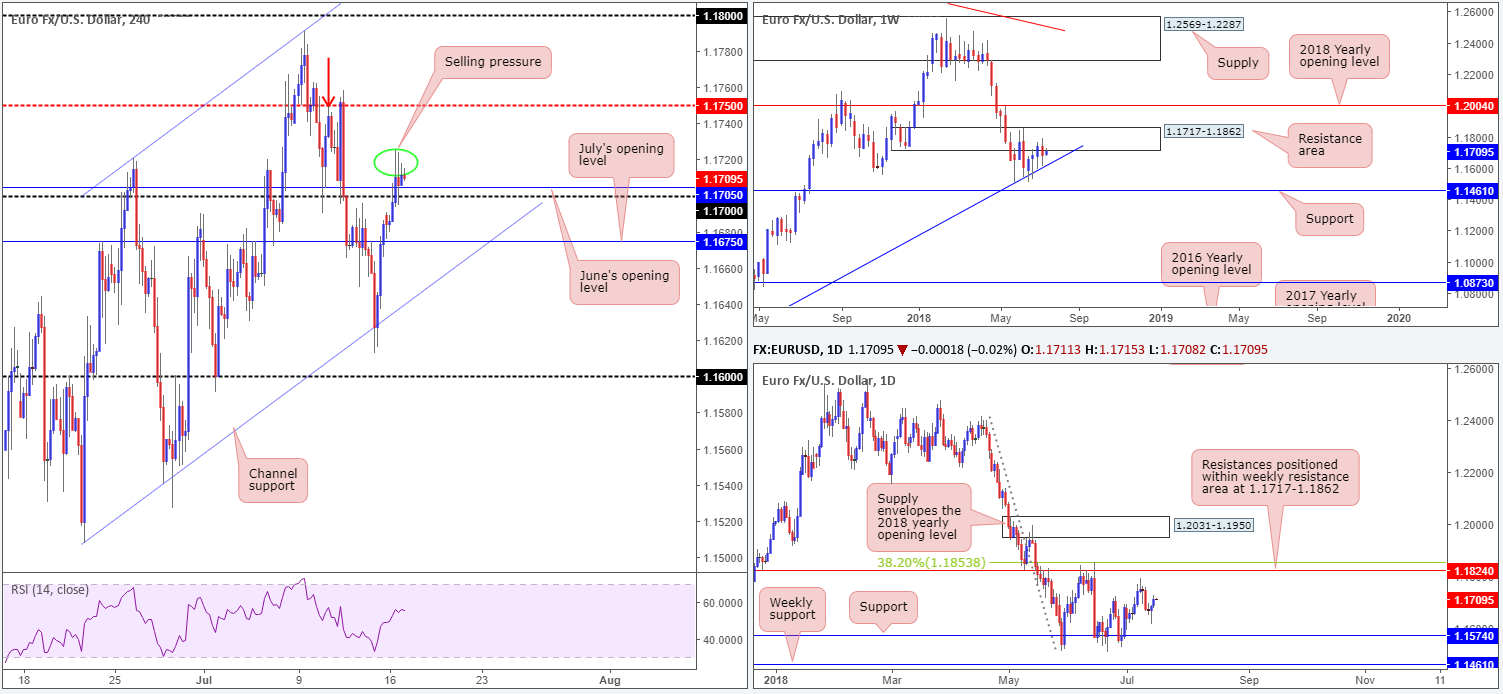
The single currency is trading with a reasonably strong bias to the upside this morning, following a soft Monday. The recent break of the 1.17 handle on the H4 timeframe and June’s opening level at 1.1705 shows little stopping this market from reaching H4 mid-level resistance at 1.1750, which also happens to represent a Quasimodo resistance taken from the left shoulder marked with a red arrow. There were some relevant macroeconomic news coming from both sides of the Atlantic throughout London and US trade, though had little impact on price action.
Higher up on the curve, nevertheless, buyers and sellers are seen battling for position between a weekly resistance area coming in at 1.1717-1.1862 and weekly trend line support (etched from the low 1.0340).
Areas of consideration:
The H4 wicks seen printed into Monday’s close (marked with a green circle) should be of concern for those long above the 1.17 region. To our way of seeing things, this shows a lack willingness to engage from the buyers. This could have something to do with the fact that weekly price is touching the underside of a resistance area. Whatever the case may be, it is not a good sign for those long.
Should we reclaim 1.17 today, the next downside target in view on the H4 scale can be seen at 1.1675: July’s opening level. As you can see, there’s not a lot of room to play with here!
On account of the above, neither a long nor short seems attractive at present.
Today’s data points: US Industrial production (m/m) and capacity utilization rate; Fed Chair Powell testifies.
GBP/USD:
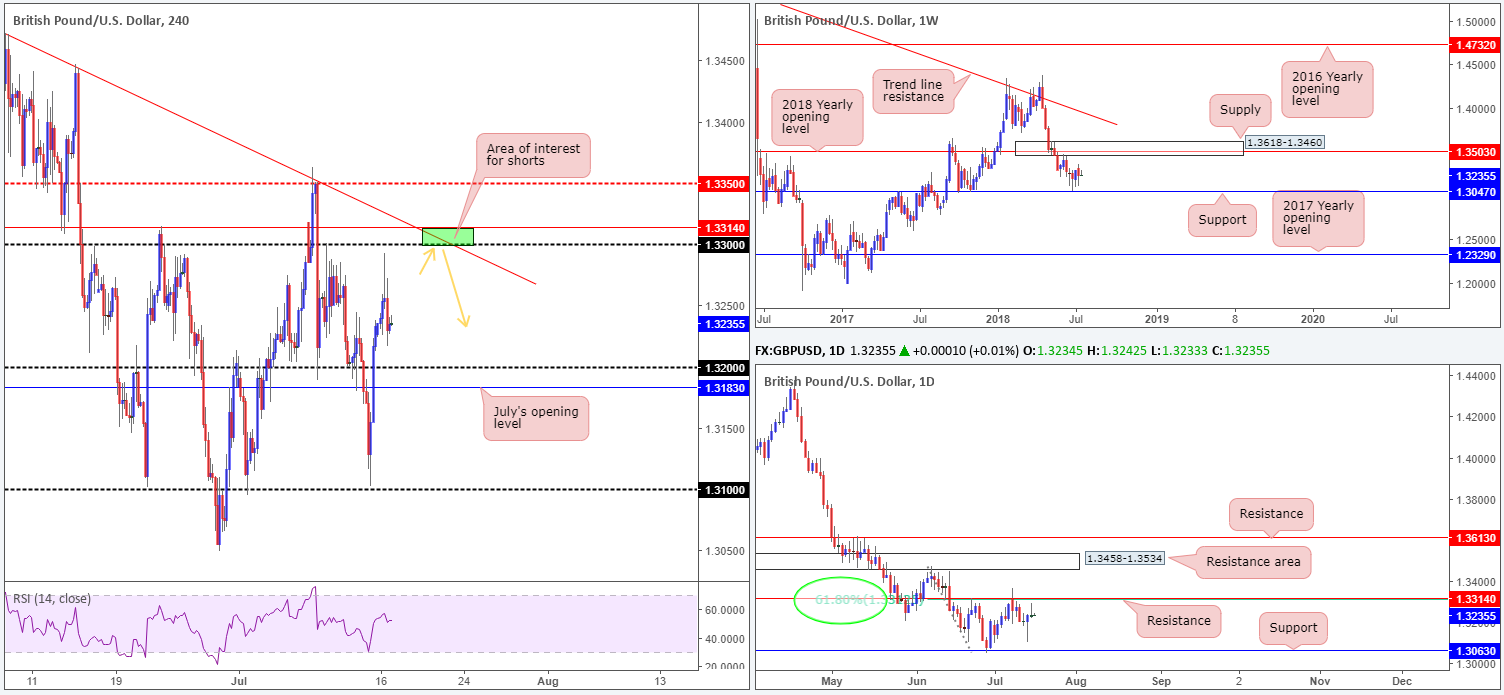
Leaving the 1.33 handle unchallenged on the H4 timeframe, the British pound pared a large portion of its intraday gains built amid early European hours, ending the day relatively unchanged at 1.3234. In UK politics, UK government passed an amendment bill to PM May’s latest Brexit strategy, making it difficult for the UK to negotiate an easy split from the European Union.
In terms of technical structure on the H4 timeframe, the 1.32 handle and its closely associated July’s opening level at 1.3183 is considered an area of possible support. To the upside, however, we see the 1.33 handle. Besides converging with H4 trend line resistance (extended from the high 1.3472), the round number is also positioned 14 pips beneath daily resistance at 1.3314 (green zone).
Areas of consideration:
A H4 full or near-full-bodied bearish candle printed from 1.3314/1.33 would, according to the technicals, likely be sufficient enough to warrant shorts. Stop-loss orders are best placed above the rejection candle’s wick. As for the take-profit targets, this is still difficult to judge at this point since the approach has yet to complete.
Today’s data points: BoE Gov. Carney speaks; UK job’s figures; US Industrial production (m/m) and capacity utilization rate; Fed Chair Powell testifies.
AUD/USD:
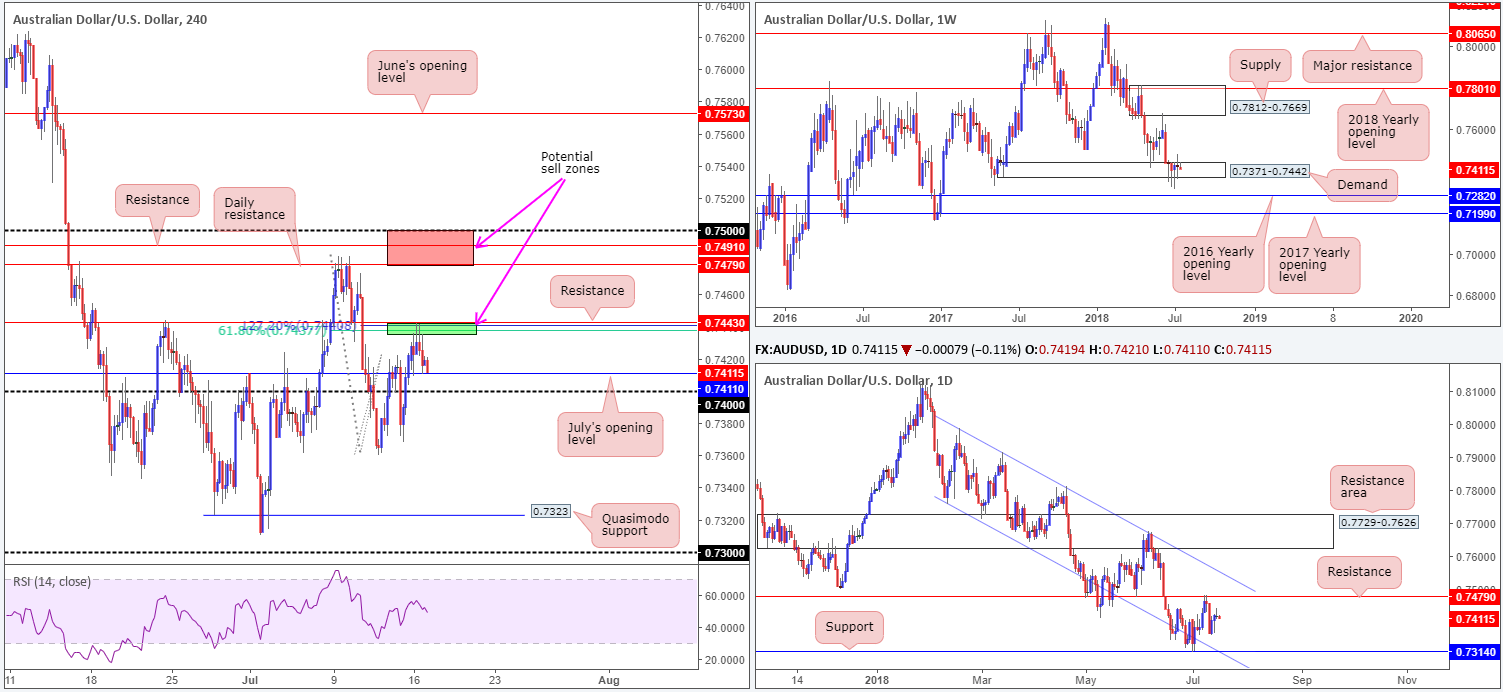
For folks who read Monday’s technical briefing you may recall the team highlighted 0.7443/0.7437 (green area) as a promising H4 sell zone. Comprised of a H4 resistance level at 0.7443, a 61.8% H4 Fib resistance value at 0.7437 and H4 resistance in the form of a 127.2% Fib ext. point at 0.7440, this area, as you can see, capped price action in recent trade. Well done to any of our readers who managed to jump aboard this move, as the H4 candles appear poised to take out nearby support at 0.7411: July’s opening level.
A quick look over higher timeframe structure reveals weekly price continues to engage with a somewhat fragile demand area at 0.7371-0.7442. Continued indecisiveness here could open the window to a possible test of the 2016 yearly opening level at 0.7282 sometime down the road. In the event that the bulls regain consciousness, however, a retest of supply at 0.7812-0.7669 may be on the cards. Support at 0.7314, alongside its closely associated channel support taken from the low 0.7758, remains a focal point on the daily timeframe, as does the resistance level seen overhead at 0.7479. Both levels carry equal weight, in our opinion.
Areas of consideration:
Early Asia today brings on the RBA’s latest meeting minutes, with analysts bracing for a potentially dovish showing. Those who remain short from 0.7443/0.7437 are encouraged to hold tight. A decisive H4 push below July’s opening level mentioned above at 0.7411, along with the 0.74 handle, opens the door for a test of H4 support at 0.7371. Beyond here, we see little stopping the unit from trading as far south as H4 Quasimodo support at 0.7323, which is shadowed closely by daily support at 0.7314.
Today’s data points: AUD Monetary policy meeting minutes; US Industrial production (m/m) and capacity utilization rate; Fed Chair Powell testifies.
USD/JPY:
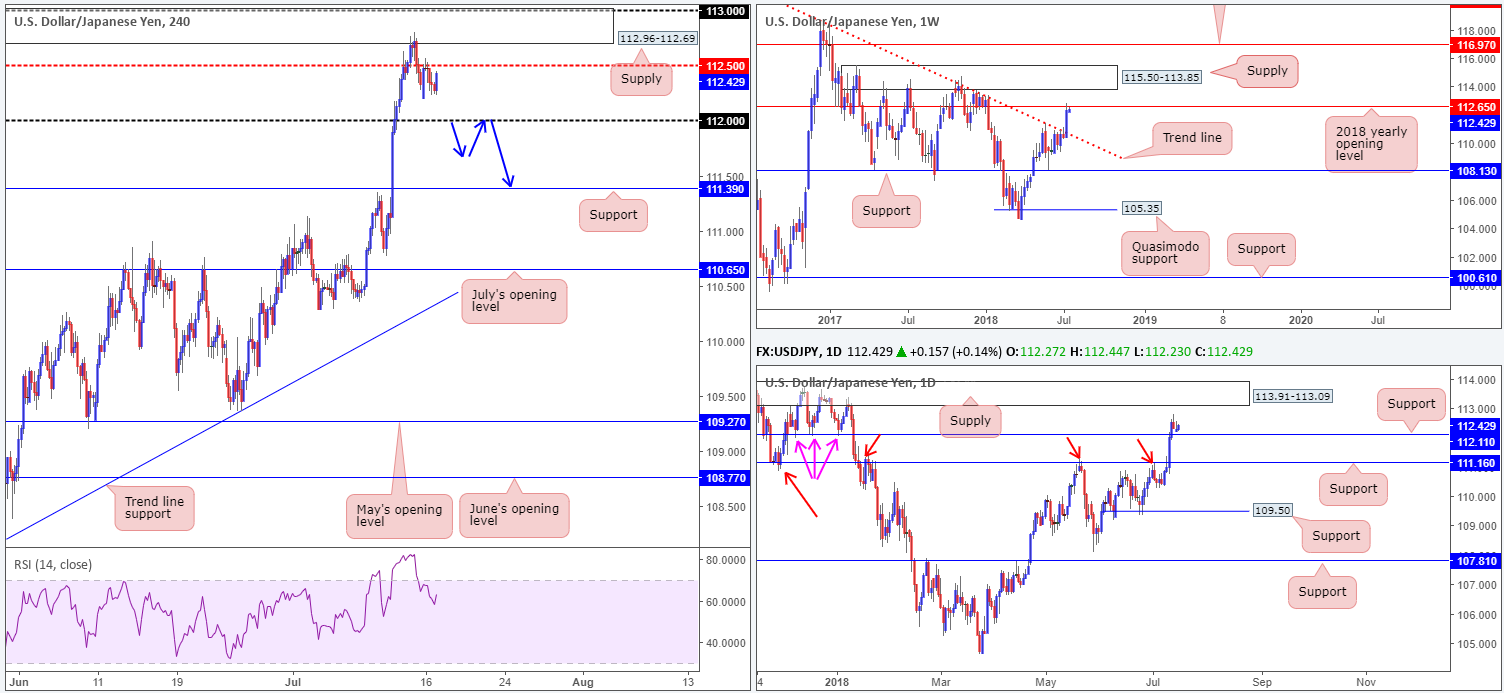
USD/JPY movement employed a somewhat sedated theme on Monday due to a holiday in Japan that kept local desks quiet. A retest to the underside of H4 mid-level resistance at 112.50, however, took place. This level, and the H4 supply area seen directly above it at 112.96-112.69, remain of interest, given its connection to the 2018 yearly opening level on the weekly timeframe (resistance) at 112.65. Yearly levels tend to command attention, so don’t make the mistake of overlooking it!
The story on the daily timeframe brings the resistance-turned support fixed at 112.11 to attention. Note how this level held as support in December 2017 (pink arrows). Beneath this line, though, attractive support also rests at 111.16. Should price action reach this low this week, the pair is likely to find support with it having been an impressive resistance over the course of the year (see red arrows).
Areas of consideration:
At current price, the USD/JPY is a difficult market to trade. Irrespective of the direction one selects here, opposing structure is clearly evident. A long in this market has you trading against weekly resistance (2018 yearly opening level at 112.65) and noted H4 structure. On the other side of the coin, shorts are capped by the daily support at 112.11.
With the above in mind, traders may want to consider waiting and seeing if weekly sellers maintain control of this market and break through the 112 handle. This way, we know daily support is out of the picture, with downside then reasonably free to approach H4 support at 111.39, followed closely by daily support mentioned above at 111.16 (both ideal downside targets).
A H4 close below 112 that’s followed up with a retest in the shape of a full or near-full-bodied H4 bearish candle would, from a technical standpoint, likely be enough to suggest shorts. As usual, stop-loss orders are best placed beyond the candle’s rejection wick.
Today’s data points: US Industrial production (m/m) and capacity utilization rate; Fed Chair Powell testifies.
USD/CAD:
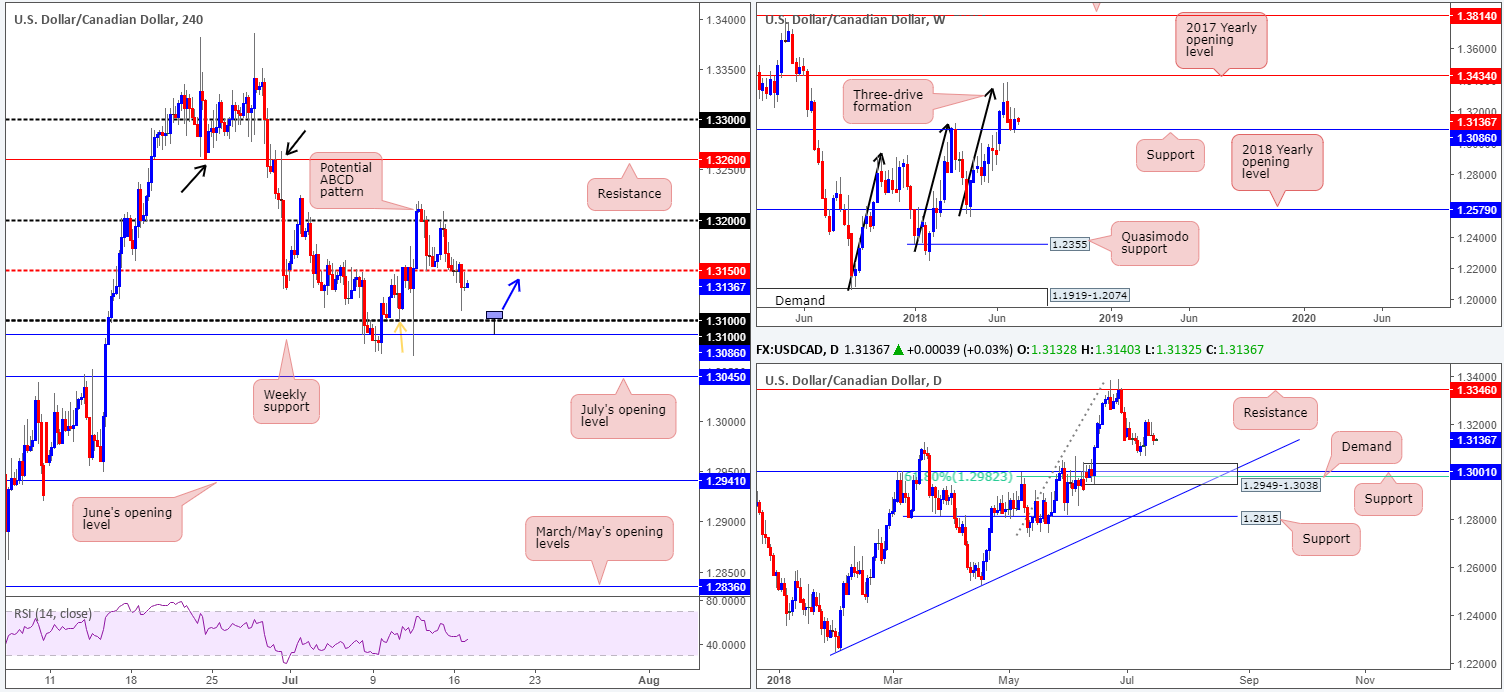
The USD/CAD is marginally weaker today after conquering the H4 mid-level support drawn from 1.3150, despite WTI plunging to lows of $67.61. Recent selling appears to be the product of a waning greenback, after the US dollar index failed to sustain gains above the 95.00 mark last week.
Clearing 1.3150 on the H4 scale pulls the 1.31 handle into view, which also represents a H4 Quasimodo support (see left shoulder marked with an orange arrow). Weekly movement remains toying with support at 1.3086, after completing a nice-looking three-drive formation just south of the 2017 yearly opening level at 1.3434 a few weeks back. A closer look at price action on the daily timeframe, however, reveals strong support standing at 1.3001 (history dating back to Sept 2016), followed closely by a 61.8% Fib support value at 1.2982. On top of this, we can also see demand at 1.2949-1.3038 converging with these levels! Collectively, these areas are likely to hinder downside movement. To the upside, nonetheless, we see very little in terms of active resistance until 1.3346.
Areas of consideration:
A move down to 1.31 would be interesting. From this point traders should be on the lookout for H4 price to print a bullish pin-bar formation that whipsaws through the round number and tags nearby weekly support at 1.3086: a high-probability long (see H4 chart for a visual representation). The first area of concern from here sits at 1.3150.
Today’s data points: US Industrial production (m/m) and capacity utilization rate; Fed Chair Powell testifies; CAD manufacturing sales m/m.
USD/CHF:
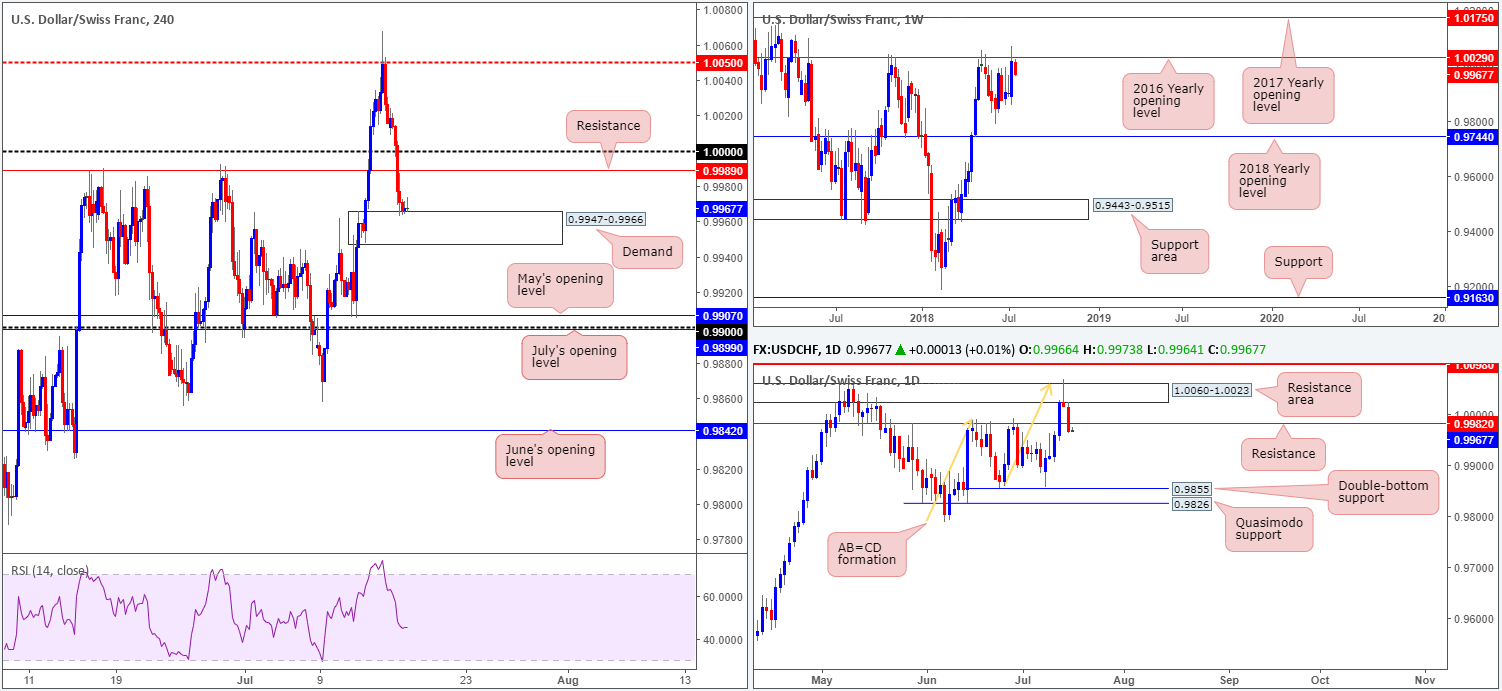
In Monday’s report the team explicitly specified to be suspicious of longs around the 1.0000 (parity) neighborhood, despite it likely being a watched number across the market. Not only do we have weekly resistance in the form of a 2016 yearly opening level at 1.0029 in play, we also saw daily price chalk up a nice-looking bearish pin-bar formation on Friday off a daily AB=CD completion (orange arrows) point around the top edge of a daily resistance area (1.0060-1.0023). This should be sufficient indication to warn just about any technician!
With daily support at 0.9982 also out of the picture (now acting resistance), the next downside target on this scale falls in at double-bottom support drawn from 0.9855, followed closely by a daily Quasimodo support at 0.9826. On the H4 scale, nevertheless, the pair is seen attempting to print a recovery off H4 demand at 0.9947-0.9966, eyeing H4 resistance at 0.9989/1.0000.
Areas of consideration:
Seeing both weekly and daily price effectively enter ‘sell mode’, H4 demand mentioned above at 0.9947-0.9966 is unlikely to print anything noteworthy. The most we imagine is a pullback to 0.9989/1.0000.
What would be interesting is a H4 close below the current H4 demand, potentially exposing May’s opening level at 0.9907, followed closely by the 0.99 handle. In fact, should H4 price retest the underside of 0.9947-0.9966 as resistance following a push lower, intraday shorts would be in the offing. Although 0.99/0.9907 is an ideal initial take-profit target from here, we could possibly see June’s opening level brought into the fray at 0.9842, given its positioned just beneath daily double-bottom support mentioned above at 0.9855 (the next downside target on the daily timeframe).
Today’s data points: US Industrial production (m/m) and capacity utilization rate; Fed Chair Powell testifies.
Dow Jones Industrial Average:
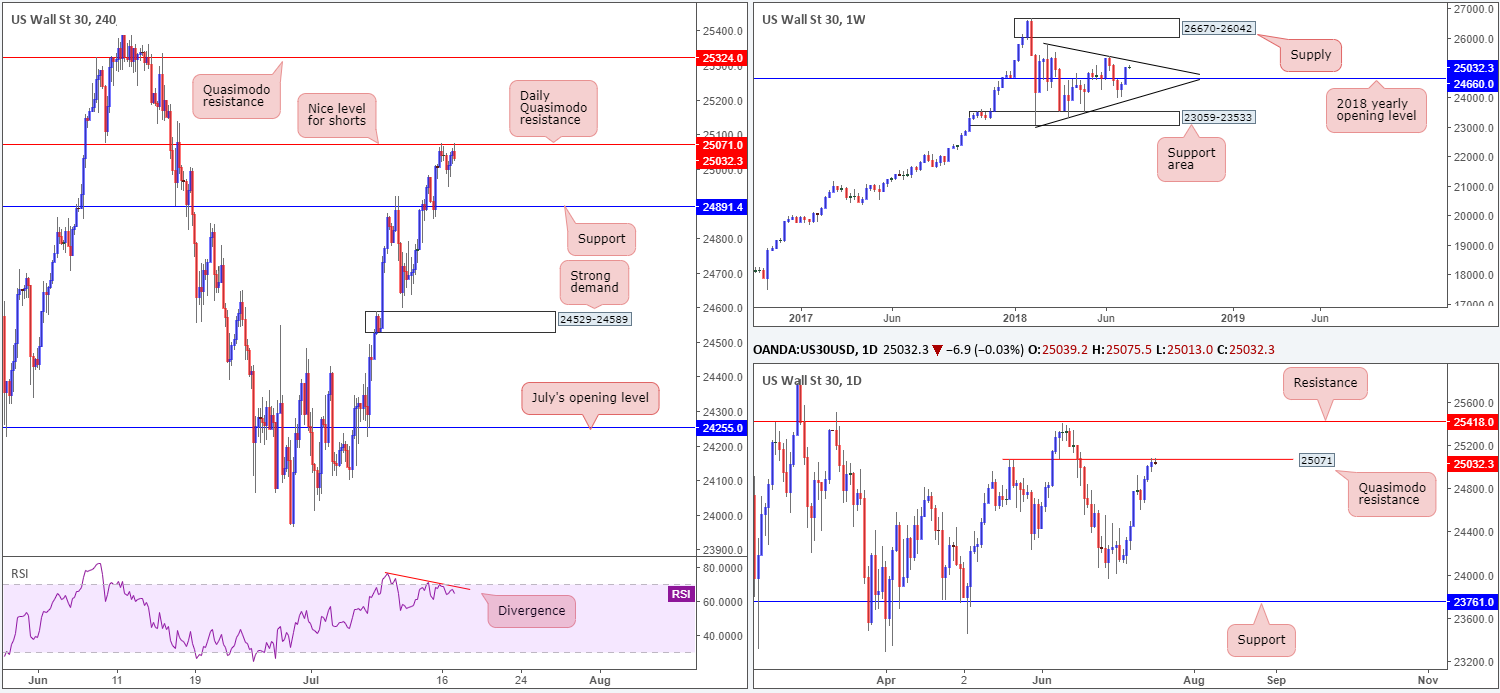
US equities struggled to clinch a foothold on Monday as energy shares came under heavy selling pressure. Amid concerns over supply disruptions, oil prices fell sharply yesterday with WTI touching lows as far south as $67.61.
From a technical standpoint, weekly price appears poised to probe higher and shake hands with trend line resistance drawn from the high 25807 this week, after firmly crossing above the 2018 yearly opening level at 24660. Before weekly players can reach the noted trend line resistance, however, daily sellers are seen putting up a fight from a Quasimodo resistance level at 25071.
Looking across to the H4 timeframe, we can clearly see the candles responding to the current daily Quasimodo resistance. Another important thing to consider on the H4 scale is the RSI indicator displaying divergence. A rejection off of the daily level would likely bring H4 support at 24891 into the mix, whereas a push to the upside has a H4 Quasimodo resistance in view at 25324.
Areas of consideration:
A H4 full or near-full-bodied bearish candle printed off the aforementioned daily Quasimodo resistance level is, in our humble view, a high-probability shorting opportunity. Why we wait for additional candle confirmation off daily resistance is simply due to the threat of a potential move higher on the weekly scale, as highlighted above. Stop-loss orders best placed beyond the rejection candle’s wick.
Today’s data points: US Industrial production (m/m) and capacity utilization rate; Fed Chair Powell testifies.
XAU/USD (Gold)
(Due to a lackluster movement on Monday much of the following report echoes the same vibe put forward in Monday’s analysis).
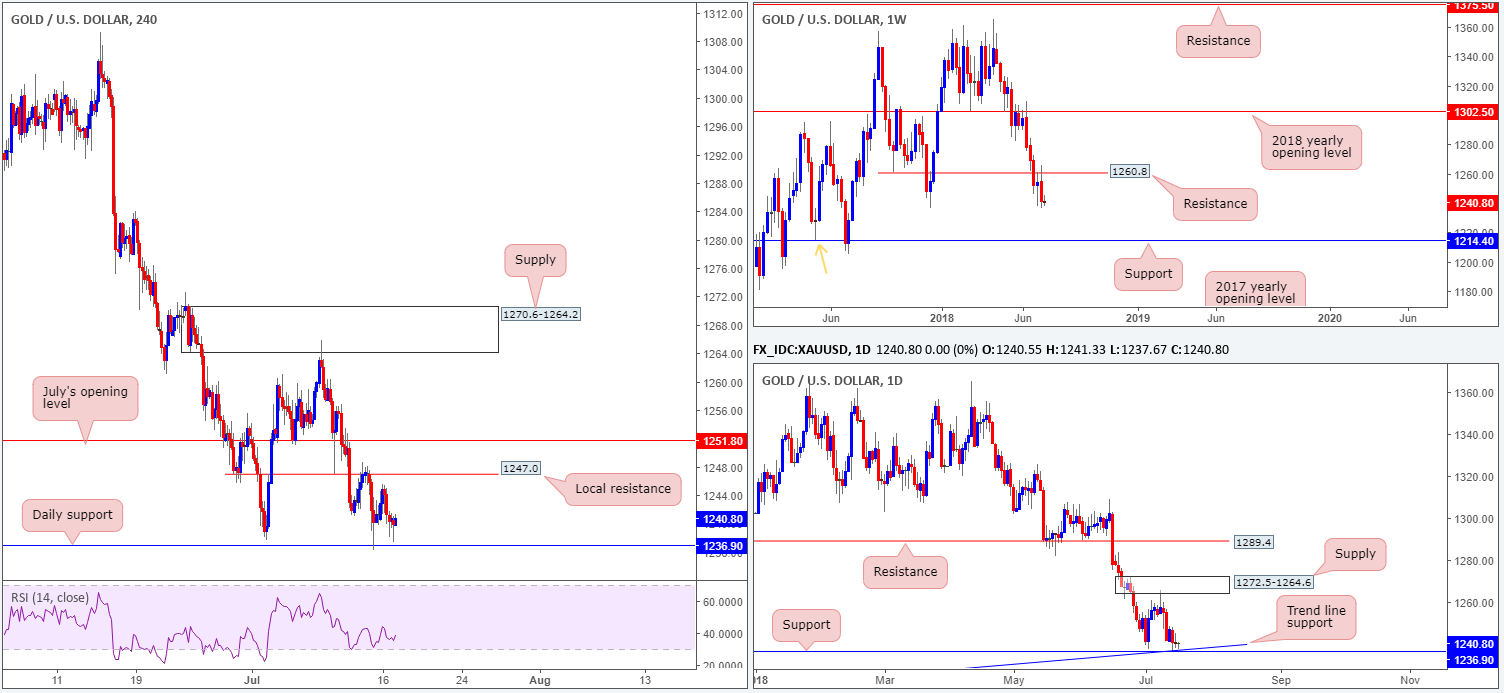
Kicking this market off with a look at the weekly timeframe, we can see that the price of gold continues to air a bearish vibe. After crossing swords with the underside of resistance at 1260.8 in the shape of a bearish engulfing candle, the yellow metal could eventually greet support at 1214.4, which also happens to represent a Quasimodo support taken from the left shoulder marked with an orange arrow.
A little lower on the curve, however, daily movement recently checked in with support at 1236.9 that unites beautifully with a trend line support etched from the low 1195.1. Whether this will be enough to stand up to weekly selling is difficult to judge at this point. In case of a move lower, though, it may be worth penciling in the Quasimodo support at 1217.6 as the next potential downside target (not seen on the screen).
H4 price, as you can see, remains capped by the noted daily support and H4 resistance based at 1247.0. A move above this base would have traders looking for July’s opening level at 1251.0. A push below daily support on this scale exposes H4 support at 1228.0 (not seen on the screen), followed closely by daily Quasimodo support at 1217.6.
Areas of consideration:
Due to where we’re coming from on the weekly scale: resistance at 1260.8, buyers will likely struggle to get beyond the H4 resistance level at 1247.0 – the most we imagine is 1251.8: July’s opening level.
On account of this reading, looking for selling opportunities may be the better path to take. Should a H4 close be seen beyond the current daily support level that’s followed up with a retest as resistance, a sell in this market would be considered high probability, targeting H4 support at 1228.0.
The use of the site is agreement that the site is for informational and educational purposes only and does not constitute advice in any form in the furtherance of any trade or trading decisions.
The accuracy, completeness and timeliness of the information contained on this site cannot be guaranteed. IC Markets does not warranty, guarantee or make any representations, or assume any liability with regard to financial results based on the use of the information in the site.
News, views, opinions, recommendations and other information obtained from sources outside of www.icmarkets.com.au, used in this site are believed to be reliable, but we cannot guarantee their accuracy or completeness. All such information is subject to change at any time without notice. IC Markets assumes no responsibility for the content of any linked site. The fact that such links may exist does not indicate approval or endorsement of any material contained on any linked site.
IC Markets is not liable for any harm caused by the transmission, through accessing the services or information on this site, of a computer virus, or other computer code or programming device that might be used to access, delete, damage, disable, disrupt or otherwise impede in any manner, the operation of the site or of any user’s software, hardware, data or property.


