
A note on lower timeframe confirming price action…
Waiting for lower timeframe confirmation is our main tool to confirm strength within higher timeframe zones, and has really been the key to our trading success. It takes a little time to understand the subtle nuances, however, as each trade is never the same, but once you master the rhythm so to speak, you will be saved from countless unnecessary losing trades. The following is a list of what we look for:
- A break/retest of supply or demand dependent on which way you’re trading.
- A trendline break/retest. Buying/selling tails – essentially we look for a cluster of very obvious spikes off of lower timeframe support and resistance levels within the higher timeframe zone.
- Candlestick patterns. We tend to only stick with pin bars and engulfing bars as these have proven to be the most effective.
For us, lower timeframe confirmation starts on the M15 and finishes up on the H1, since most of our higher timeframe areas begin with the H4. Stops usually placed 5-10 pips beyond your confirming structures.
EUR/USD:
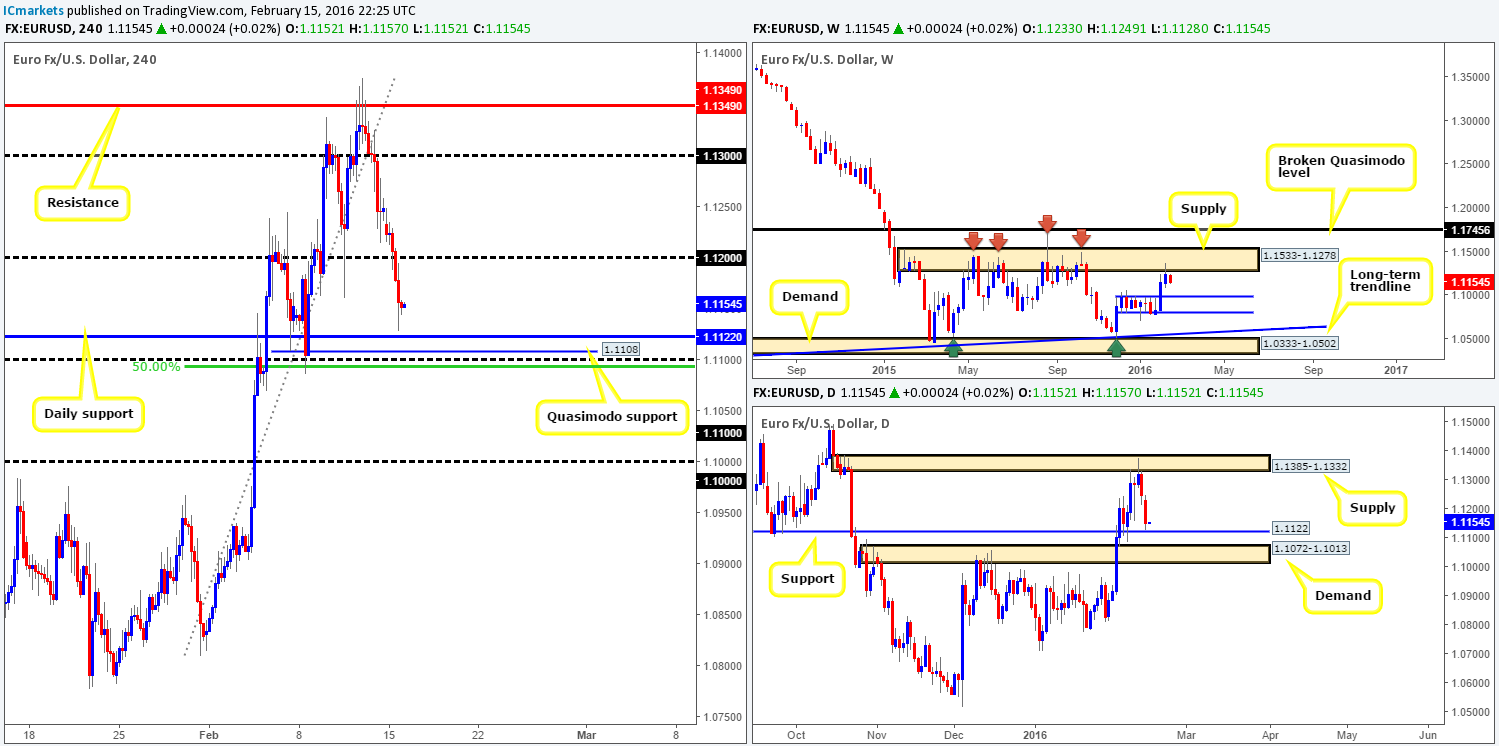
Following Sunday’s open 1.1233 the single currency took on a clear bearish tone, which, as can be seen from the chart, continued throughout the day. Psychological support 1.1200 was taken out (unfortunately no retest was seen to the underside of this number for a trade), and price collapsed to lows of 1.1128 on the day.
From a technical standpoint, as we explained in our previous report (http://www.icmarkets.com/blog/monday-15th-february-weekly-technical-outlook-and-review-u-s-bank-holiday-today/), this sell-off was expected. However, due to this recent movement the tables have slightly turned. Notice that price is now trading within shouting distance of a daily support at 1.1122. Not only that, but below it there is also a H4 Quasimodo support at 1.1108, a psychological support at 1.1100 and a 50.0% Fibonacci support level at 1.1093. Given this collection of structure seen here, we are expecting to see the EUR bounce from this region. How much of a bounce, however, is anybody’s guess. The reason for only expecting a bounce lies within the weekly chart. Supply at 1.1533-1.1278, as you can see, is clearly in play right now and has the potential (room to move lower) to drag this pair down to at least support drawn from 1.0983.
In light of the above, here is our plan of attack for today’s sessions:
- Keep a close eye on how the lower timeframes respond to the H4 1.1122/1.1093 area mentioned above in bold for a confirmed entry long. The most we’d target here is 1.1200.
- When or indeed if price engulfs 1.1100, then our team will shift back into short mode and begin watching for price to retest 1.1100 and print a lower timeframe sell setup. Following a close lower, the path south would, as far as we see, be clear down to the large psychological support 1.1000 (fuses with the top-side of daily demand at 1.1013). A trade below 1.1100 is very attractive due to the fact that weekly flow would be on our side at this point!
Levels to watch/live orders:
- Buys: 1.1122/1.1093 [Tentative – confirmation required] (Stop loss: dependent on where one confirms this area).
- Sells: Watch for bids to be consumed around 1.1100 and look to trade any retest from this area thereafter (lower timeframe confirmation required).
GBP/USD: (Slightly revised)
Starting from the top this morning, weekly action is currently seen hugging the top-side of support penciled in at 1.4429. Should this level hold firm, the next upside target via this timeframe can be seen around the broken Quasimodo level (BQM) at 1.4633. Meanwhile, down on the daily chart, both the buy and sell-side of this market remain sandwiched in between demand seen at 1.4407-1.4350 and resistance coming in at 1.4535. At this point, however, price is seen teasing the demand, so shorting this market is not something we’d be keen on today.
Stepping down to the H4 chart, it is clear to see that price has chalked up a relatively clear range fixed between 1.4395/1.4546. Seeing as how Cable is loitering within the lower limits of this consolidation, and the both the weekly and daily are trading around supports (see above), there is a good chance of a bounce back into the above said range today. For us to be permitted a trade here, we’d need to see a lower timeframe buy setup form at the lower extreme of this range (1.4395). The reason for why is a consolidative environment such as this is prone to fakeouts. Furthermore, should a trade come to fruition, we would be looking to take off 50% of our position at the mid-level resistance 1.4450 due to how responsive it has been in the past. Following this, we’d then look to target 1.4500, followed closely by the upper extreme of the range – 1.4546 to liquidate our full position.
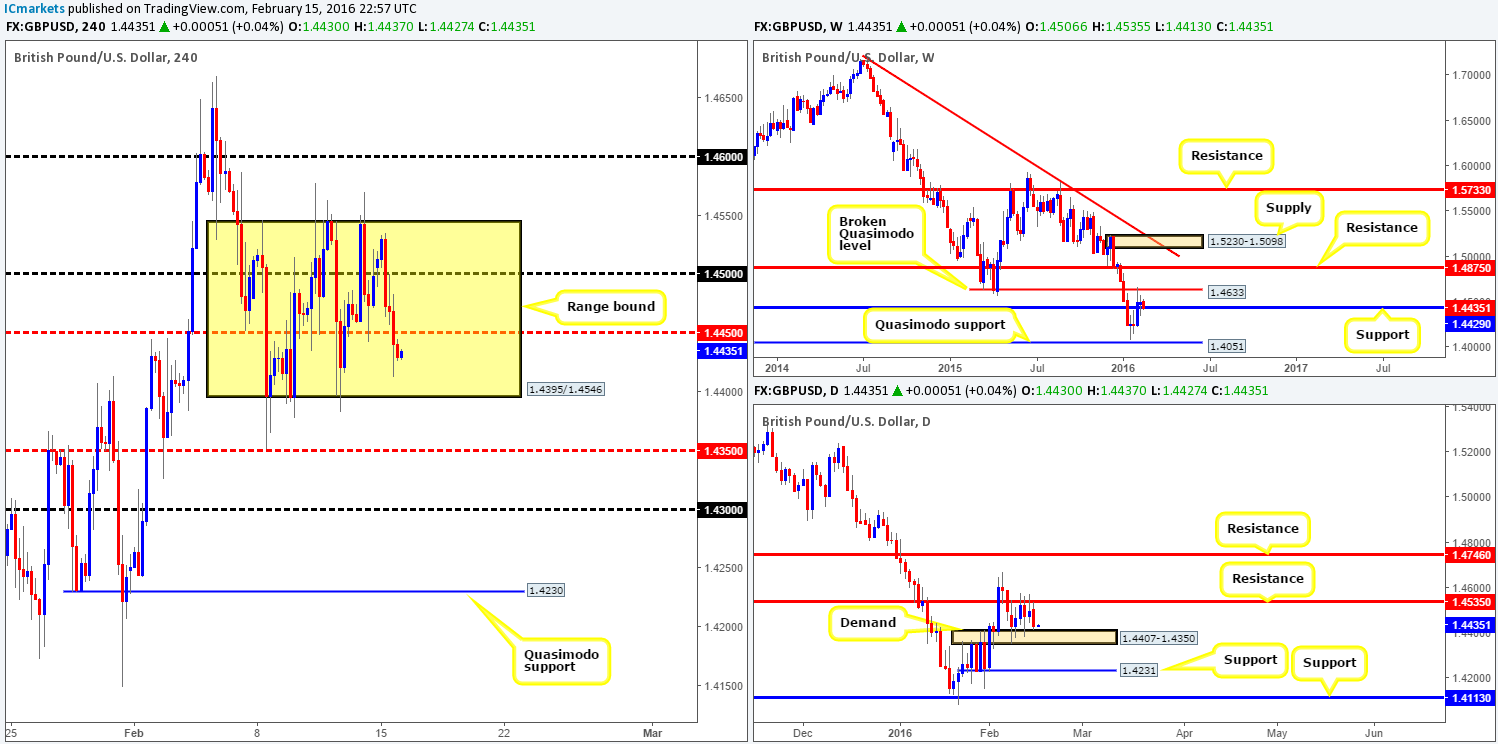
Levels to watch/live orders:
- Buys: 1.4395 [Tentative – confirmation required] (Stop loss: dependent on where one confirms this area).
- Sells: Flat (Stop loss: N/A).
AUD/USD:
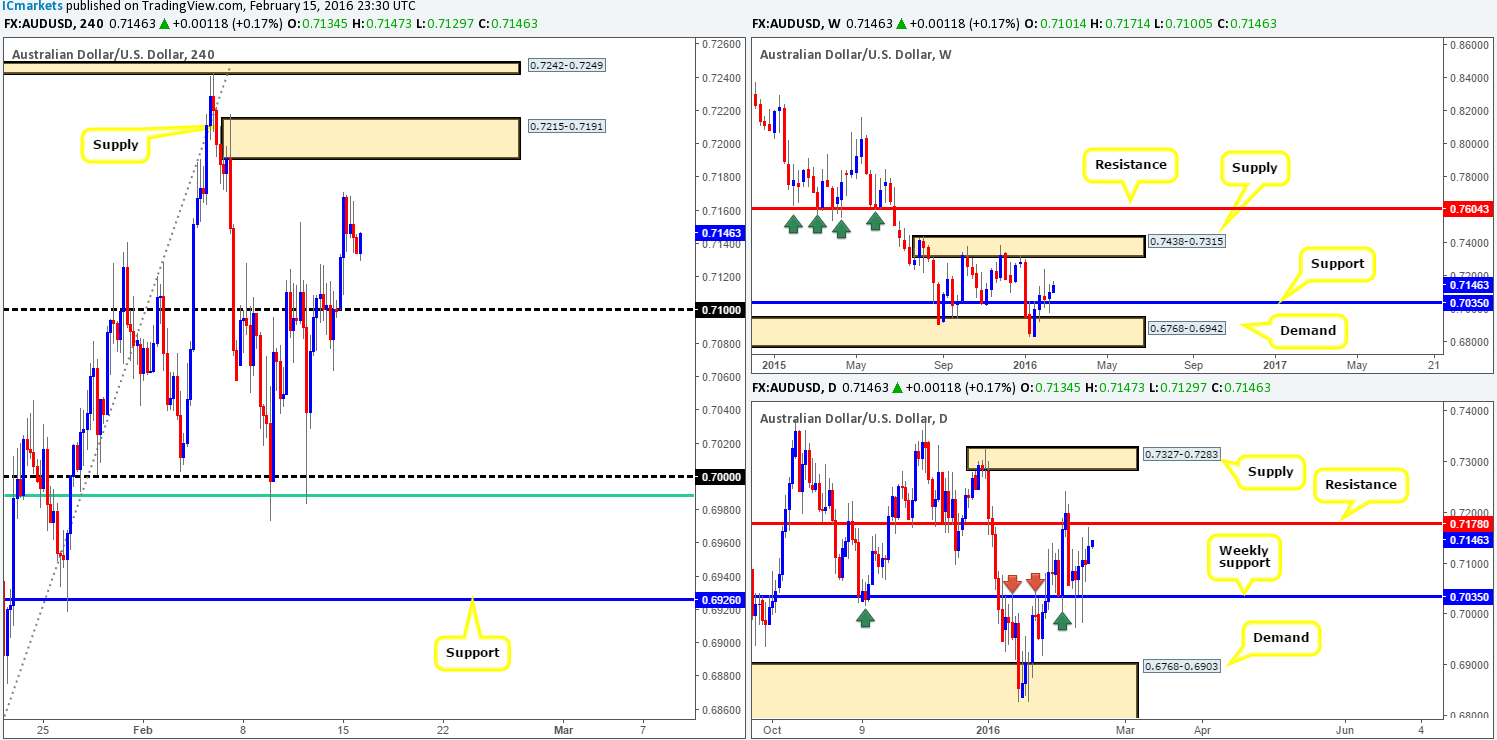
The open 0.7101 saw the AUD/USD bulls go on the offensive yesterday, punching prices to highs of 0.7171 early on in the day. Despite this, the commodity currency saw very little action thereafter, dropping to lows of 0.7134 by the day’s end. For those who read our previous report on the Aussie (http://www.icmarkets.com/blog/monday-15th-february-weekly-technical-outlook-and-review-u-s-bank-holiday-today/) you may recall us mentioning to watch for a H4 close above (and retest) 0.7100 for to enter long. Granted, we got the close but there was no retest, and considering that price has now come so very close to hitting daily resistance at 0.7178, this trade is no longer valid in our opinion.
This is, at least for us, quite a difficult pair to read at the moment. On the one hand, the weekly chart shows price trading from support at 0.7035 and has room to move higher up to supply drawn from 0.7438-0.7315. And on the other hand, as we already mentioned, the daily chart has reacted to just below resistance at 0.7178.Therefore, does one look for shorts and risk selling into weekly flow, or attempt to buy and face the might of daily resistance?!
In the absence of clearer price action, we have decided to take the safest position of them all today – flat.
Levels to watch/live orders:
- Buys: Flat (Stop loss: N/A).
- Sells: Flat (Stop loss: N/A).
USD/JPY:
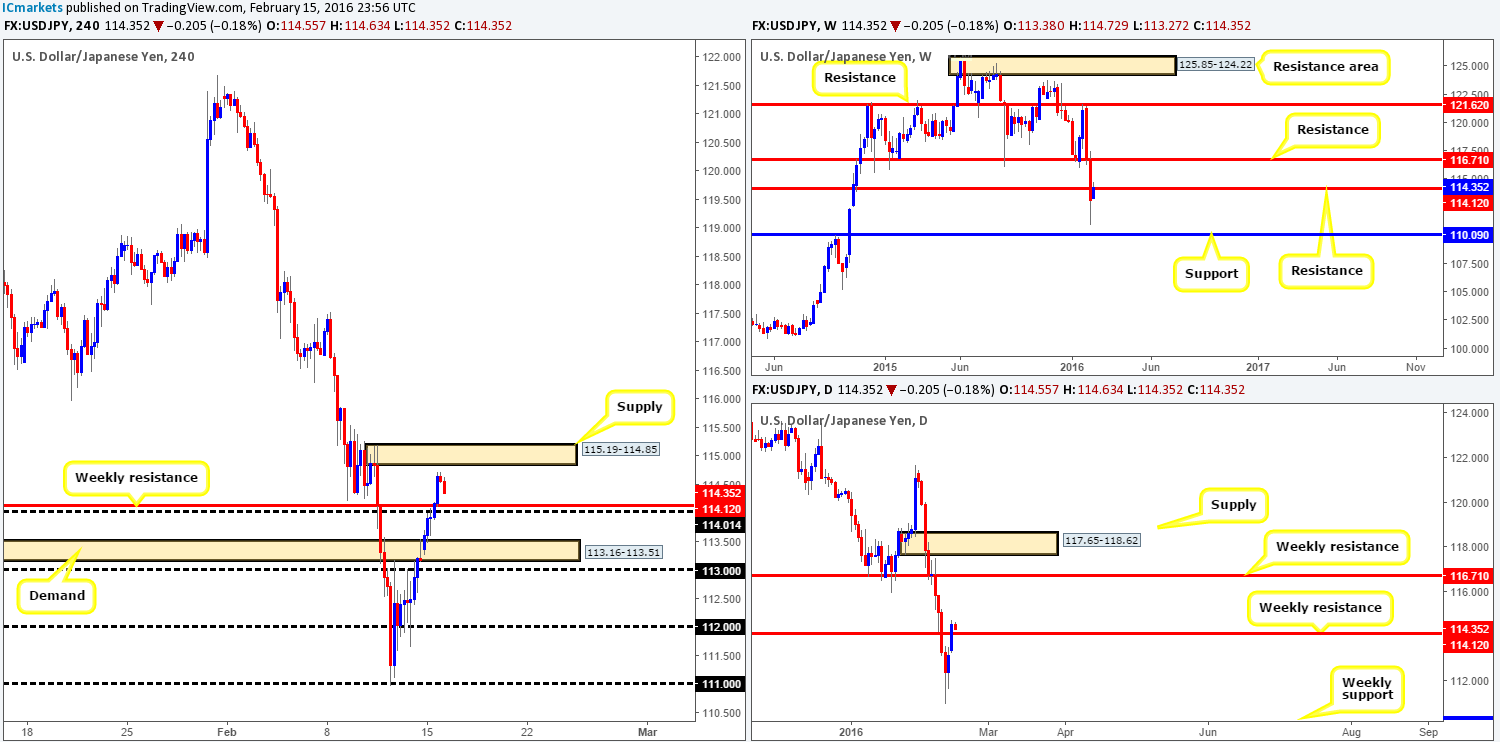
Beginning with a look at the weekly chart this morning, the USD/JPY is seen trading back above 114.12 following last week’s explosive close lower. This, at least in our book, is not a bullish signal since the current candle has four more trading days left until it closes, thus price could very easily continue to dive lower.
Looking down to the daily chart, one can see that there has been a close above the weekly level 114.12 indicating that it is no longer resistance. Although from a daily perspective this is true, we feel that this pair has more red candles to print yet. Nevertheless, if daily action retests this number as support and holds firm by creating new highs, then we’ll look to re-evaluate our approach.
Moving down one more level to the H4 chart, price is seen trading within touching distance of supply chalked up at 115.19-114.85. This area is significant due to how aggressively prices sold off here, and also seeing as it was likely where pro money decided to break below the 114.12 weekly level, hence there’s potentially unfilled sell orders still present here.
Given the points made above, we are going to be looking to short this H4 supply today should prices connect with this area. However, a short will only be possible alongside corresponding lower timeframe confirmation i.e. a break below demand, a trendline break or even a collection of selling tails around a lower timeframe supply… The first take-profit target for this trade is dependent on the H4 approach, as a near-term demand could form prior to hitting our supply zone. In the event that the current supply area fails to hold, however, then this could be an early signal that the 114.12 weekly level is not likely going to provide resistance.
Levels to watch/live orders:
- Buys: Flat (Stop loss: N/A).
- Sells: 115.19-114.85 [Tentative – confirmation required] (Stop loss: dependent on where one confirms this area).
USD/CAD:
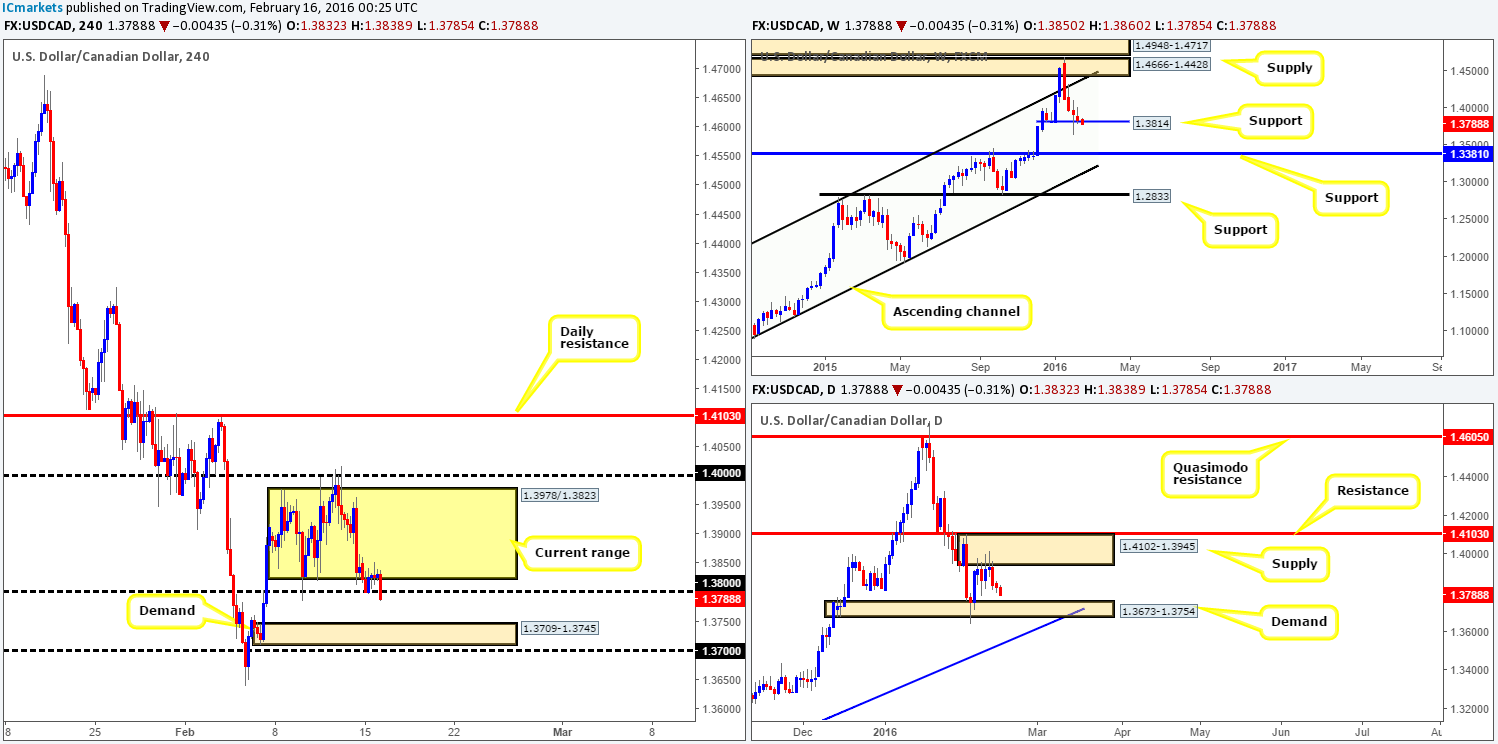
Trade was relatively thin on the USD/CAD during yesterday’s sessions due to the U.S. being on vacation. As you can see, price spent the day consolidating around the lower limit of the current H4 range fixed between 1.3978/1.3823, using the psychological number 1.3800 as additional support.
Given that there is room on the daily picture for a move lower to demand seen at 1.3673-1.3754, and with bids now looking soft around both 1.3800 and weekly support drawn from 1.3814, our team believes that a break lower is possibly going to take place today. This could force the Loonie down to H4 demand at 1.3709-1.3745 (ties in nicely with the above said daily demand). Nevertheless, the distance between 1.3800 and the H4 demand is relatively small and not a move we’d deem tradable unless we are able to enter with a very tight stop loss on the retest of 1.3800.
Levels to watch/live orders:
- Buys: Flat (Stop loss: N/A).
- Sells: Watch for bids to be consumed around 1.3800 and look to trade any retest seen thereafter (lower timeframe confirmation required).
USD/CHF:
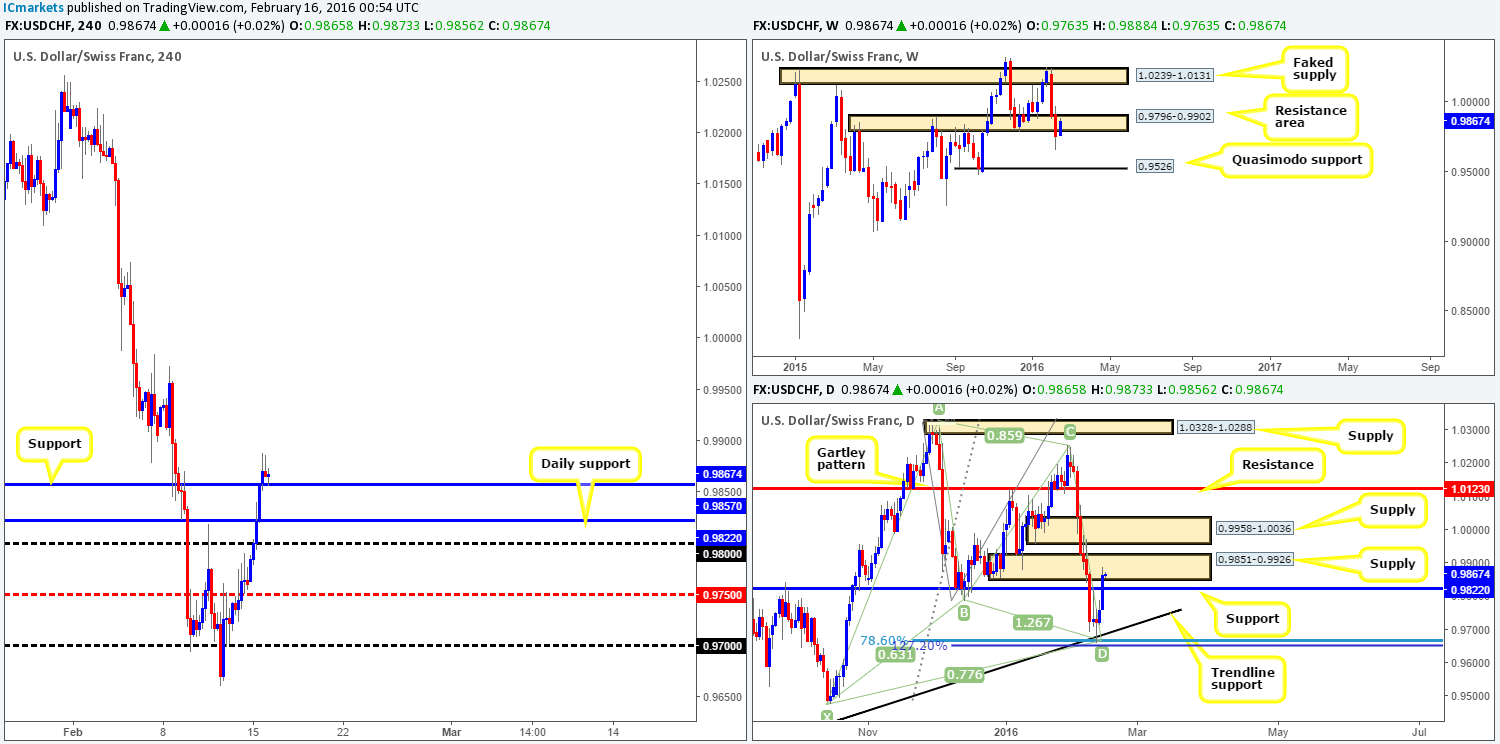
From the weekly chart, we can see that price is now trading relatively high within a resistance area at 0.9796-0.9902, which although is still intact, has seen little to no selling interest form. Breaking into the daily chart, resistance (now acting support) at 0.9822 was taken out yesterday, allowing price to shake hands with supply chalked up at 0.9851-0.9926.
As we move down to the H4 chart, the recently broken resistance level at 0.9857 is being retested as support. Despite the recent surge in buying, we would not deem this a safe support to buy from due to where both the weekly and daily charts show price trading at (see above). That being the case, the only position we’d feel comfortable taking on this pair right now is short. However, in looking to short below the current H4 support, there is only around 30 pips of available profit before hitting daily support mentioned above at 0.9822.
As is evident from the points made above, there is not much in the way of a tradable setup on the Swissy at present. As such, we’ll patiently await further developments on the sidelines today.
Levels to watch/live orders:
- Buys: Flat (Stop loss: N/A).
- Sells: Flat (Stop loss: N/A).
DOW 30:
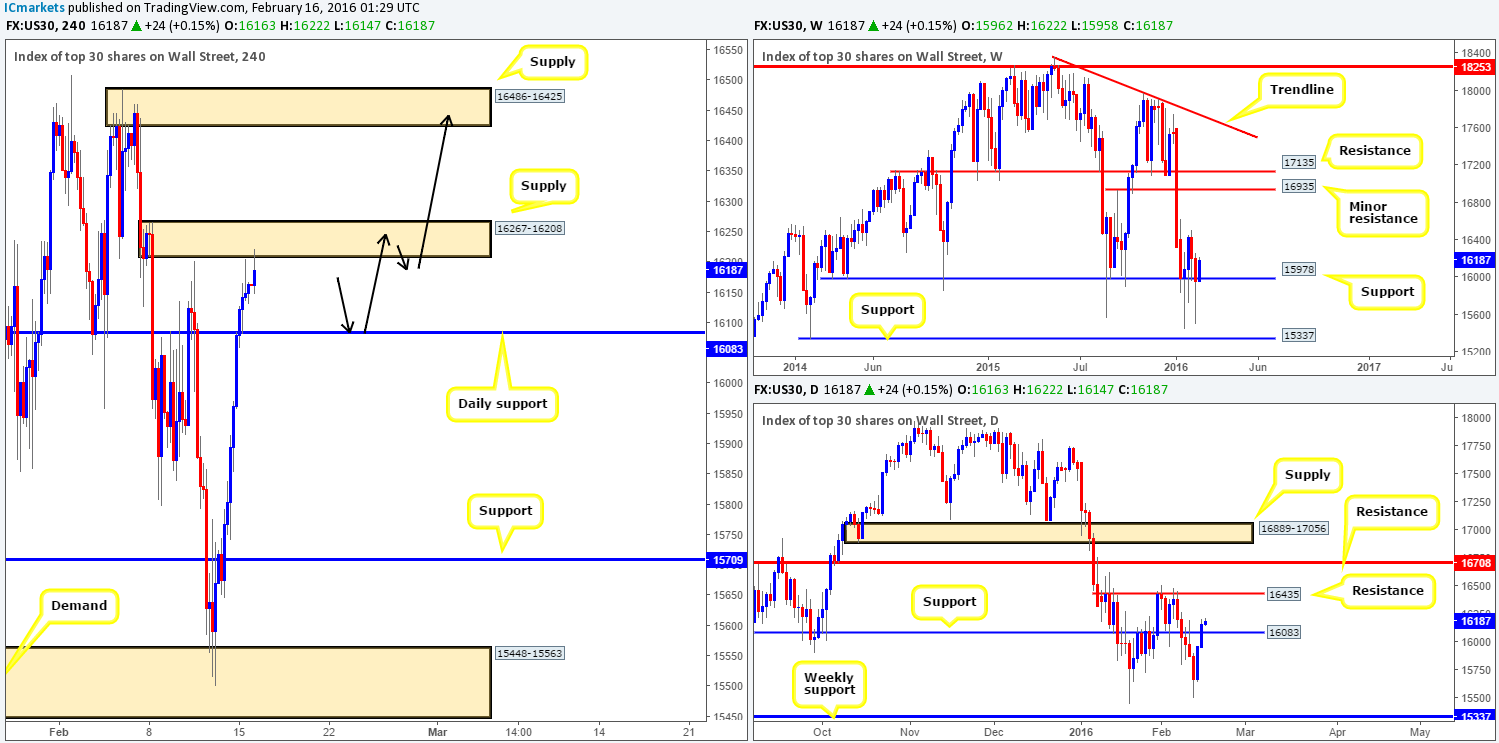
U.S. stocks saw an increase in value yesterday during electronic trading, as Wall Street closed in observance of the U.S. President’s day. This recent surge in buying took out offers from daily resistance at 16083, consequently paving the way for prices to connect with H4 supply at 16267-16208.
Although the DOW is currently selling off from this supply zone, we have absolutely no interest in looking to short from here. The reason for why is that daily support mentioned above at 16083 is lurking just below, and let’s also not forget that weekly support at 15978 is still in play! To that end, our preferred approach today will be on looking for confirmed longs around the 16083 barrier. In the event that our trade comes to fruition today, we’d look to liquidate 30% at the aforementioned H4 supply and look to hold the remaining 70% of the position up to H4 supply at 16486-16425 (as per the black arrows), which converges with daily resistance at 16435.
Levels to watch/live orders:
- Buys: 16083 [Tentative – confirmation required] (Stop loss: dependent on where one confirms this level).
- Sells: Flat (Stop loss: N/A).
XAU/USD: (Gold)
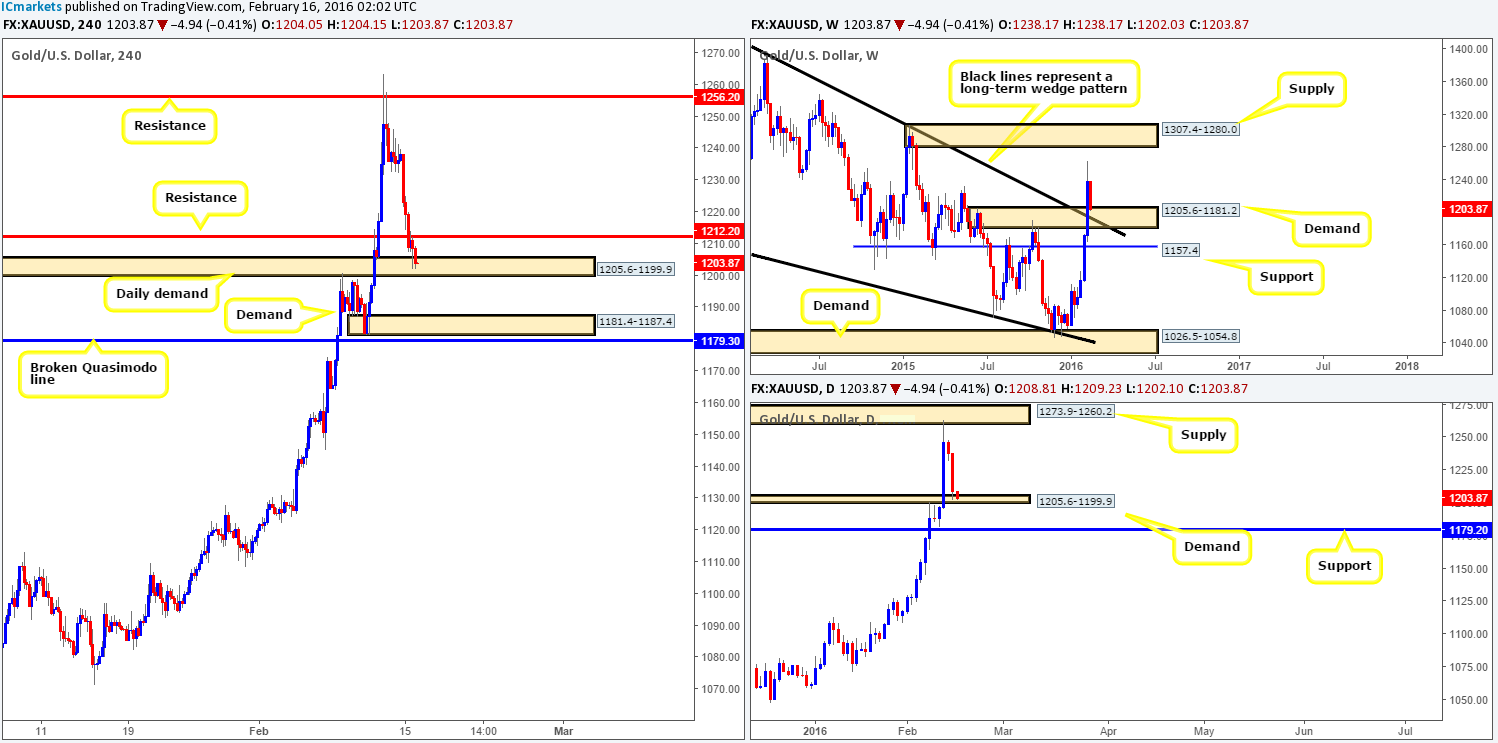
Gold prices took a hit in recent trading, as stocks aggressively rallied on improved market sentiment. Consequent to this recent loss, weekly structure shows price is now trading within demand at 1205.6-1181.2, which blends nicely with the recently broken weekly wedge resistance taken from the high at 1485.3. In addition to this, daily action slammed itself into a small demand drawn from 1205.6-1199.9, which for the time being is holding steady.
Entering long from this area of daily demand is a risky trade in our opinion, since directly above lurks a H4 resistance coming in at 1212.2. A more conservative approach here might be to wait for price to close above this barrier before jumping in long. Furthermore, traders may want to bear in mind that a break below this daily area could also be on the cards today as there’s a beautiful-looking H4 demand at 1181.4-1187.4 just begging to be tagged into the action (sits deep within the weekly demand area mentioned above at 1205.6-1181.2). Therefore, do keep an eye on this barrier today for a possible long trade. This area will, at least for us, need confirmation from the lower timeframes before trading it, as price may fake lower to connect with both the H4 broken Quasimodo line at 1179.3 and daily support at 1179.2 seen just below.
Levels to watch/live orders:
- Buys: 1205.6-1199.9 [A close above 1212.2 is required before a long trade is permitted] (Stop loss: likely below daily demand at 1198.3). 1181.4-1187.4 [Tentative – confirmation required] (Stop loss: dependent on where one confirms this area).
- Sells: Flat (Stop loss: N/A).


