A note on lower timeframe confirming price action…
Waiting for lower timeframe confirmation is our main tool to confirm strength within higher timeframe zones, and has really been the key to our trading success. It takes a little time to understand the subtle nuances, however, as each trade is never the same, but once you master the rhythm so to speak, you will be saved from countless unnecessary losing trades. The following is a list of what we look for:
- A break/retest of supply or demand dependent on which way you’re trading.
- A trendline break/retest. Buying/selling tails – essentially we look for a cluster of very obvious spikes off of lower timeframe support and resistance levels within the higher timeframe zone.
- Candlestick patterns. We tend to only stick with pin bars and engulfing bars as these have proven to be the most effective.
For us, lower timeframe confirmation starts on the M15 and finishes up on the H1, since most of our higher timeframe areas begin with the H4. Stops usually placed 5-10 pips beyond your confirming structures.
EUR/USD:
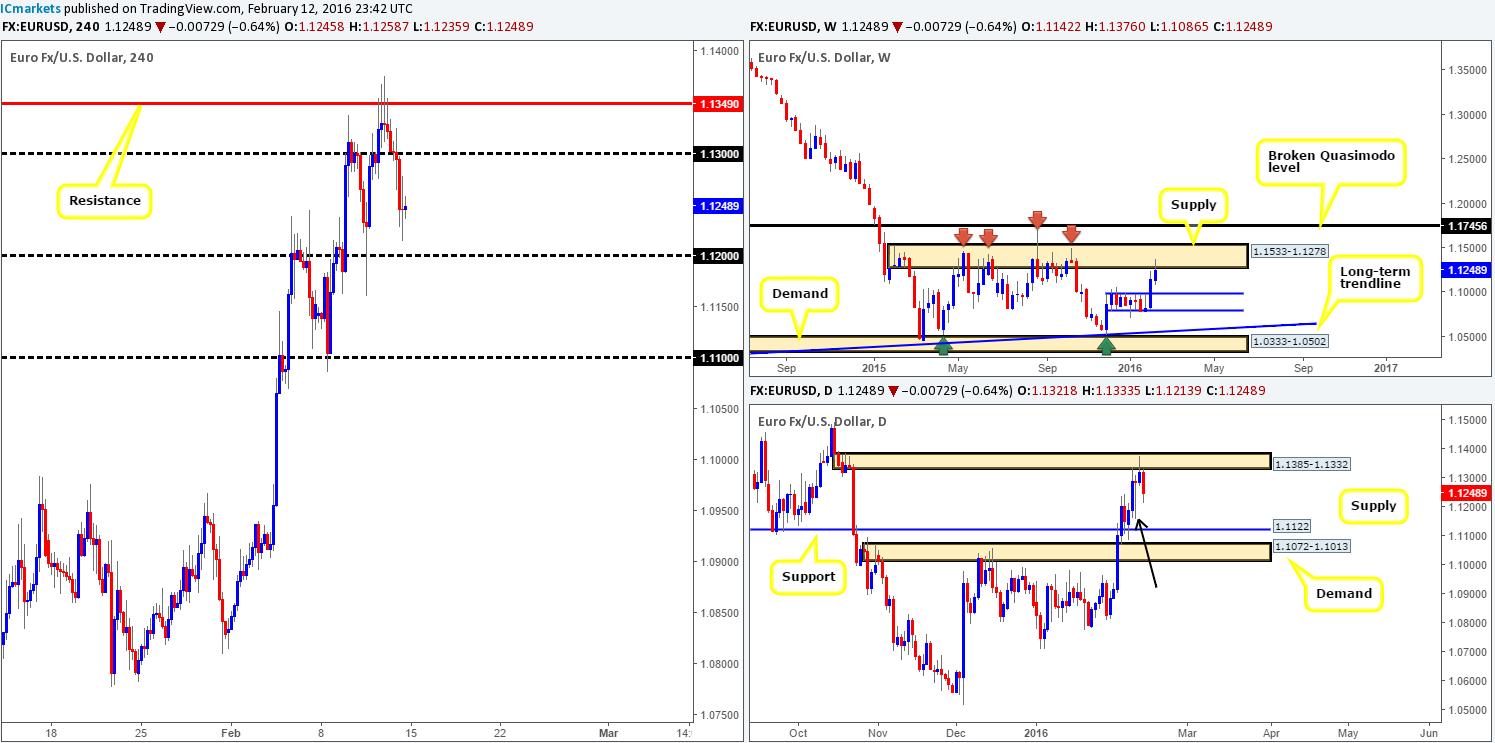
Following the aggressive advance seen two weeks prior, last week’s trading saw the single currency rally another 100 pips (open/close) by the close 1.1248. This, as you can see, lifted weekly price into the underside of supply drawn from 1.1533-1.1278 which has capped upside since early February 2015, so a push above here would be significant in our book. Beyond this area we have our eye on the broken Quasimodo level at 1.1745, while to the downside, support at 1.0983 would likely be the next objective to reach.
Breaking into the daily chart, supply at 1.1385-1.1332 has so far done its job. For those who were following us last week, you may remember that we took a short from here and managed a small profit before being taken out at breakeven. From the week’s closing price on the daily timeframe, it appears the EUR is now free to continue driving lower down to at least support penciled in at 1.1122, followed closely by demand at 1.1072-1.1013. The reason for this is due to Wednesday’s buying tail (black arrow) likely clearing most of the unfilled buy orders within the region thus allowing price to decline further.
On to the H4 chart, Thursday’s selling wicks printed around the underside of resistance at 1.1349, along with better-than-expected U.S. Core retail sales data triggered further selling going into Friday’s sessions. As of this moment, buying the EUR is not something we’d be eager to get involved in especially since both the weekly and daily charts show price trading from supply (see above).
As such, here is our two pips’ worth on where this market may head today and possibly into the week. A convincing close beyond psychological support 1.1200 and a subsequent (confirmed) retest would be an ideal short trade, since there’s little support seen between this barrier and the 1.1100 figure. Mid-level support 1.1150 could come into play, we agree, but seeing as it has had little impact over the past few weeks, we’re labeling it ‘minor’ for the time being. In addition to this, do keep a tab on psychological resistance 1.1300, and the H4 resistance already discussed at 1.1349, as both could be worth shorting (lower timeframe confirmation preferred) from this week due to where higher-timeframe action is currently trading from.
Levels to watch/live orders:
- Buys: Flat (Stop loss: N/A).
- Sells: Watch for bids to be consumed around 1.1200 and look to trade any retest from this area thereafter (lower timeframe confirmation required). 1.1300 [Tentative – confirmation required] (Stop loss: dependent on where one confirms this level). 1.1349 [Tentative – confirmation required] (Stop loss: dependent on where one confirms this level).
GBP/USD:
(Due to the consolidative mood the GBP/USD has been in of late, much of the following report is similar to Friday’s outlook).
Despite Cable ranging close to 230 pips last week, the market remained unchanged at the close 1.4498. Consequent to this, a weekly indecision candle formed on top of a weekly support chalked up at 1.4429. To the upside, we’re going to be keeping a close watch on the broken Quasimodo level (BQM) at 1.4633 as this hurdle could come into play this week. In the event that the current support caves in, however, then the next level in the firing range can be seen at 1.4051 – a Quasimodo support.
From the daily chart, both buy and sell-side of this market have been sandwiched in between demand seen at 1.4407-1.4350 and resistance coming in at 1.4535 for the entire week. A break higher would likely clear the path for prices to challenge the aforementioned weekly BQM level, whereas a break lower could shoot prices down to support sitting at 1.4231. Each daily level we’ve mentioned is significant in our book so all deserve a place on our watch list this week.
Stepping down into the pits of the H4 timeframe, price has been consolidating between supply at 1.4522-1.4545 (encapsulates the aforementioned daily resistance level) and demand at 1.4383-1.4410 (sits within the above said daily demand area) over the past week. As can be seen from the chart, housed within this current range is the 1.4500 figure and mid-level number 1.4450. This, at least from where we’re standing makes it a difficult range to trade since either level could hinder movement. With that, here is what we have jotted down so far…
A break beyond either the H4 supply or demand zone would need to be seen before our team would consider this pair tradable. A break below demand has the psychological support 1.4300 to target, followed closely by a Quasimodo support at 1.4230. Conversely, a break above supply has at least the psychological resistance 1.4600 to reach. Both moves a tradable in our opinion should price retest the broken area (with lower timeframe confirmation) before hitting the above said targets.

Levels to watch/live orders:
- Buys: Watch for offers to be consumed around 1.4522-1.4545 and look to trade any retest seen thereafter (lower timeframe confirmation required).
- Sells: Watch for bids to be consumed around 1.4383-1.4410 and look to trade any retest seen thereafter (lower timeframe confirmation required).
AUD/USD:
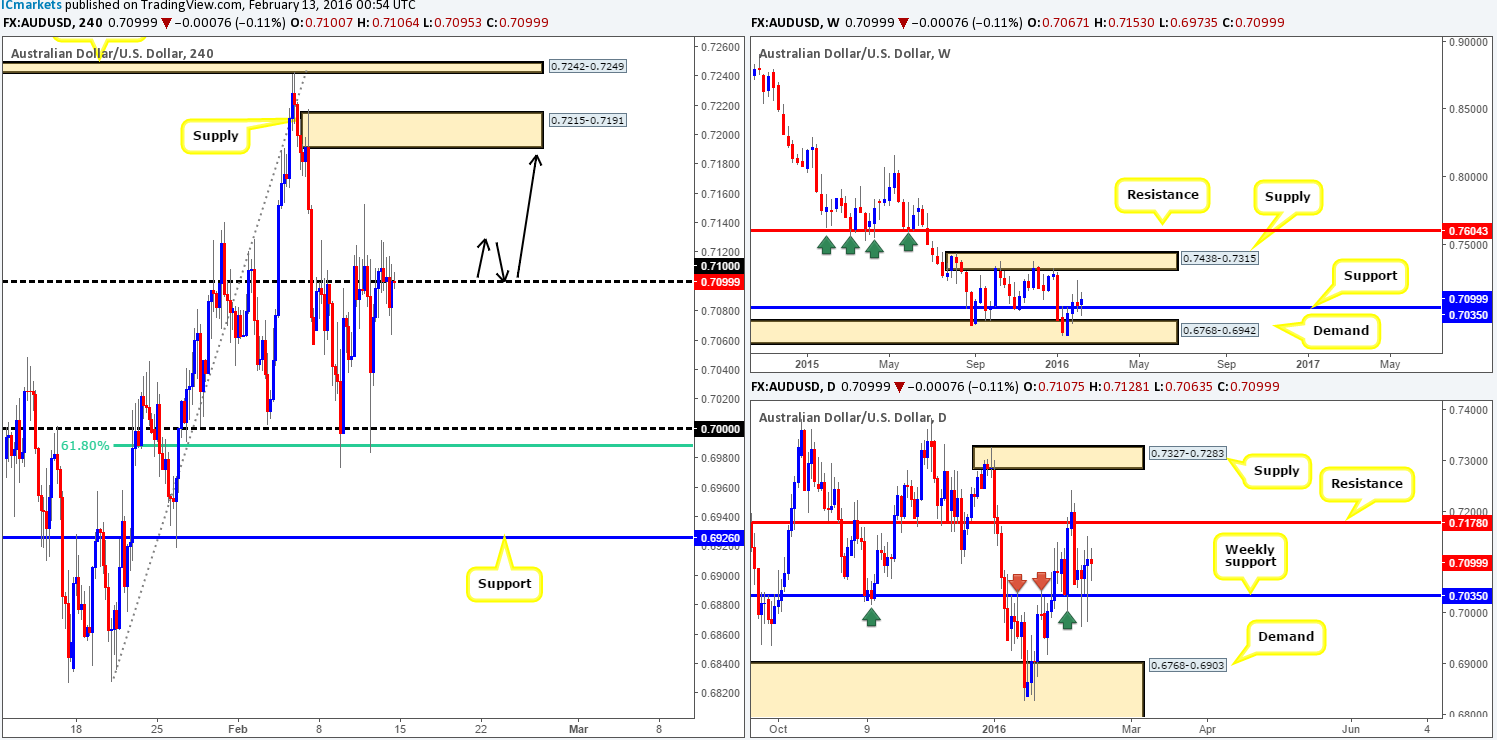
From the weekly chart, the commodity currency held relatively steady above support seen at 0.7035 last week, gaining around 40 pips into the close 0.7099. Above this barrier, the area we have on our watch list currently is supply drawn from 0.7438-0.7315 which has capped upside since August 2015. Beneath the current support, nevertheless, demand can be seen loitering just below at 0.6768-0.6942, which will likely be the next hurdle brought into play should support fail.
Looking down to the daily chart, one can see how well respected the aforementioned weekly support level has been in the past (check out the red and green arrows). What is more, check out the most recent buying tails seen whipsawing through this line. Quite frankly, from a technical standpoint, we see little reason why the Aussie dollar will not rally this week up to at least the underside of daily resistance fixed at 0.7178.
Rolling a page lower to the H4 chart, the 0.7100 region, as you can see, was in the limelight for the best part of last week. Offers appeared to be drying up around this number during Friday’s sessions, however, as price only managed to print a session low of 0.7063 from here. This selling weakness – coupled with the Aussie trading from weekly support (see above), is likely going to force price above 0.7100 this week. In order for us to get in on this potential move north, we’d need to see the H4 convincingly close above the round number and successfully retest this boundary as support (see black arrows). Only then can we begin hunting for lower timeframe confirmed buy entries into this market, targeting H4 supply at 0.7215-0.7191 (sits a few pips above the aforementioned daily resistance level).
Levels to watch/live orders:
- Buys: Watch for offers to be consumed around 0.7100 and look to trade any retest seen thereafter (lower timeframe confirmation required).
- Sells: Flat (Stop loss: N/A).
USD/JPY:
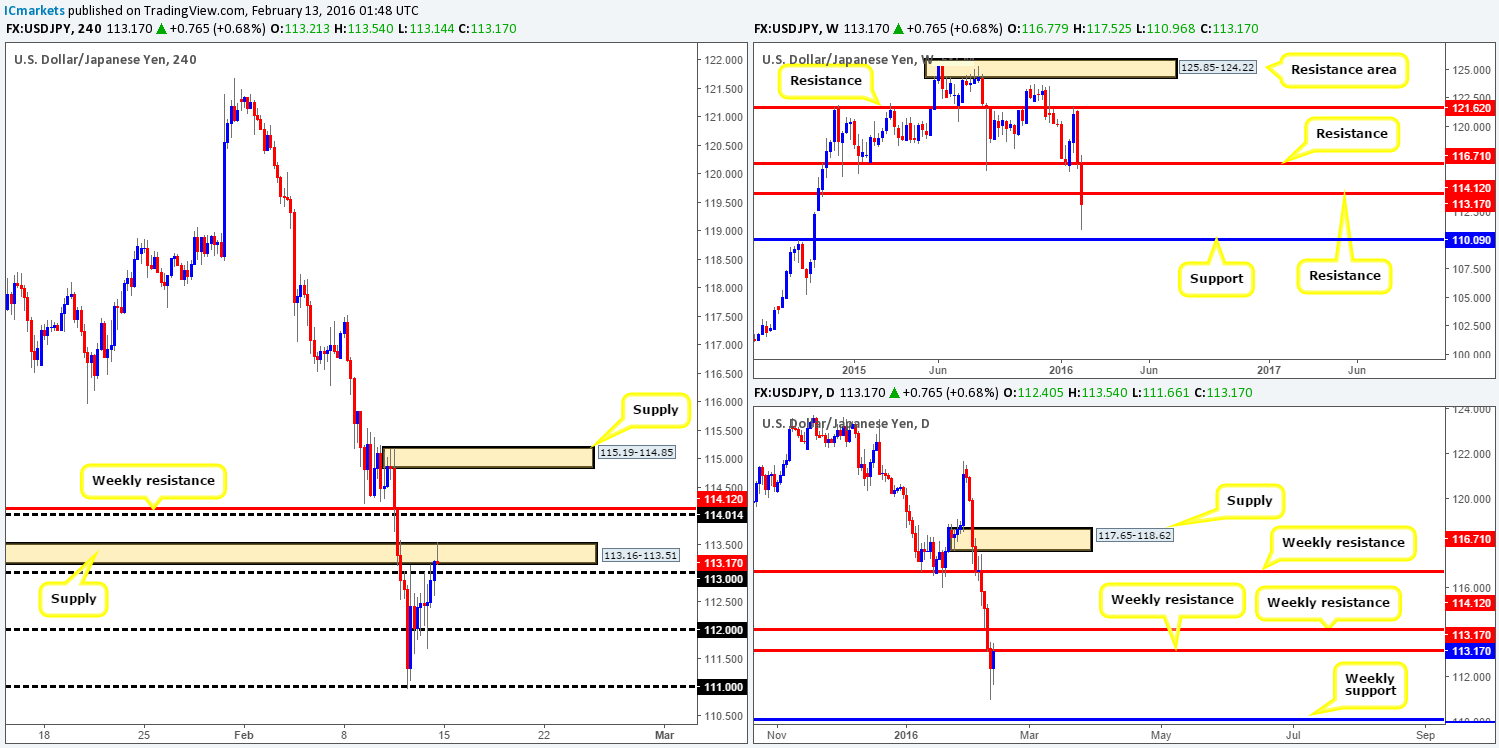
Last week’s sharp run to the downside pushed the USD/JPY pair into further losses, stripping around 360 pips off its value by the week’s close 113.17. This move took out both weekly supports 114.21 and 113.17 which should theoretically act as market resistances now. Assuming that the bears remain dominant this week, we might see this unit test weekly support visible at 110.09.
Branching lower to the daily chart, Friday’s session was the only bullish day this pair has seen over the past two weeks, consequently creating an inside candle pattern. This bullish signal, however, closed directly under the recently broken weekly resistance 113.17, so buying right now may not be the best path to take!
Turning our attention to the H4 chart, we can see that buying pressure began coming in this market on Thursday from psychological support 111.00. The week ended with price painting a bearish selling wick within a small supply seen at 113.16-113.51 (surrounds the weekly resistance level at 113.17).
In view of both the weekly and daily charts showing room for this market to continue dropping lower this week (see above), and the fact that price is now hugging the underside of weekly resistance (see above), selling this pair is the more favored approach this week. However, shorting at the open is not something we’ll be getting involved in for the simple reason that psychological support 113.00 is lurking just below! Ultimately, what we’d like to see today is a close below this number and subsequent retest along with a lower timeframe setup. This will allow us to jump in short targeting at least psychological support 112.00, and possibly much lower as we would look to hang on to this position until the weekly support mentioned above at 110.09.
Levels to watch/live orders:
- Buys: Flat (Stop loss: N/A).
- Sells: Watch for bids to be consumed around 113.00 and look to trade any retest seen thereafter (lower timeframe confirmation required).
USD/CAD:
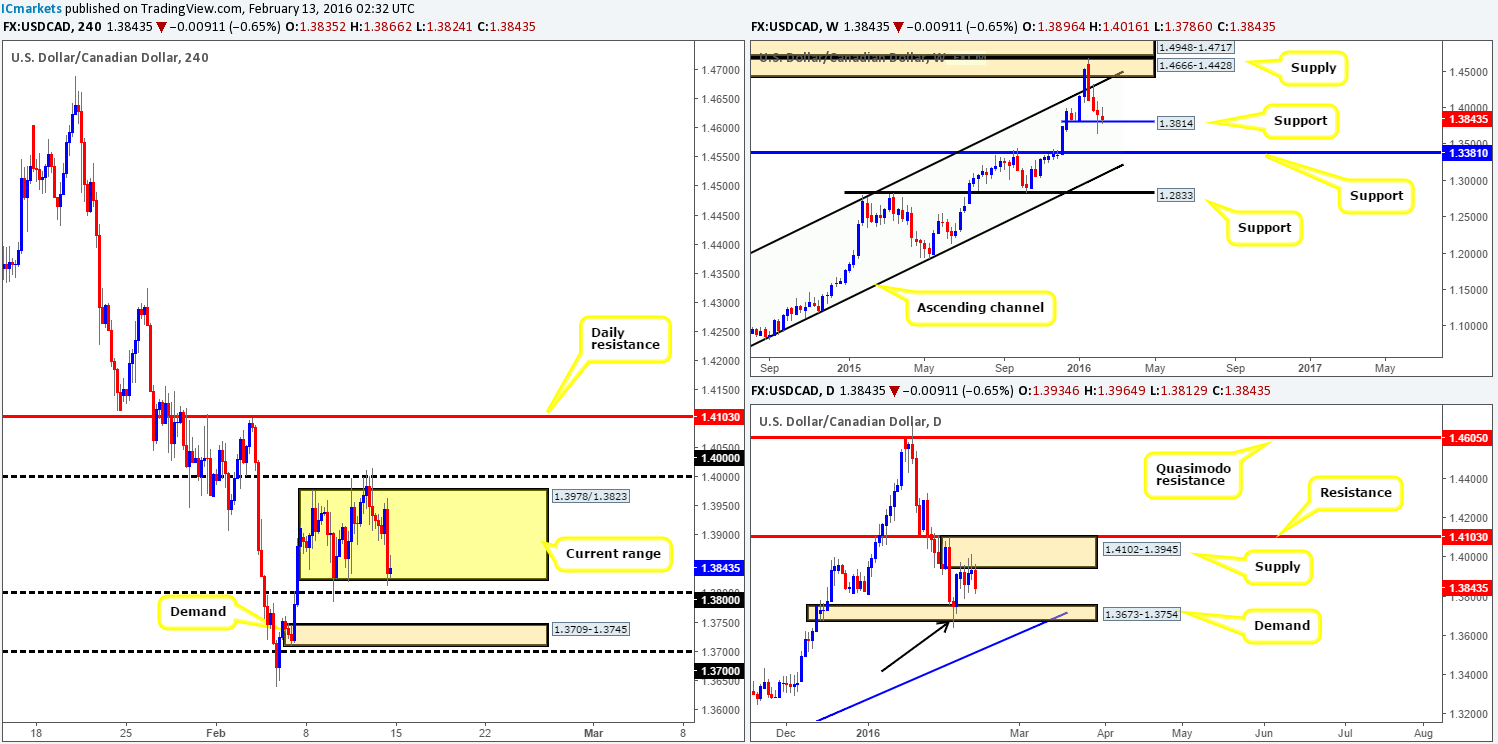
Last week’s 70-pip loss marks the fourth consecutive bearish week for this pair. Weekly support at 1.3814 has been looking very soft these past couple of weeks and could be an indication that further downside is on the cards this week. Beyond this barrier, the next support in the firing range can be seen at 1.3381. It will be interesting to see what the lower timeframe structure has to offer…
From the daily chart, we can see that supply drawn from 1.4102-1.3945 suppressed upside momentum last week. Now, cast your minds back to the 4th of February where daily action whipsawed through demand at 1.3673-1.3754 (black arrow). Supposing that this break took out the majority of buyers within this area, there would appear little to stop this market from dropping lower to test the daily trendline support extended from the low 1.1919 (respected since the 18th June 2015).
Zooming in and looking at the H4 picture, however, we can see that the Loonie has recently entered into a phase of consolidation fixed between 1.3978/1.3823. Beyond this range, there’s the large psychological resistance 1.4000 just above and psychological support at 1.3800 lurking a few pips below. Given the size of this area, it is certainly a tradable zone in our opinion. Therefore, do keep an eye on the extremes of this range for lower timeframe confirmed trading opportunities this week as the risk/reward could work out very favorably indeed!
A break below this range and the psychological support 1.3800, however, could set the stage for a continuation move down to demand at 1.3709-1.3745, which also ties in nicely with the daily demand mentioned above at 1.3673-1.3754. The distance in between these two barriers is relatively small and not something we’d deem tradable unless one was able to enter with a very tight stop loss. A break higher, nonetheless, has the daily resistance line at 1.4103 to target, which is parked one pip above the aforementioned daily supply. The room between these two hurdles is quite attractive. That being the case, a close above and confirmed retest of 1.4000 would be enough for us to jump in long and target the 1.4100 region. Yes, we would be buying into daily supply, but at the same time, we’d also be trading alongside buying momentum from weekly support.
Levels to watch/live orders:
- Buys: 1.3800/1.3823 [Tentative – confirmation required] (Stop loss: dependent on where one confirms this area). Watch for offers to be consumed around 1.4000 and look to trade any retest seen thereafter (lower timeframe confirmation required).
- Sells: 1.4000/1.3978 [Tentative – confirmation required] (Stop loss: dependent on where one confirms this area).
USD/CHF:
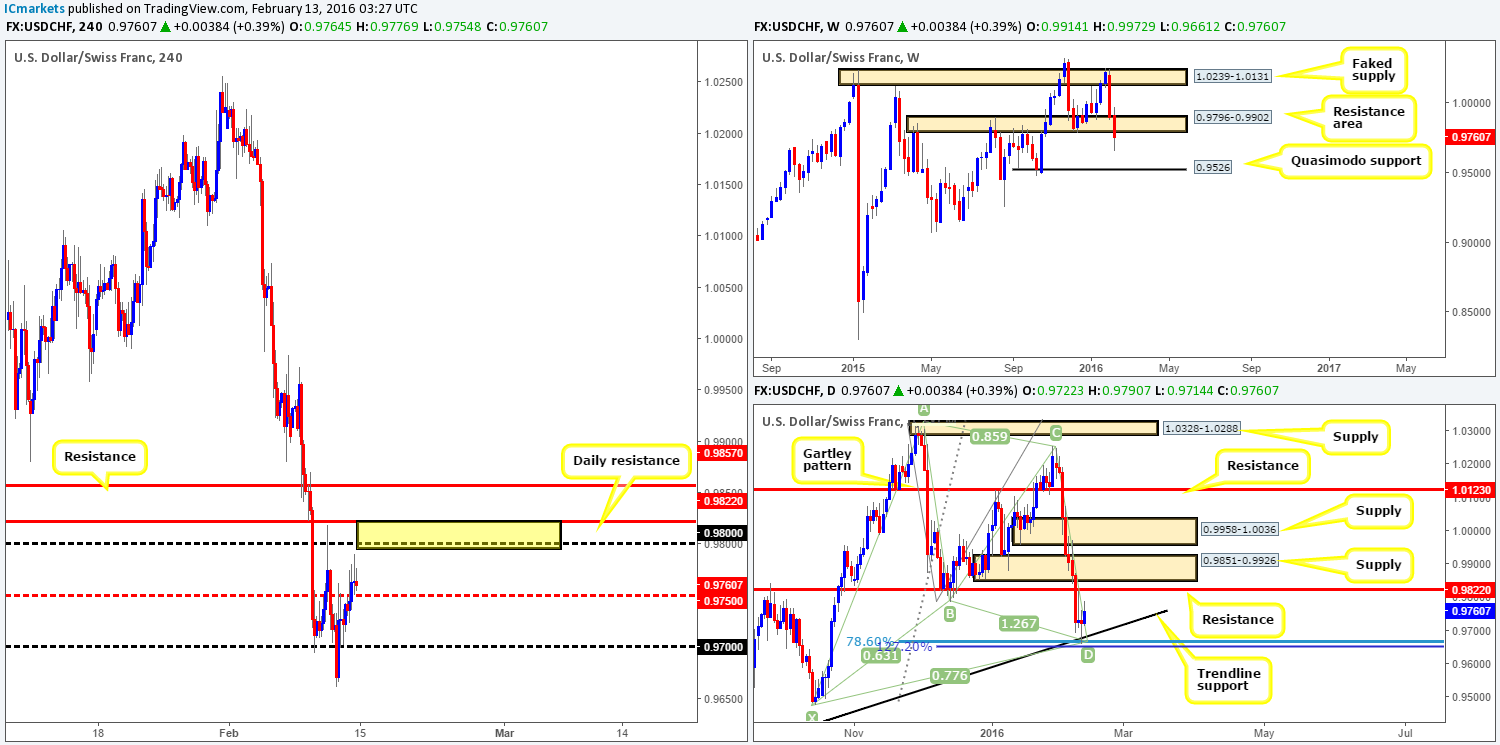
Further losses were seen on the USD/CHF last week, shredding around 150 pips off its value into the close 0.9760. Throughout this bearish onslaught, the weekly support (now acting resistance) area at 0.9796-0.9902 was taken out, potentially opening the gates for prices to challenge the weekly Quasimodo support level at 0.9526 this week.
Moving down to the daily chart, the bullish Harmonic Gartley reversal zone (78.6% Fibonacci level at 0.9669/127.2% Fibonacci extension at 0.9651) has so far responded relatively well. Despite this, there is trouble ahead! Not only do we have the resistance level at 0.9822 nearby, there is also the underside of the recently broken weekly support area to consider at 0.9796. This – coupled with the H4 psychological resistance hurdle at 0.9800 makes this one heck of a ceiling to break through!
We are certainly not suggesting closing out your long positions here. We would, however, advise maybe taking some profit off of the table and moving the stop to breakeven though, since if we have another week like the last two, your trade which is now a winner could end in a loss!
Given this clear area of resistance on the horizon (see above in bold) which is marked on the H4 chart in yellow, we are going to be keeping a close eye on how the lower timeframes respond to this area. If we manage to spot a lower timeframe setup forming, we would, dependent on the time of day, look to sell from here, targeting mid-level support 0.9750 first and foremost.
Levels to watch/live orders:
- Buys: Flat (Stop loss: N/A).
- Sells: 0.9822/0.9796 [Tentative – confirmation required] (Stop loss: dependent on where one confirms this area).
DOW 30:
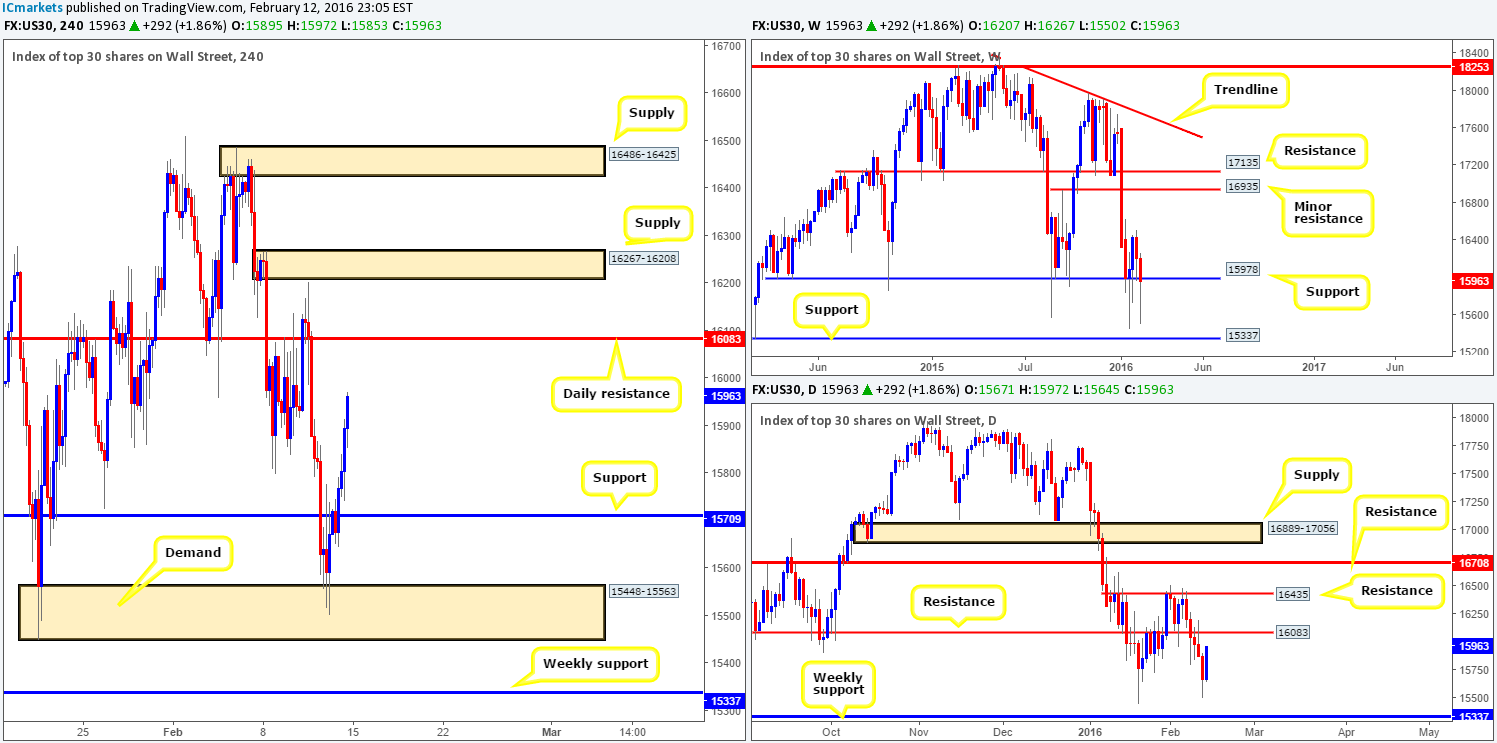
Although U.S. stocks ended the week around 250 points lower, support at 15978 appears to have survived even after dropping to lows of 15502. We’re still skeptical regarding this support since there has been very little meaning registered here over the past month. Nevertheless, we still have an upside target of 16935 logged down in our watch list, and also the support level below at 15337, should the current support cave in.
Climbing down to the daily chart, we can see that after five consecutive losing days, the DOW found support around the 15500 area and erased Thursday’s losses as well as most of Wednesdays into the close 15963. The next upside target we have noted on our watch list is resistance penciled in at 16083.
Shifting a gear lower into the H4 chart, demand at 15448-15563 was the reason (at least technically) for Friday’s corrective move. Resistance (now support) at 15709 was taken out, with price finishing the day at highs of 15972.
Given all of the above points, there is definitely scope for a move higher at least until 16083 – the daily resistance. This will likely be a key number going into this week as a rejection from this level would not only give us an opportunity to sell (with lower timeframe confirmation), but also suggest that the current weekly support is weakening further. Conversely, a close above 16083 on a daily basis could indicate support may be strengthening. There is a H4 supply lurking just above here at 16267-16208, but this will not likely stand much of a chance we feel since the H4 supply just above it at 16486-16425 is the more attractive of the two since it converges with daily resistance at 16435. Therefore on a (daily) close above 16083, we will be looking to enter long on any confirmed retest seen at this number targeting the H4 supply mentioned above at 16486-16425. We would, however, recommend keeping an eye on how the lower timeframe action responds to the H4 supply at 16267-16208 – if selling strength is clear, the trade may not work out to the final target and you will want to move the stop to breakeven a.s.a.p.
Levels to watch/live orders:
- Buys: Watch for offers to be consumed around 16083 and look to trade any retest seen thereafter (lower timeframe confirmation required).
- Sells: 16083 [Tentative – confirmation required] (Stop loss: dependent on where one confirms this level).
XAU/USD: (Gold)
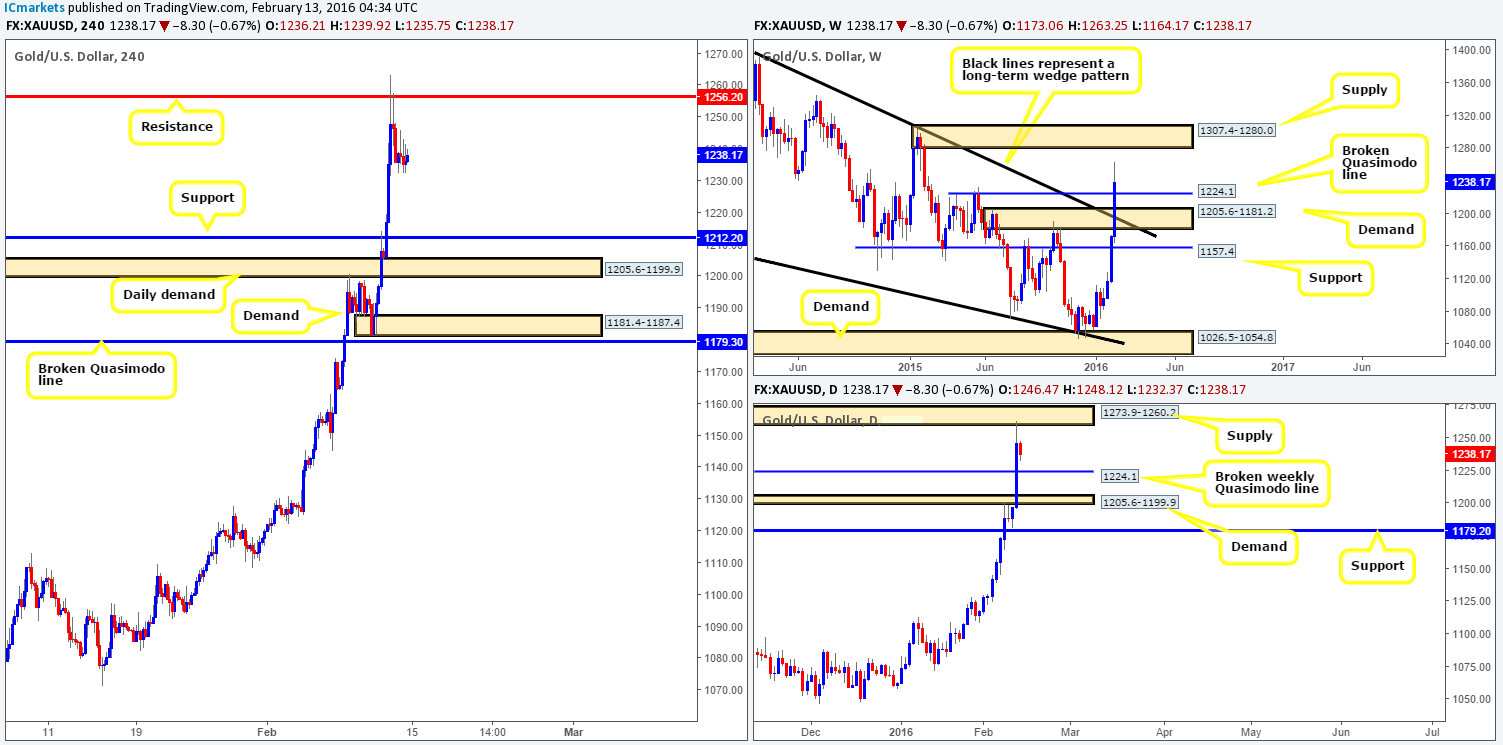
The yellow metal was truly on fire last week! Several weekly resistances were taken out, before Gold finally ended the week closing at 1238.1, registering a very healthy $65 gain. In view of this recent movement, the weekly broken Quasimodo (BQM) line at 1224.1 could potentially act as support this week, as could the weekly demand just below it at 1205.6-1181.2 (fuses with the recently broken weekly wedge resistance taken from the high at 1485.3). The next upside target we have on our radar this week is supply drawn from 1307.4-1280.0.
On the flip side, daily flow slammed right into the underside of supply drawn from 1273.9-1260.2 (not visible on the weekly chart) on Thursday, which saw bearish follow-through on Friday. This could, as we mentioned in Friday’s report, force the yellow metal to retreat back down to the broken weekly Quasimodo line at 1224.1 sometime this week.
Winding down one more level to the H4 chart, resistance at 1256.2 (housed within the aforementioned daily supply) was brought into the action on Thursday, which saw price enter into a tight phase of consolation on Friday between 1235.0/1238.4. As can be seen from the chart, there is little seen stopping this unit from tumbling lower down to support visible at 1212.2 this week. Therefore, the closest support structure to have on your watch list should be the broken weekly Quasimodo line discussed above at 1224.1 (see above).
Similar to Friday’s report, we see very little opportunity to trade this market right now unless price retreats back up to the above said H4 resistance, or connects with the aforementioned broken weekly Quasimodo line. Therefore, do keep a close eye on both structures during the week as they may provide a nice base in which to look for confirmed entries into this market later on.
Levels to watch/live orders:
- Buys: 1224.1 [Tentative – confirmation required] (Stop loss: dependent on where one confirms this level).
- Sells: 1256.2 [Tentative – confirmation required] (Stop loss: dependent on where one confirms this level).


