
A note on lower timeframe confirming price action…
Waiting for lower timeframe confirmation is our main tool to confirm strength within higher timeframe zones, and has really been the key to our trading success. It takes a little time to understand the subtle nuances, however, as each trade is never the same, but once you master the rhythm so to speak, you will be saved from countless unnecessary losing trades. The following is a list of what we look for:
- A break/retest of supply or demand dependent on which way you’re trading.
- A trendline break/retest.
- Buying/selling tails – essentially we look for a cluster of very obvious spikes off of lower timeframe support and resistance levels within the higher timeframe zone.
- Candlestick patterns. We tend to only stick with pin bars and engulfing bars as these have proven to be the most effective.
For us, lower timeframe confirmation starts on the M15 and finishes up on the H1, since most of our higher timeframe areas begin with the H4. Stops usually placed 5-10 pips beyond your confirming structures.
EUR/USD:
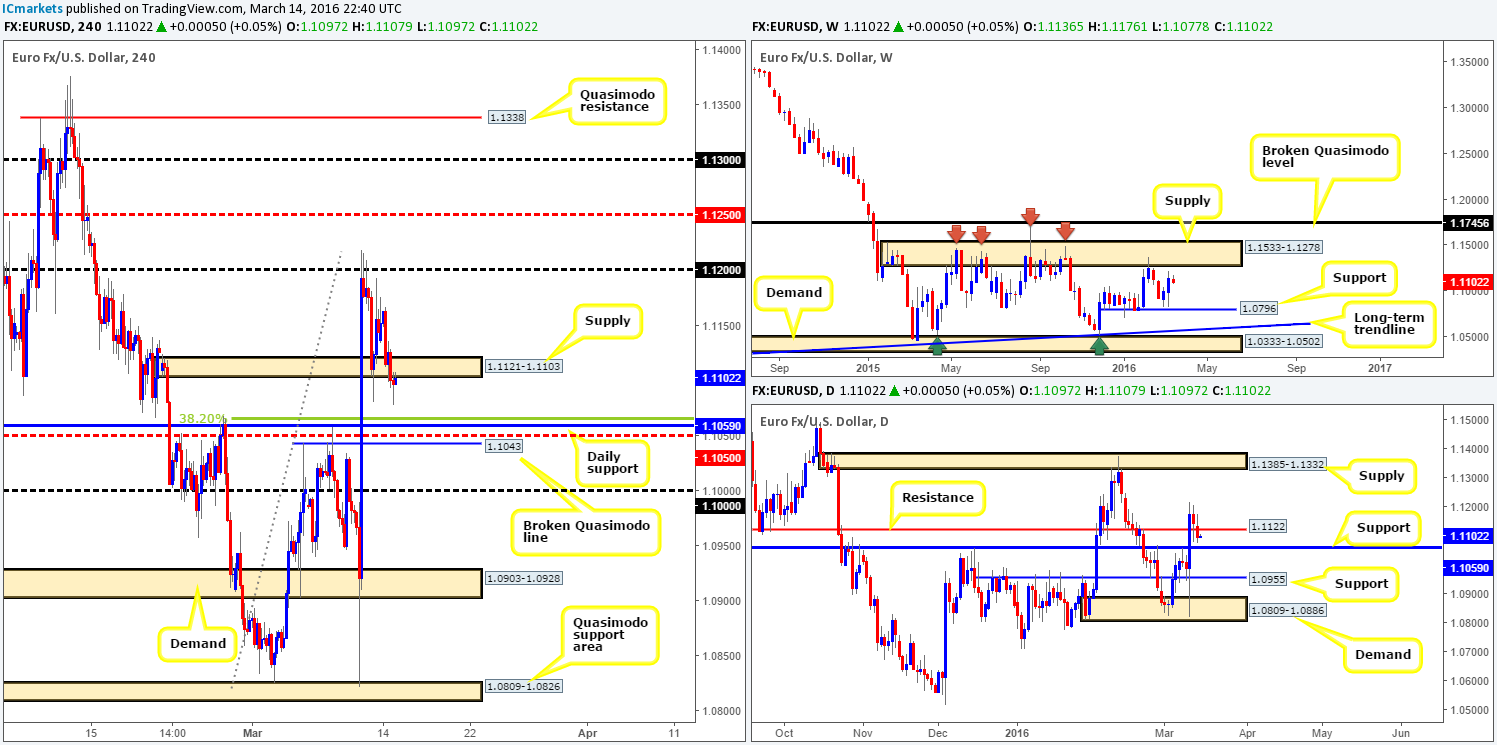
As can be seen from the H4 chart this morning, the EUR/USD recently closed below demand at 1.1121-1.1103, which is now being retested as supply. Alongside this, we saw daily action close the day below support (now acting resistance) at 1.1122, potentially clearing the path south down to support at 1.1059.
Now, looking back across to the H4 chart, the 1.1059 daily level is quite notable from a technical perspective: a 38.2% Fibonacci level at 1.1065, a mid-level support at 1.1050 and a broken Quasimodo line at 1.1043 all converge around this barrier. In addition to this confluence, we like the fact that weekly price has yet to reach supply at 1.1533-1.1278, suggesting the single currency still has room to the upside.
Therefore, 1.1065/1.1043 is a H4 area we’ll be keeping an eye on today for longs. We would, however, prefer to see a lower timeframe buy setup form within this region before entering into a buy position here due to the rather large psychological support sitting just below at 1.1000, which price may visit before reversing north. As of this point, we’d look to target the H4 supply at 1.1121-1.1103 as our first take-profit zone.
Levels to watch/live orders:
- Buys: 1.1065/1.1043 [Tentative – confirmation required] (Stop loss: dependent on where one confirms this area).
- Sells: Flat (Stop loss: N/A).
GBP/USD:
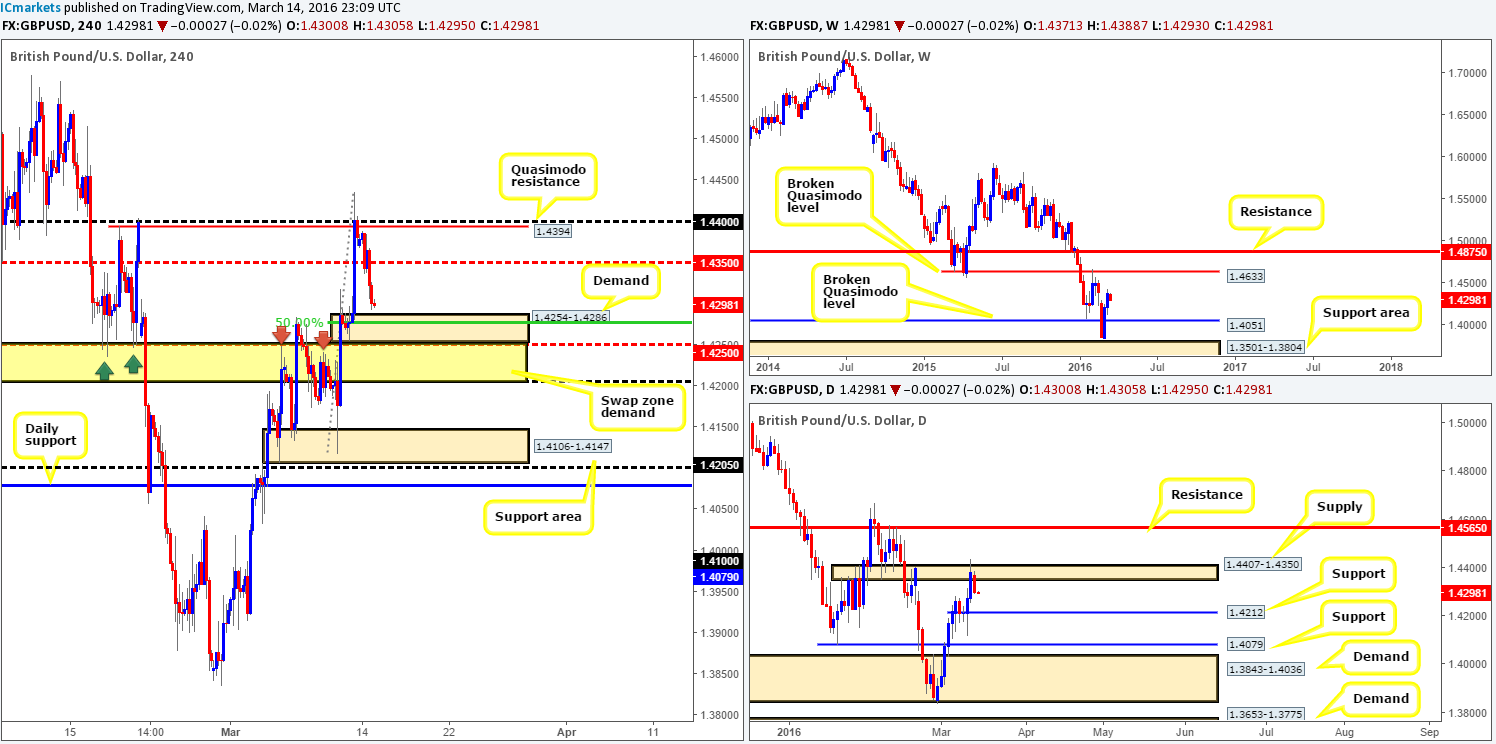
The GBP/USD bears went on the offensive during the course of yesterday’s sessions. Bids were erased from the mid-level support 1.4350, resulting in price closing the day just above a H4 demand zone drawn from 1.4254-1.4286. If you ask us, this barrier looks reasonably attractive for a bounce today owing to it fusing with a 50.0% Fibonacci level at 1.4278 and also being bolstered by a mid-level support penciled in at 1.4250.
Nevertheless, placing a pending buy order on top of this area with your stops just below might not be the most efficient way to approach this zone. The reason we say this is because between 1.4250 and the 1.4200 figure there is a clear swap zone present as highlighted by the arrows in the yellow box. On top of this, the 1.4200 number aligns with daily support at 1.4212 thus possibility acting as a magnet for price. In view of this, one needs to be prepared for at least a fakeout of the H4 demand before price reverses north. In order to deal with the possibility of a fakeout here, our team will only enter long should we manage to spot a lower timeframe setup on the M30 or M60 chart. This way we’ll likely avoid any whipsaw the market may throw at us and also be able to take advantage of any rally that may be seen!
Levels to watch/live orders:
- Buys: 1.4254-1.4286/1.4250-1.4200 [Watch lower timeframe price action within these areas for a possible long entry] (Stop loss: dependent on where one confirms this area).
- Sells: Flat (Stop loss: N/A).
AUD/USD:
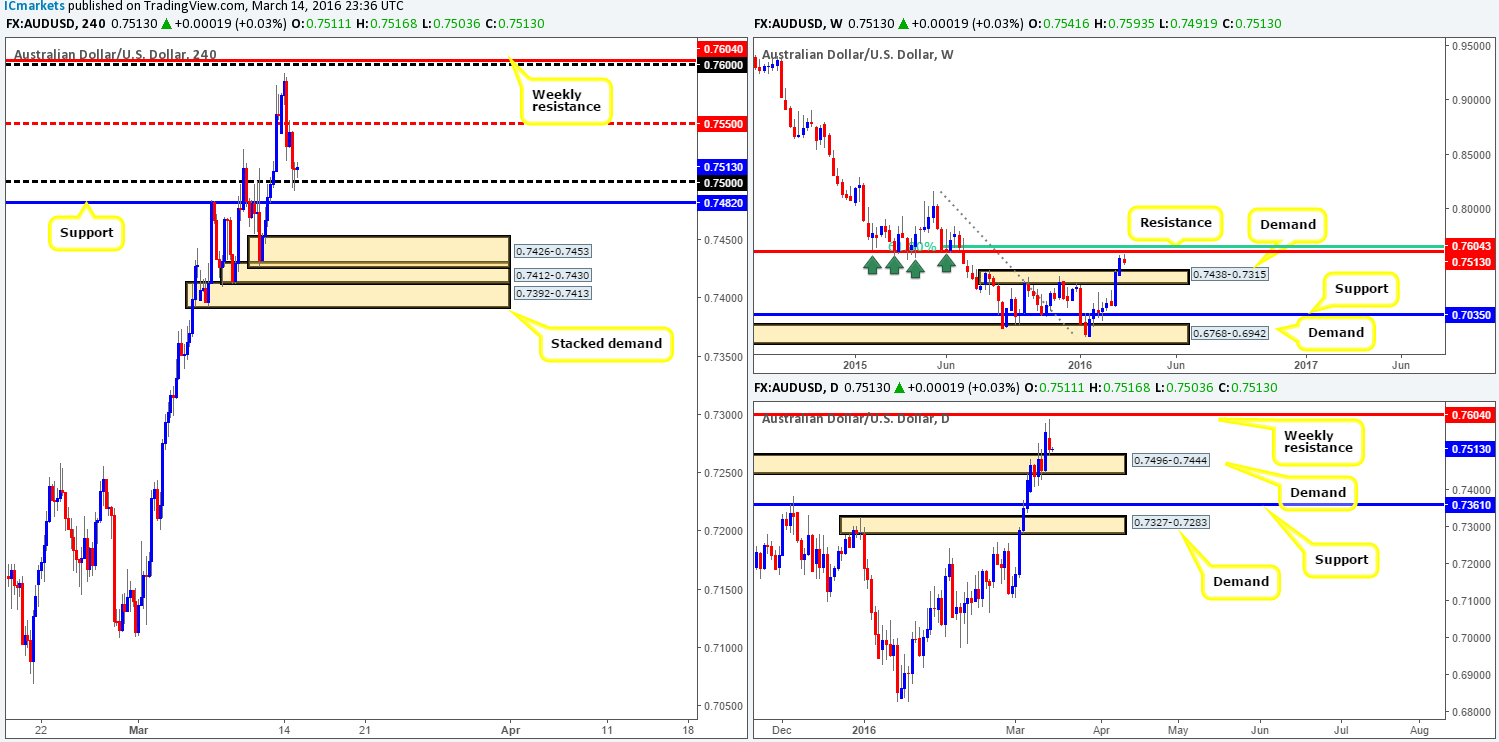
Following Sunday’s open 0.7541, the commodity retested mid-level support 0.7550 and quickly rallied to highs of 0.7593 early on in the session. As we can see, price missed the 0.7600 figure and by the same token, the weekly resistance level at 0.7604 by only a few pips (which was where we were looking to short as mentioned in our previous report here: http://www.icmarkets.com/blog/monday-14th-march-weekly-technical-outlook-and-review/) before turning red for the remainder of the day.
Now, taking into account that the RBA is set to take the stage in a few hours from now, and price is trading from the 0.7500 figure along with the support of a daily demand at 0.7496-0.7444, it’s difficult to see how today’s action will play out. Reason being is at this point we have weekly sellers likely jumping on board and daily/ H4 buyers looking to go long (see above in bold). Therefore, opting to stand on the sidelines here, at least until the RBA monetary policy meeting is done and dusted, may very well be the best path to take.
Levels to watch/live orders:
- Buys: Flat (Stop loss: N/A).
- Sells: Flat (Stop loss: N/A).
USD/JPY:
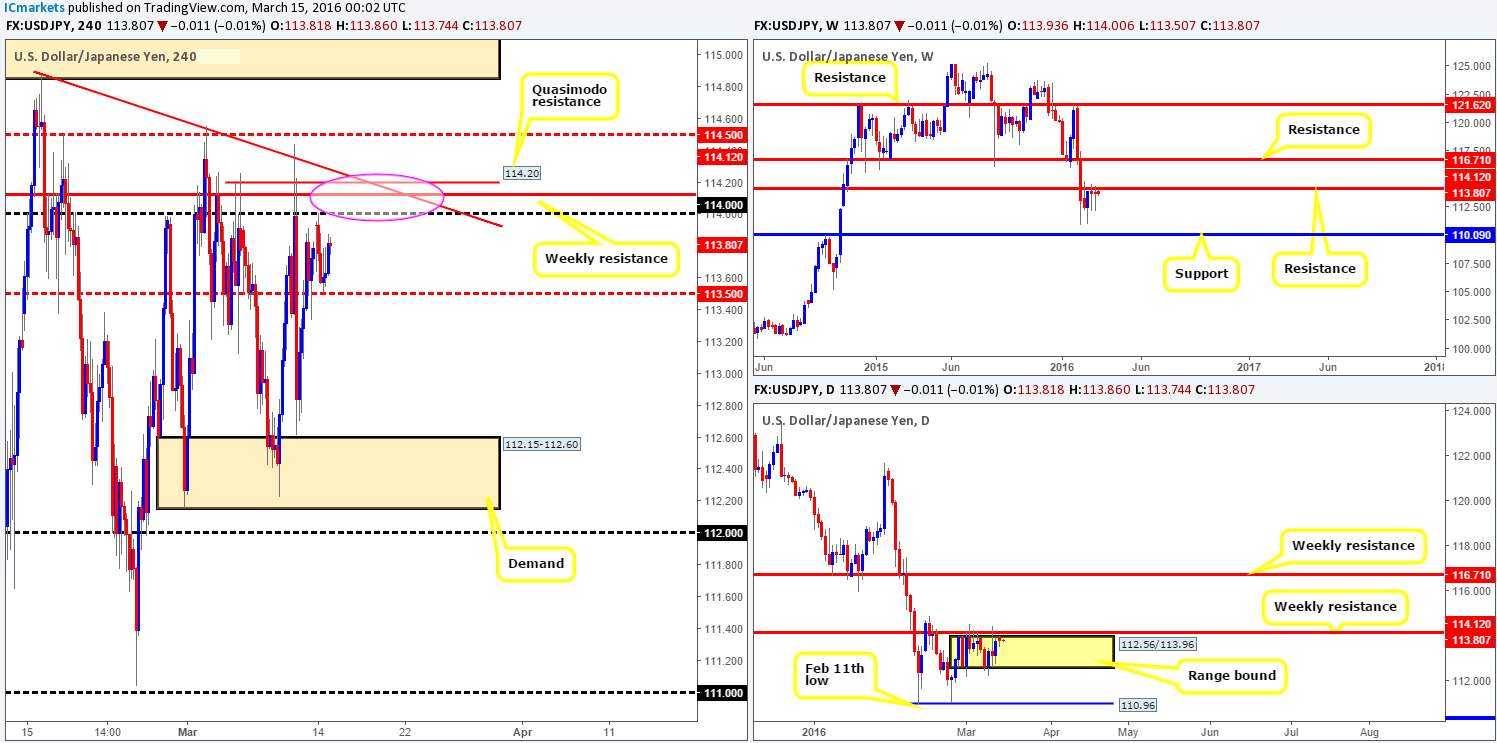
The open 113.93 saw the pair eventually touch gloves with the 114.00 figure before collapsing to lows of 113.50, which saw price modestly recover back up to highs of 113.87 by the day’s end. Given the rather lackluster performance seen of late, much of the following report will be similar to Mondays…
From the weekly chart, back-to-back buying tails have printed beneath the current weekly resistance barrier at 114.12, suggesting offers might be drying up. Despite this, it will only be once we see a close above this roadblock will it be confirmed that the buyers are gaining position.
It’s clear from the daily chart that the two buying tails on the weekly have chalked up a relatively compact range fixed just below the weekly resistance level at 112.56/113.96. A violation of the lower limits of this consolidation, as far as we can see, opens the doors for a potential move down to the 110.96 region (the Feb 11th low).
Right now, the only interesting area that remains in view is seen between 114.20 – a Quasimodo resistance, and the 114.00 figure (the bounce from this number yesterday was too quick for us to lock in a sell position with lower timeframe confirmation). Reason being is in between here sits the weekly resistance level at 114.12 and a converging trendline extended from the high 114.87. This is certainly an area we are interested in shorting this week, with the mid-level number 113.50 in mind as a first target. The only grumble with this trade is the buying tails which formed on the weekly chart! To that end, the most logical path we see here is to wait for price to connect with our pre-determined H4 sell zone and only enter alongside a lower timeframe sell setup. We must also point out that even with the added confluence of lower timeframe confirmation here, stops will be placed above the mid-level barrier 114.50 to give the trade room to breathe.
Levels to watch/live orders:
- Buys: Flat (Stop loss: N/A).
- Sells: 114.20/114.00 region [Tentative – confirmation required] (Stop loss: dependent on where one confirms this area, but best kept above 114.50).
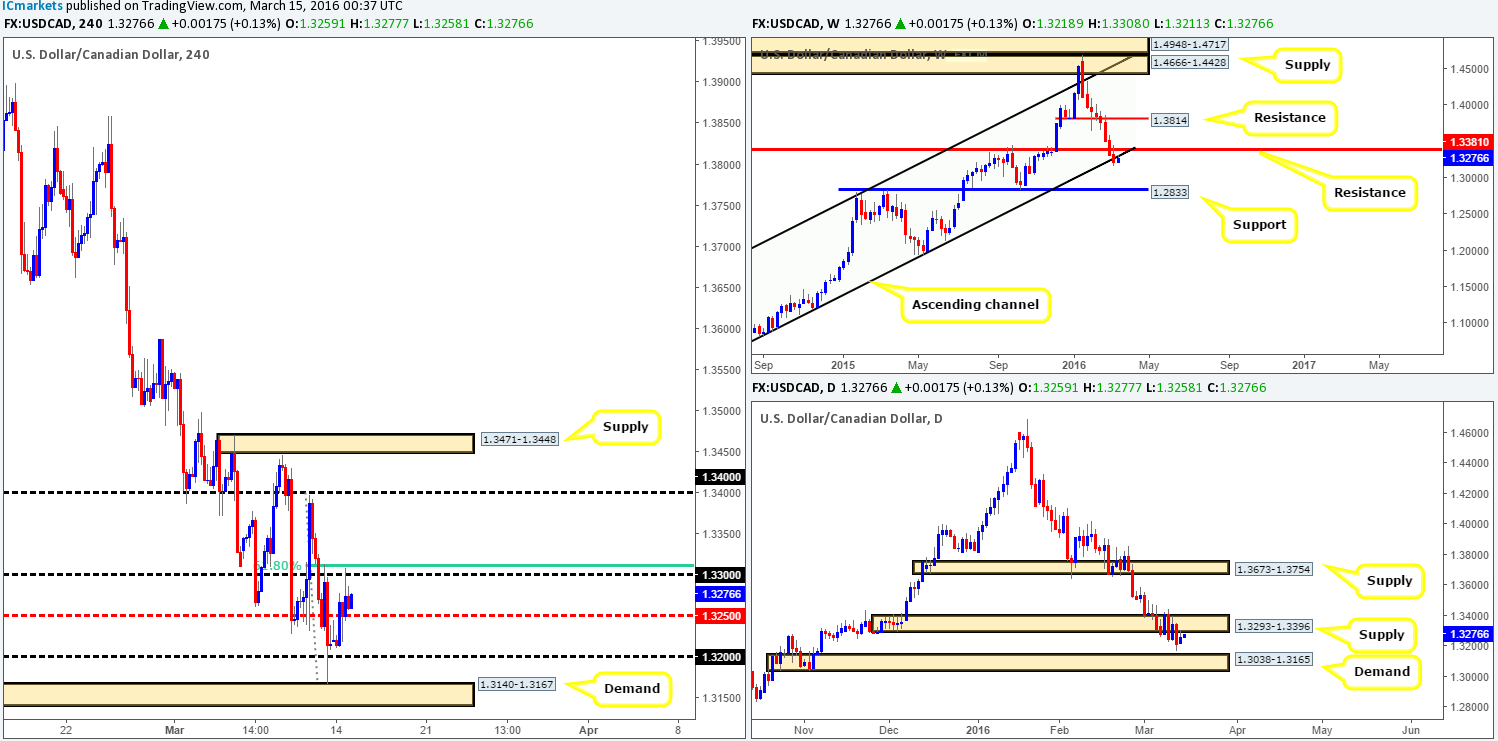
USD/CAD:
Reporting from the weekly timeframe this morning, recent action saw the Loonie tap the underside of the broken ascending channel support (now acting resistance) line extended from the low 1.0620. Should this line hold the weekly support at 1.2833 is the next barrier in the firing range. Climbing down into the daily timeframe, we can also see that price retested the underside of a recently broken demand as supply at 1.3293-1.3396, and shows room to continue lower down to demand at 1.3038-1.3165.
Stepping across to the H4 timeframe, support was quickly established around the 1.3213 mark following the open. It was, however, only once the European desks began placing orders did we see this pair rally higher, eventually testing the 1.3300 figure going into the American session.
Based on the points made above, we favor shorts over longs today. 1.3300 looks to be an attractive level as it has held firm twice already and is bolstered by a 61.8% Fibonacci level just above it at 1.3312. In the event that we manage to pin down a lower timeframe setup to sell here, our first port of call for profit taking would be the mid-level barrier 1.3250, followed by the 1.3200 and then H4 demand at 1.3140-1.3167.
Levels to watch/live orders:
- Buys: Flat (Stop loss: N/A).
- Sells: 1.3300 [Tentative – confirmation required] (Stop loss: dependent on where one confirms this level).
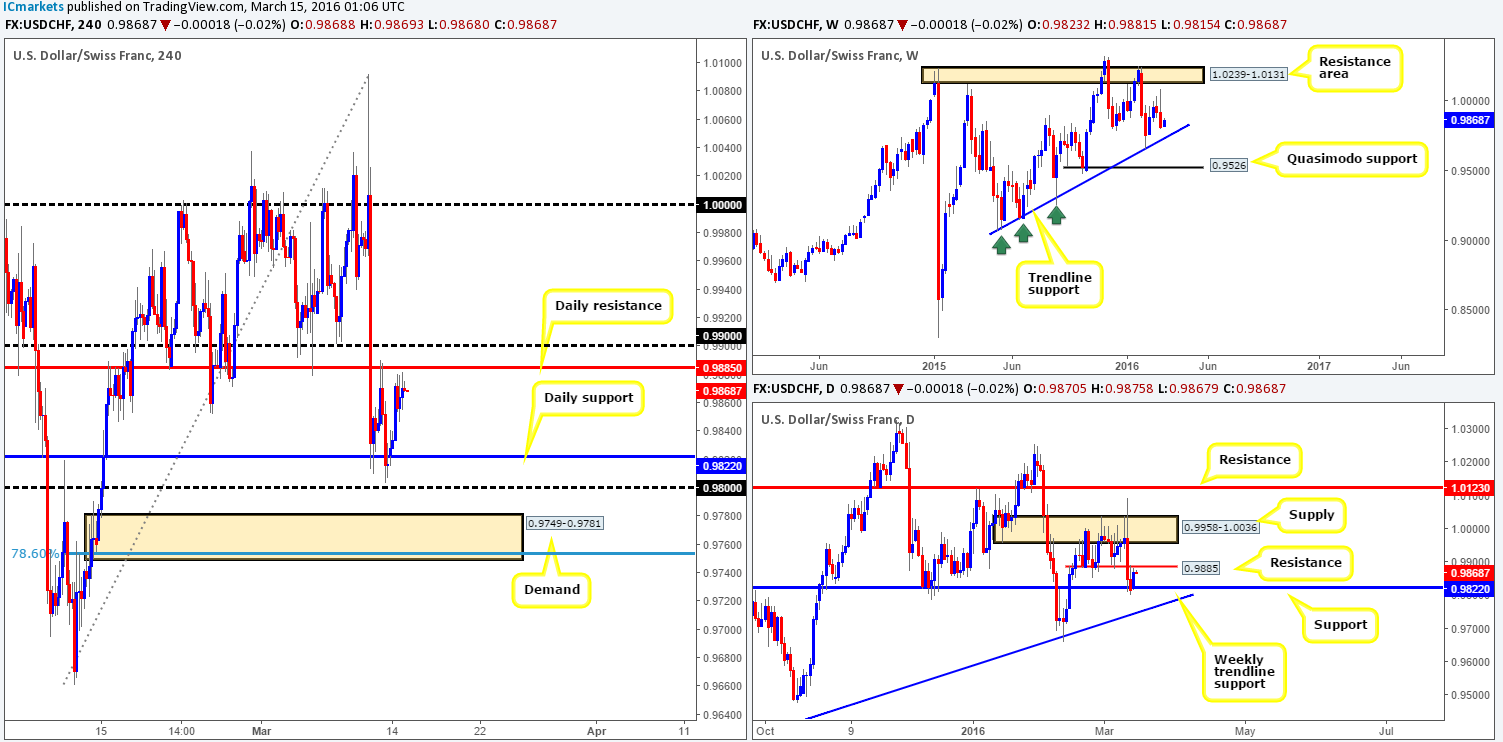
USD/CHF:
Monday’s action on the H4 chart, as you can see, rallied to highs of 0.9879 by the day’s end. Consequent to this, it appears that this pair is currently chalking up a consolidation zone fixed between two daily structures. Support comes in at 0.9822 and resistance can be found at 0.9885. Beyond this range sits two psychological numbers: 0.9800 and 0.9900, and both are likely to see a reaction should price fake the aforementioned daily levels.
Instead of looking to trade between this range, we’re more attracted to the areas beyond here. Above 0.9900, there looks to be a clear run up to parity which could make for a nice long trade should 0.9900 be taken out and retested as support. Looking below, however, there appears to be limited downside potential. Just beneath 0.9800 sits a H4 demand area at 0.9749-0.9781 which will likely hold price higher should it see action. Not only does this zone fuse with a 78.6% Fibonacci level at 0.9754, but it’s also bolstered by the weekly trendline extended from the low 0.9071. However, as highlighted in Monday’s report, even though trendlines are effective at predicting turning points, they are unfortunately prone to some very nasty fakeouts. As such, once or indeed if price reaches the aforementioned H4 demand zone this week, we will only consider this a viable buy zone should lower timeframe buying strength be seen (see at the very top of this page how we like to look.
Levels to watch/live orders:
- Buys: 0.9749-0.9781 [Tentative – confirmation required] (Stop loss: dependent on where one confirms this area). Watch for price to consume the 0.9900 level and look to trade any retest seen thereafter (lower timeframe confirmation required).
- Sells: Flat (Stop loss: N/A).
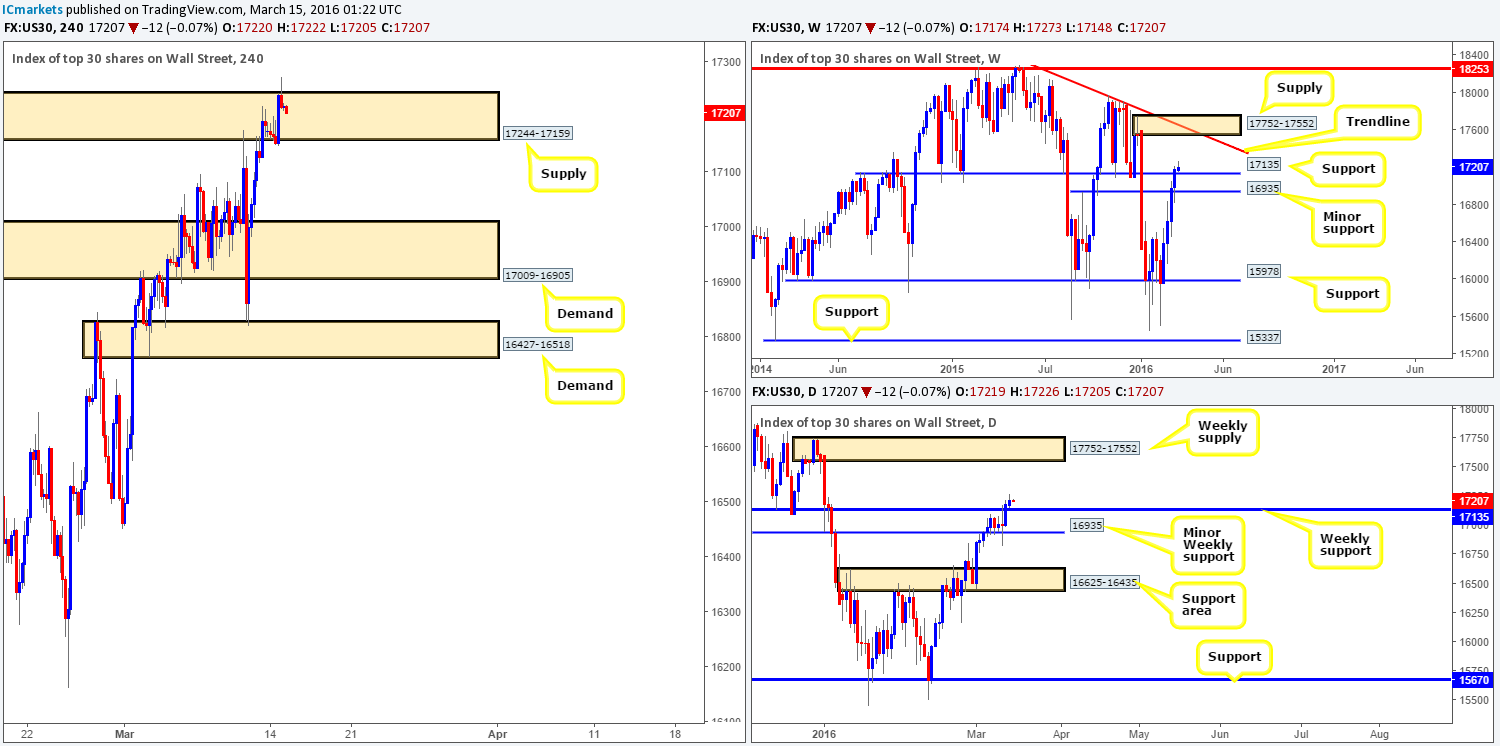
DOW 30:
U.S stocks continued to gather momentum yesterday, resulting in a rather vicious spike printing above H4 supply penciled in at 17244-17159. With the majority of stop losses likely being taken out here, along with the higher-timeframe picture trading above weekly resistance at 17135 which should theoretically hold as support, we’re still looking to buy this market.
As we mentioned in Monday’s report: although the higher-timeframe picture (see above) indicates further upside this week, buying into the current H4 supply is out of the question! That being the case, we have to resort to waiting to see if price can close above this H4 area and retest it as demand before looking for a lower timeframe entry long, targeting H4 supply seen at 17606-17538.
This target supply area is rather special in our book, since it is also an area we would most certainly short from at market due to the following converging structures:
- Positioned within the aforementioned weekly supply area.
- Blends beautifully with a H4 Quasimodo resistance level at 17606.
- And of top of this, the supply itself is fresh with strong momentum to the downside.
Levels to watch/live orders:
- Buys: Watch for price to consume the 17244-17159 area and look to trade any retest seen thereafter (lower timeframe confirmation required).
- Sells: 17606-17538 [Dependent on the time of day, a market entry is permitted here due to structure confluence – see above] (Stop loss: 17620).
XAU/USD: (Gold)
Using a top-down approach this morning, weekly flow continues to see Gold sell-off from supply coming in at 1307.4-1280.0, and as such has come close to connecting with support at 1224.1. On top of this support, daily price is trading within the extremes of a demand zone drawn from 1224.6-1238.3, which is bolstered by the weekly support level at 1224.1 just below.
As anticipated, the H4 demand (now acting supply) zone at 1237.2-1243.9 was taken out during yesterday’s bearish assault, which allowed price to shake hands with the H4 demand at 1224.6-1230.8, which was the more attractive zone of the two. Not only is this area housed within the extremes of the above said daily demand zone, but it is also supported by the weekly support level mentioned above at 1224.1. However, considering that the weekly level sits just beneath the H4 demand, there is a high probability that a fakeout will take place before serious buyers step in. That being the case, we would only enter within this zone alongside lower timeframe confirmation i.e. a break of supply or a collection of lower timeframe buying tails around a lower timeframe support etc… In the event that we manage to locate such a setup, we’ll take partial profits at the newly-formed supply at 1237.2-1243.9 and then look to protect our position by reducing risk.

Levels to watch/live orders:
- Buys: 1224.6-1230.8 [Tentative – confirmation required] (Stop loss: dependent on where one confirms this area).
- Sells: Flat (Stop loss: N/A).


