
Key risk events today:
Limited.
(Previous analysis as well as outside sources – italics).
EUR/USD:
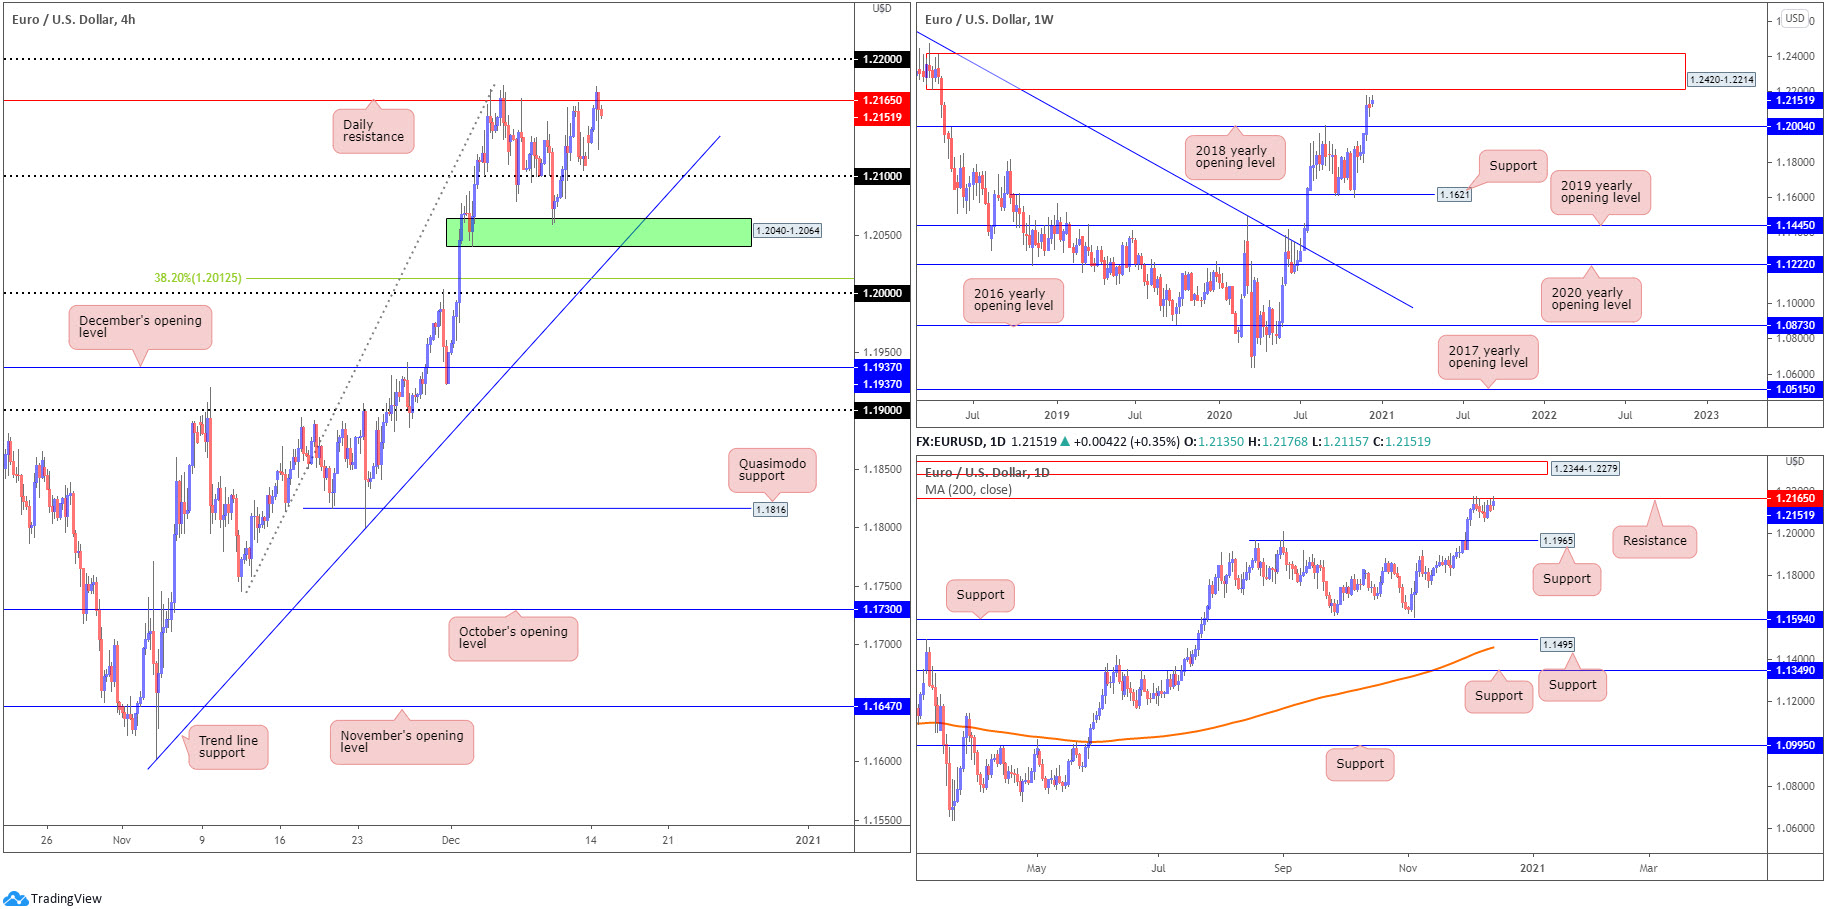
Europe’s shared currency kicked off the final full week of trading in December in reasonably positive territory against a broadly softer USD. With the US dollar index maintaining a presence south of 91.00, EUR/USD went forward and shook hands with daily resistance at 1.2165, a level that made an appearance at the beginning of December.
North of the aforementioned daily resistance, fresh YTD peaks and the 1.22 handle calls for attention on the H4 scale. Below, 1.21 is seen, followed by demand plotted at 1.2040-1.2064 and trend line support, extended from the low 1.1602.
The technical picture on the weekly chart reveals EUR/USD recently overwhelmed the 2018 yearly opening value at 1.2004, drawing out supply at 1.2420-1.2214. In terms of trend, it seems upside remains favoured, more so if price overthrows the 1.2555 February 12 high (2018). The above implies buyers could remain at the wheel until testing the aforementioned supply zone.
Before reaching weekly supply, however, buyers must contend with daily resistance mentioned above at 1.2165. A solid rejection here shines the spotlight on support at 1.1965, a previous Quasimodo resistance. A 1.2165 break, on the other hand, swings the pendulum in favour of a run to supply drawn from 1.2344-1.2279 (sited within the parapets of current weekly supply).
Areas of consideration:
- The uptrend remains healthy, seen clearly from both the weekly and daily timeframes.
- Daily resistance at 1.2165 offers an immediate level to work with – important due to the number of times buyers failed to overthrow the barrier.
- H4 demand at 2040-1.2064, in addition to trend line support, is an interesting point to be mindful of. Though pushing beyond these areas shines the spotlight on 1.20 and nearby 38.2% H4 Fibonacci level at 1.2012.
- 1 22 is also a significant ceiling to watch, one which could entice sellers. A mild fakeout above the level, a whipsaw that not only taps into any buy-stops above 1.22 but also tests the underside of weekly supply at 1.2214 (potentially strong offers), unlocks the possibility of fresh sellers making an appearance.
GBP/USD:
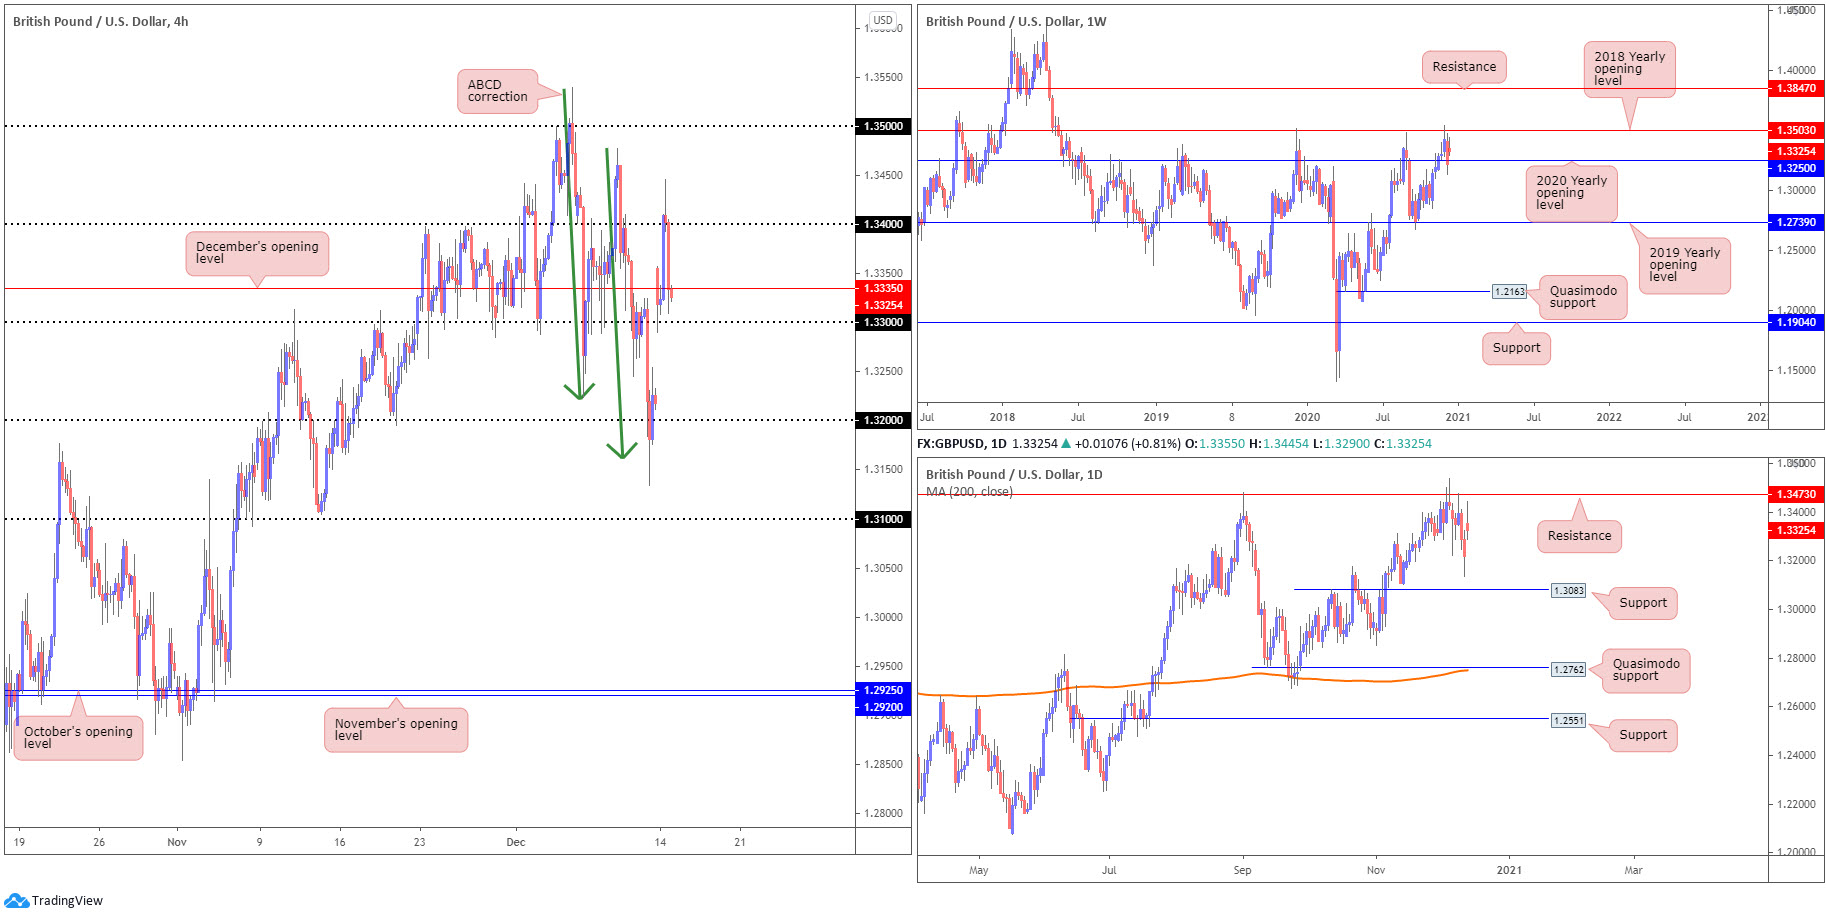
Cable, as you can see, currently trades off best levels, but still ahead of its major rivals as UK and EU negotiators continue discussions in attempt to secure a trade agreement.
Gapping higher by 140 pips at the open, H4 subsequently retested bids around 1.33 and overthrew December’s opening value at 1.3335 to test 1.34. As of current prices, we’re now trading back under 1.3335, threatening another 1.33 retest.
From the weekly timeframe, buyers and sellers remains battling for position between the 2018 and 2020 yearly opening values at 1.3503 and 1.3250, respectively. Despite this modest consolidation, buyers have governed control since March.
The daily chart, as put forward in Monday’s technical briefing, provides a magnified view of the current uptrend. The chart also parades resistance at 1.3473, with last Wednesday establishing a shooting star pattern off the level. Interestingly, a lack of support is seen until reaching the 1.3083 region, a previous Quasimodo resistance barrier.
Areas of consideration:
- Retaking the 1.33 handle on the H4 today could have sellers attempt to fill the gap and test the grip of 1.32. A retest at the underside of 1.33 prior to any decline would likely attract additional sellers into the mix.
- H4 closing back above December’s opening value at 1.3335, however, could spark intraday buying towards 1.34. A retest at 1.3335 would also likely be a welcomed sight for conservative buyers.
AUD/USD:
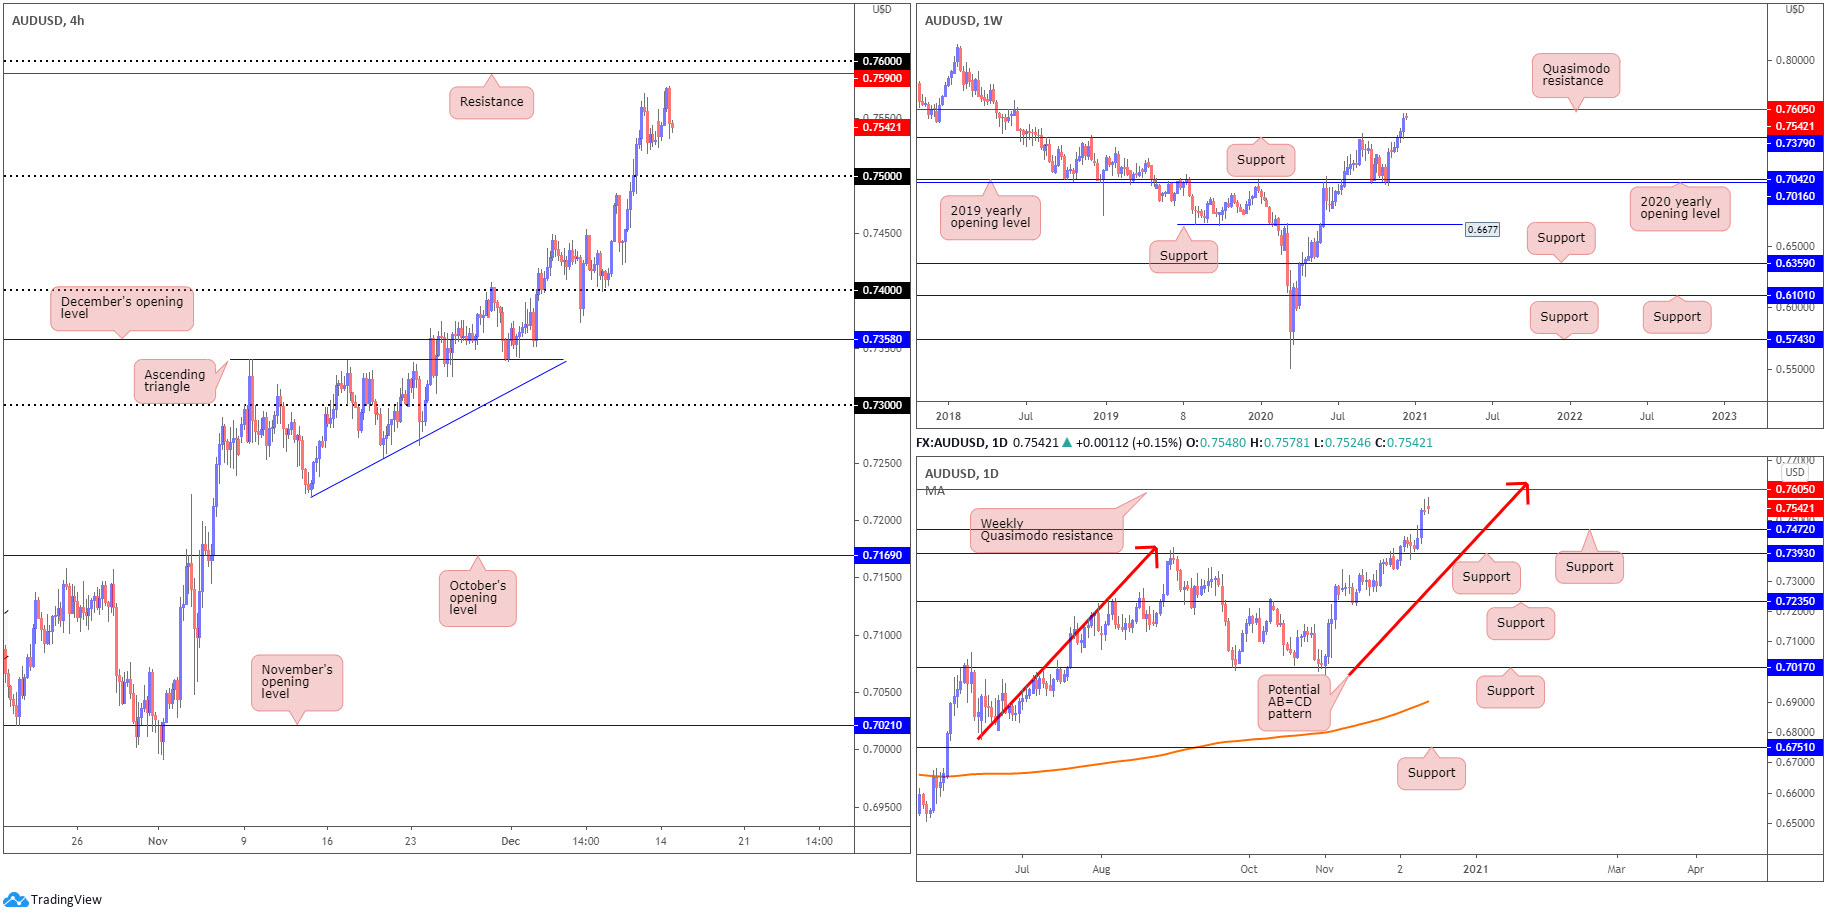
All in all, aside from a fleeting move to YTD highs at 0.7578, limited change was observed in AUD/USD Monday. In response to this, much of the following will echo thoughts aired in Monday’s technical briefing.
From the weekly timeframe, last week’s action decorated the weekly chart with another cheerful candle. Following a retest of support at 0.7379, the pair recorded a fourth consecutive weekly advance. In view of this market trending higher since early 2020, buyers may be eyeballing Quasimodo resistance parked at 0.7605.
Despite two back-to-back shooting star candle patterns, formed off YTD peaks, sellers have yet to show signs of committing. Should sellers gain consciousness, this could prompt mild downside, possibly driving a retest at support drawn from 0.7472. To the north of price, weekly Quasimodo resistance mentioned above at 0.7605 is seen, accompanied by a daily AB=CD approach (red arrows) at 0.7624.
Potential support is observed around the 0.75 handle on the H4 scale and resistance stands in at the 0.7590 point, closely shadowed by 0.76. It is also worth highlighting that just beneath 0.75, daily support rests at 0.7472, while circling just above 0.76 we have weekly Quasimodo resistance plotted at 0.7605.
Areas of consideration:
Outlook unchanged.
- The combination of daily support at 0.7472 and the 0.75 handle on the H4 represents possible support.
- 76 on the H4 echoes robust resistance, placed nearby H4 resistance at 0.7590 and weekly Quasimodo resistance at 0.7605.
USD/JPY:
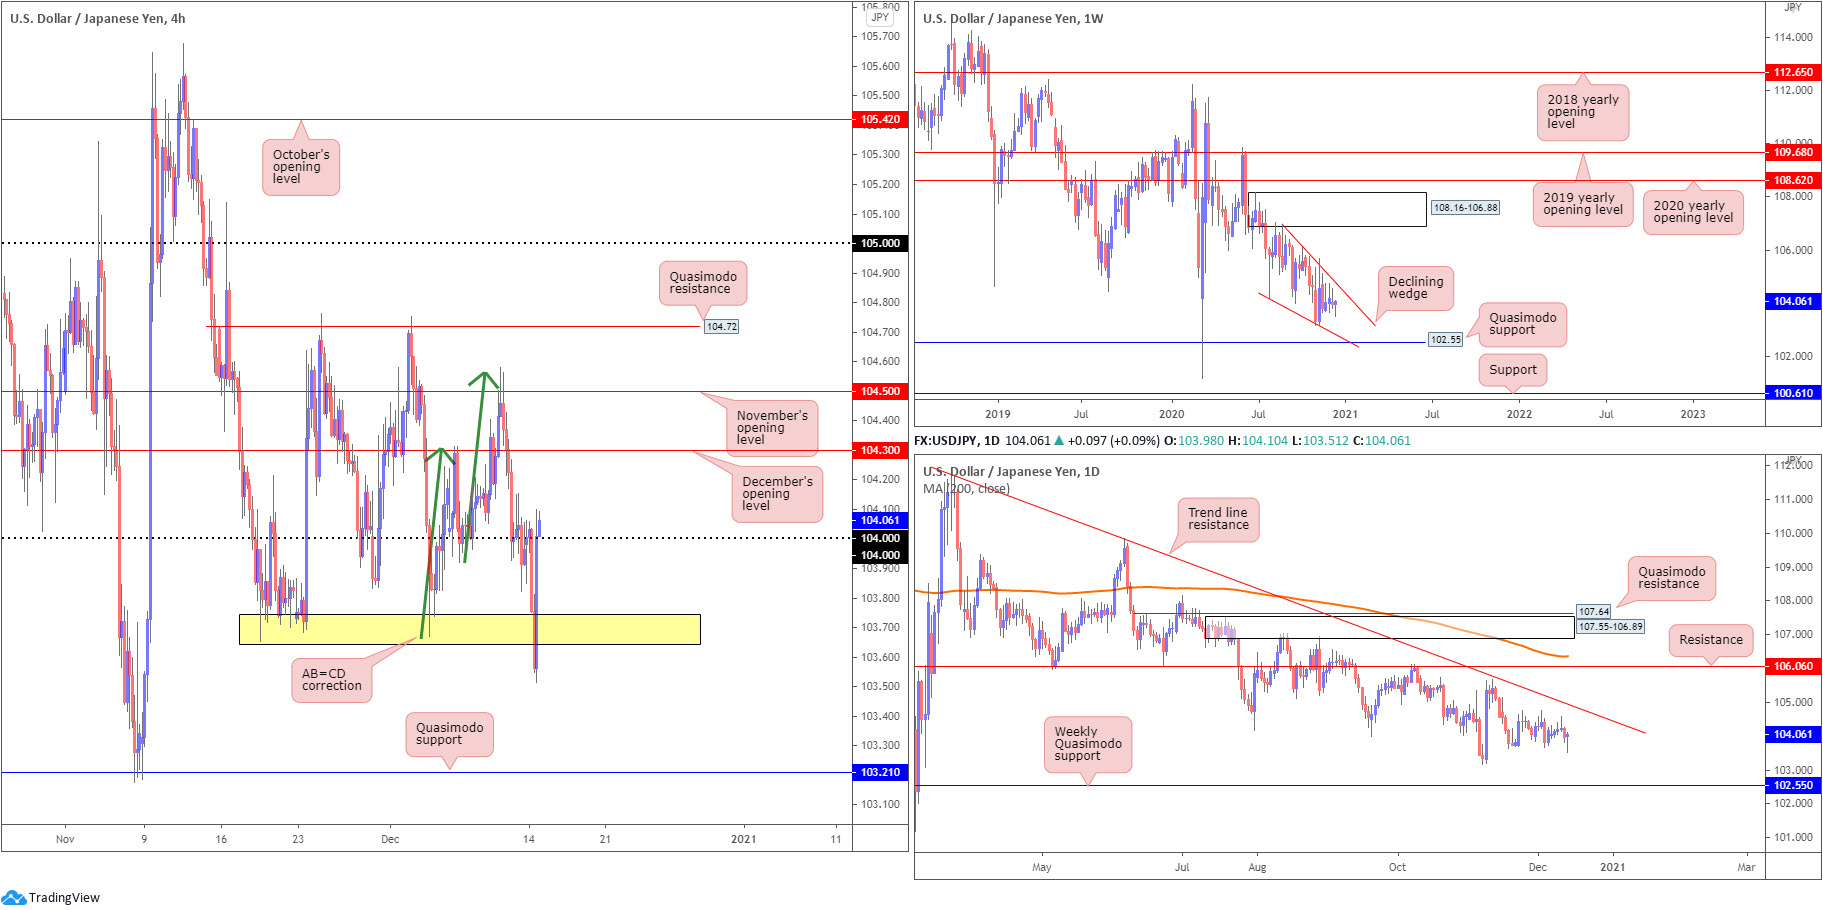
Monday observed a predatory spike to lows at 103.51, cornering buyers off H4 support around the 103.70 region (yellow). The swift recovery, as you can see, has since reclaimed 104+ status with price on course to potentially cross swords with December’s opening value at 104.30. Additional resistance can be seen at November’s opening value from 104.50 and the Quasimodo formation at 104.72.
Based on the weekly timeframe, limited change has been seen:
Since connecting with the underside of weekly supply at 108.16-106.88 in August, price has gradually shifted lower and developed a weekly declining wedge (106.94/104.18). Quasimodo support at 102.55 is also in the picture, with a break revealing support plotted at 100.61. A strong bounce from 102.55, however, may provide enough impetus for buyers to attempt a breakout above the current declining wedge.
From the daily timeframe, aside from the hammer candlestick pattern formed on Monday, limited change is also observed:
The technical landscape on the daily timeframe reveals scope to close in on trend line resistance, extended from the high 111.71. Sellers taking over, nevertheless, could lead price to the 103.17 November 6 low, followed by the noted weekly Quasimodo support at 102.55.
Areas of consideration:
- 104 holding as support today could tempt fresh bids, perhaps flowing towards December’s opening value at 104.30. Additional resistance, as aired above, can be found at November’s opening value from 104.50 and the Quasimodo formation at 104.72.
- With buyers squeezed around H4 support at 103.70, a move beneath 104 today may provoke fresh selling to H4 Quasimodo support at 103.21.
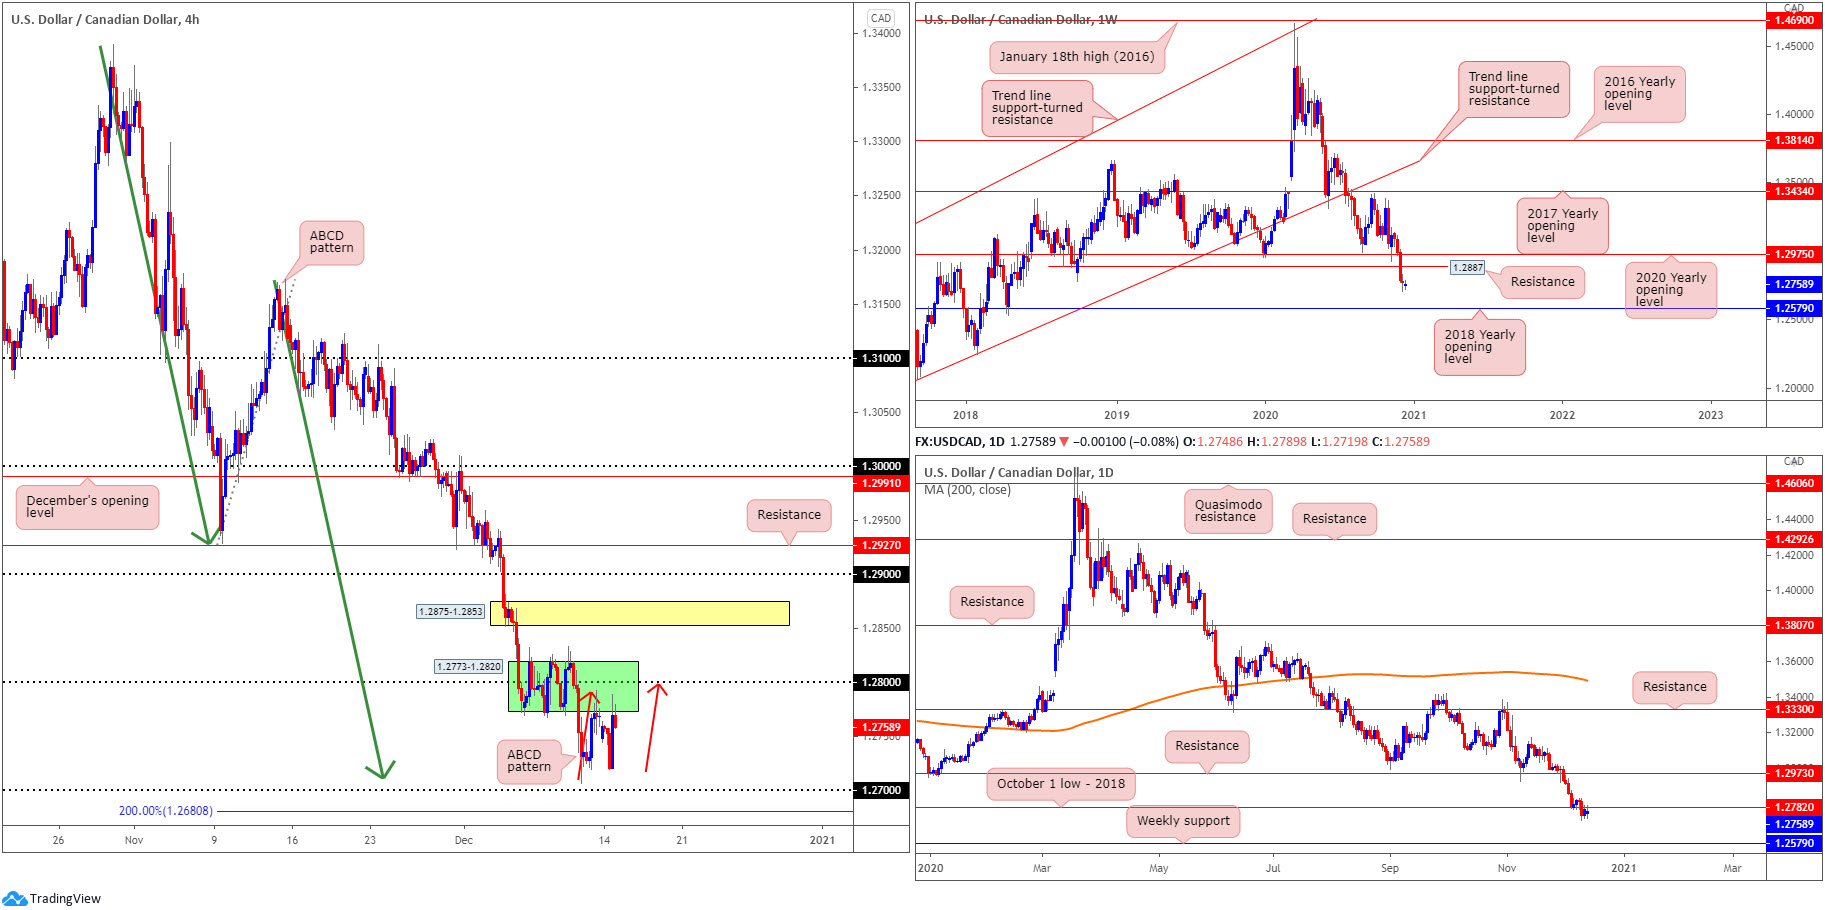
USD/CAD:
A modest USD revival provided fresh impetus to the USD/CAD pair Monday, elevating the unit back to the underside of a H4 consolidation between 1.2773-1.2820 (green), an area that also happens to converge with daily resistance at 1.2782. Continued interest to the upside could see H4 candles enter the aforementioned range to test 1.28, in the shape of a local ABCD pattern (red arrows).
Below current price, 1.27 is seen unchallenged, merging with an ABCD pattern (green arrows) at 1.2711 and a 2.0 BC projection.
Further afield, over the past four weeks USD/CAD obliterated the 2020 yearly opening value at 1.2975 and Quasimodo support coming in at 1.2887 on the weekly timeframe, collectively dropping more than 360 pips. With both 1.2975 and 1.2887 depicting resistance, sustained downside places the 2018 yearly opening value at 1.2579 in the firing line. Also important to note is that long-term flow has been pointing lower since topping in March.
According to the daily timeframe, last week’s selling set aside bids at daily support from 1.2782 (October’s low, 2018), consequently enhancing the weekly timeframe’s bearish stance towards the 2018 yearly opening value.
Areas of consideration:
Outlook unchanged.
- Although H4 technicals display reasonably bright support, composed of the 1.27 handle, an ABCD correction at 1.2711 and a 2.0 BC projection at 1.2680, buyers are unlikely to commit. Not only is the daily timeframe retesting resistance at 1.2782, the weekly timeframe recently cleared key support, highlighting room to reach for the 2018 yearly opening value at 1.2579.
- In light of the above, bearish scenarios may form between the underside of the H4 range at 1.2773 and the round number 1.28, targeting 1.27 and possibly, according to the higher timeframes, the 1.26 handle.
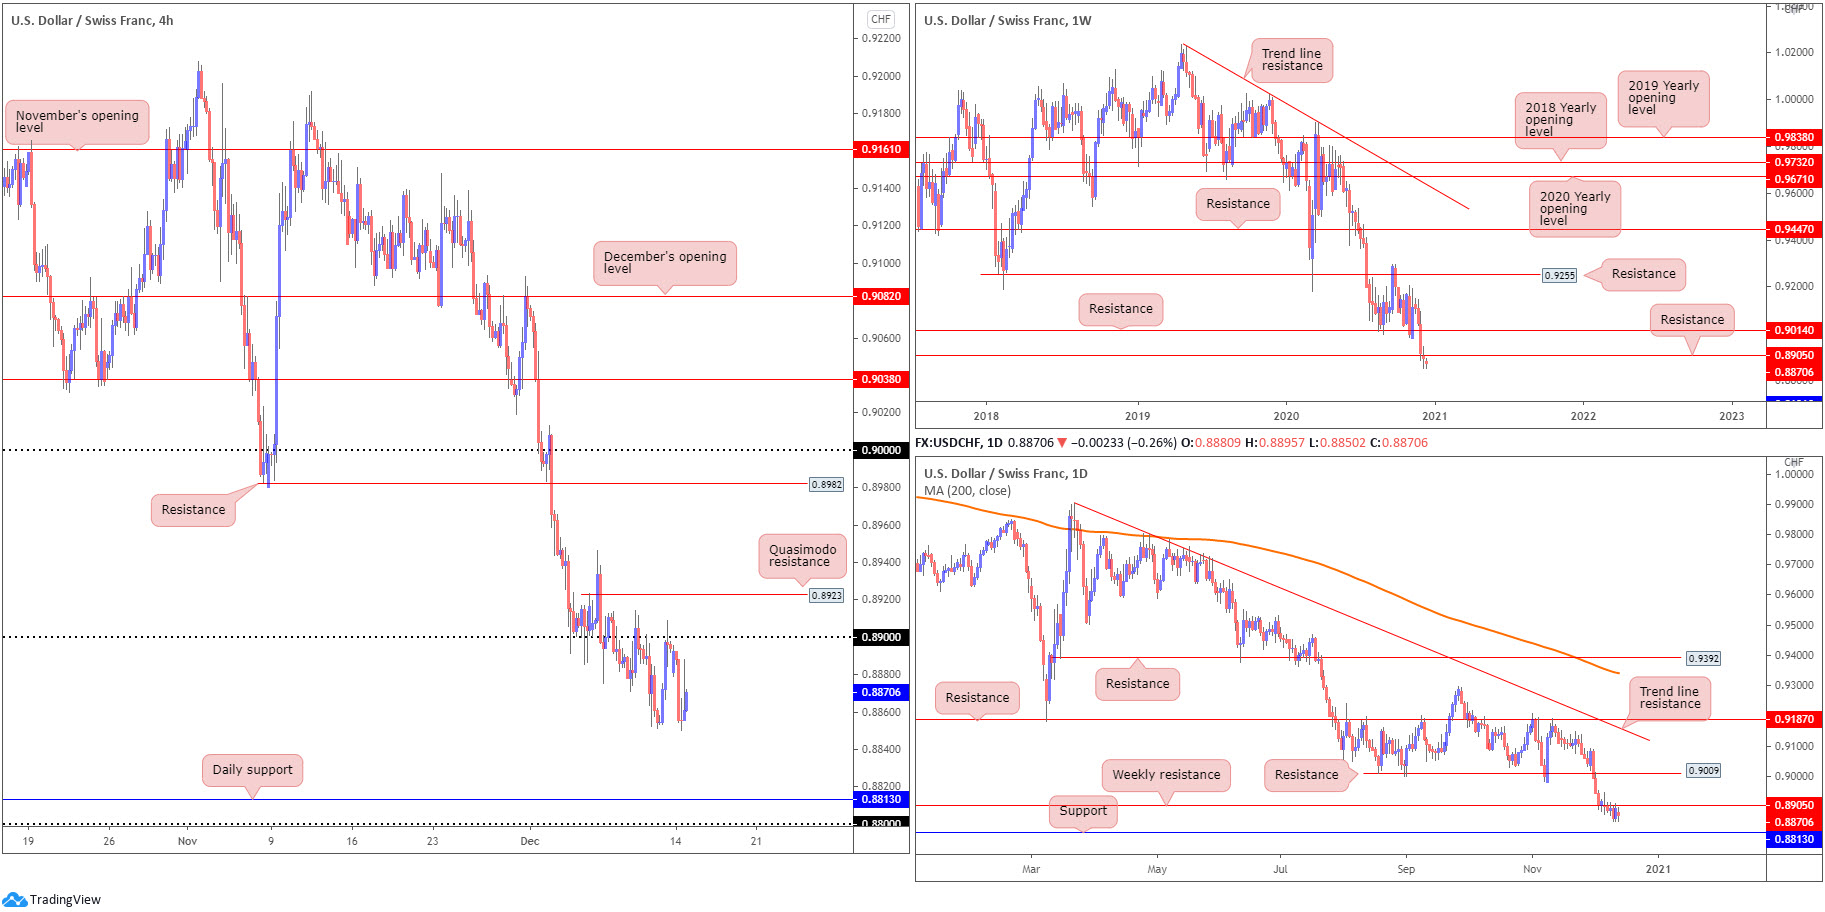
USD/CHF:
For those who read Monday’s technical briefing you may recall the following (italics):
Strengthened on the back of a moderate revival in the US dollar index on Friday, USD/CHF recovered from multi-year lows and tested highs at 0.8909. With H4 holding the lower side of the 0.89 handle, this could, given the daily timeframe showing weekly resistance at 0.8905 having its underside tested, spark bearish themes this week, shifting interest towards daily support at 0.8813 and the 0.88 handle (H4).
As evident from the H4 chart this morning, sellers pressured the pair to lower levels Monday, pencilling in fresh YTD troughs at 0.8850. Although price is seen mildly paring losses into the close, bearish eyes are likely fixed on daily support at 0.8813, and the 0.88 handle based on the H4.
The technical landscape on the weekly timeframe shows price drifting around the underside of resistance from 0.8905. While buyers could attempt a recovery off 0.8905, traders are urged to pencil in the possibility of refreshing multi-year lows and shining the limelight on support at 0.8696. Interestingly, the trend in this market has been lower since early 2019.
The framework on the daily timeframe reveals candle action hovering under weekly resistance at 0.8905. Below 0.8905 on the daily scale, support is seen at 0.8813.
Areas of consideration:
- All three timeframes indicate thin buy-side liquidity until reaching 0.88ish, therefore bearish strategies could potentially form south of the 0.8850 point, targeting 0.88.
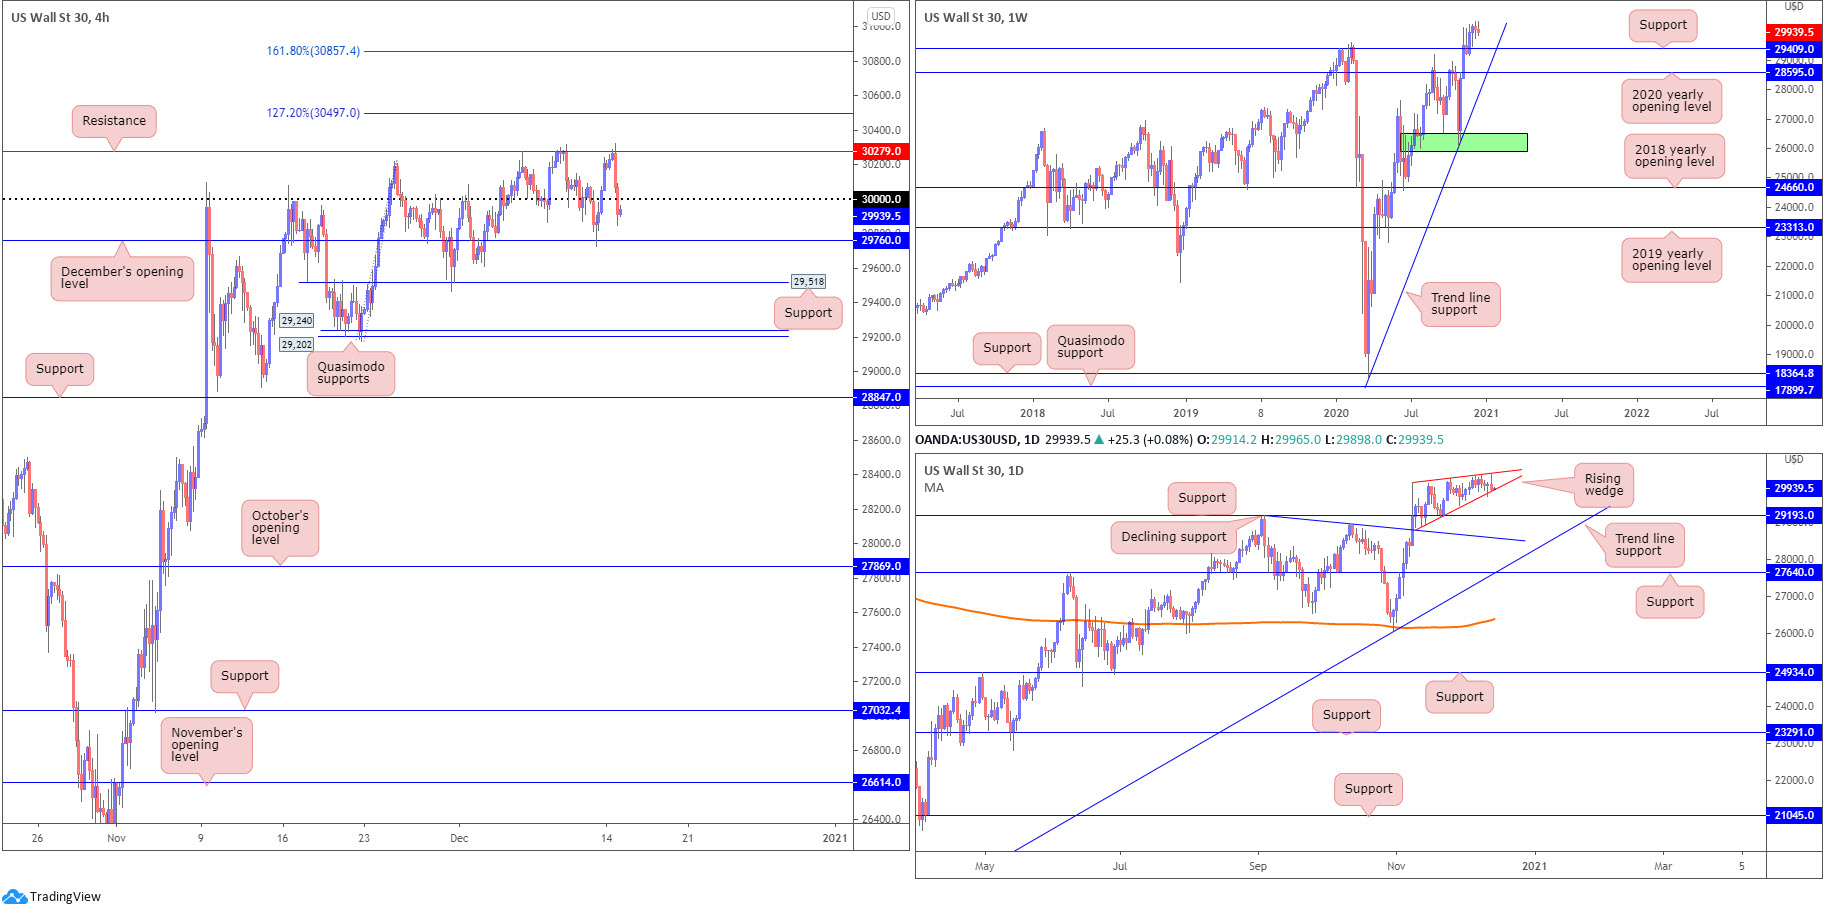
Dow Jones Industrial Average:
Major US equity benchmarks finished Monday mixed amidst vaccine distribution. The Dow Jones Industrial Average erased 184.82 points, or 0.62%; the S&P 500 dropped 15.97 points, or 0.44% while the Nasdaq rallied 62.17 points, or 0.50%.
The technical framework on the H4 reveals the unit is struggling to maintain a position north of the 30,000 figure, with price fading YTD peaks around 30,322. As you can see, price has formed resistance around 30,279. December’s opening value at 29,760 is next on tap as possible support, with a break exposing another layer of support priced in at 29,518.
Further out on the weekly timeframe, we can see that should the unit correct, support at 29,409 (prior Quasimodo resistance) could be an area dip-buyers find interest in. The 2020 yearly opening value from 28,595 is also in the frame, tied together with trend line support, taken from the low 18,213. According to the daily timeframe, support is seen at 29,193. Pattern traders may also acknowledge the rising wedge forming between 28,940/30,097.
Areas of consideration:
- December’s opening value at 29,760 and support at 29,518 on the H4, though both levels lack additional confluence.
- A close below the daily rising wedge pattern could see sellers force a retest of daily support at 29,193. This would take H4 through supports at 29,760 and 29,518 to test Quasimodo supports at 29,202 and 29,240.
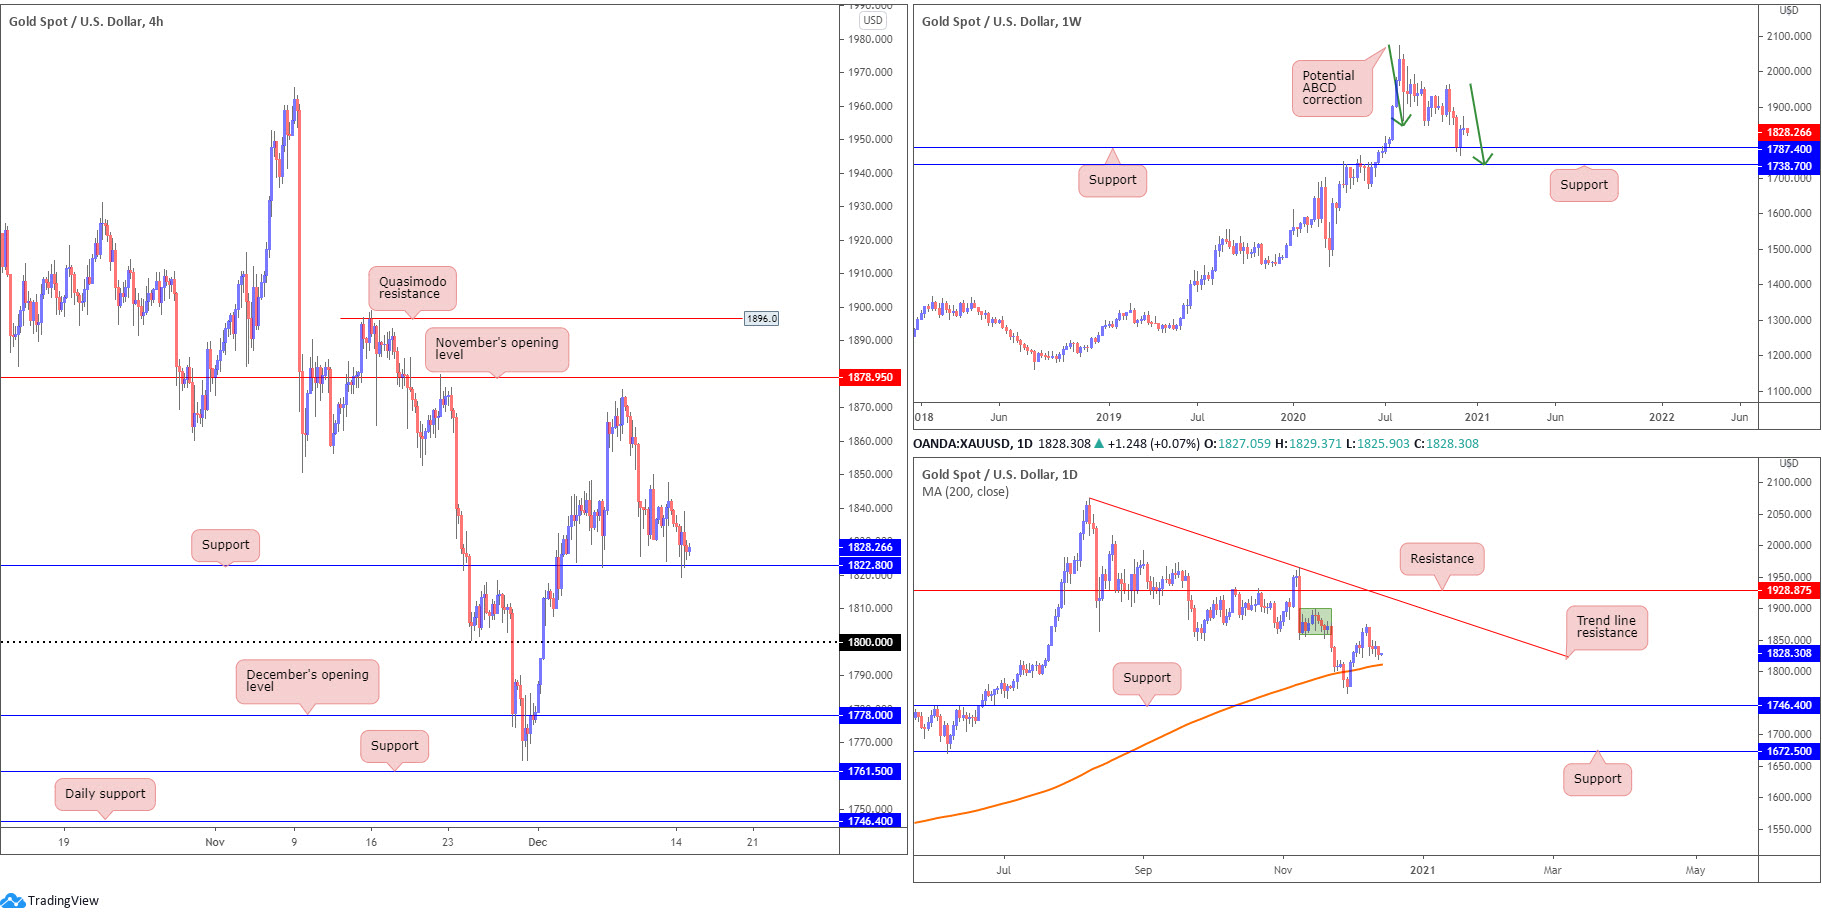
XAU/USD (GOLD):
Spot gold fell 0.7% against the US dollar on Monday, guiding H4 candles to support at $1,822. While the level is currently bid, dropping through here could lead to a test of $1,800, while journeying higher could challenge November’s opening value at $1,878.
Higher up on the curve, despite last week’s action finishing significantly off best levels, weekly price is seen holding off support at $1,787 (sited ahead of another support at $1,738 and a potential ABCD correction [green arrows]). The fact the yellow metal has been decisively trending higher since the beginning of 2016 adds to the bullish narrative off $1,787. Meanwhile, on the daily chart, supply around $1,878ish (green zone) held upside last week. With this, the 200-day SMA (orange – $1,810) could be retested.
Areas of consideration:
- Buyers appear free to take things higher, according to the trend and weekly support at $1,787.
- The retest at H4 support from $1,822 could entice buyers, targeting November’s opening value at $1,878. However, a $1,822 breach could lead to a test of the 200-day SMA as possible support ($1,810), hovering ahead of $1,800.
The accuracy, completeness and timeliness of the information contained on this site cannot be guaranteed. IC Markets does not warranty, guarantee or make any representations, or assume any liability regarding financial results based on the use of the information in the site.
News, views, opinions, recommendations and other information obtained from sources outside of www.icmarkets.com.au, used in this site are believed to be reliable, but we cannot guarantee their accuracy or completeness. All such information is subject to change at any time without notice. IC Markets assumes no responsibility for the content of any linked site.
The fact that such links may exist does not indicate approval or endorsement of any material contained on any linked site. IC Markets is not liable for any harm caused by the transmission, through accessing the services or information on this site, of a computer virus, or other computer code or programming device that might be used to access, delete, damage, disable, disrupt or otherwise impede in any manner, the operation of the site or of any user’s software, hardware, data or property


