
Waiting for lower timeframe confirmation is our main tool to confirm strength within higher timeframe zones, and has really been the key to our trading success. It takes a little time to understand the subtle nuances, however, as each trade is never the same, but once you master the rhythm so to speak, you will be saved from countless unnecessary losing trades. The following is a list of what we look for:
- A break/retest of supply or demand dependent on which way you’re trading.
- A trendline break/retest.
- Buying/selling tails/wicks – essentially we look for a cluster of very obvious spikes off of lower timeframe support and resistance levels within the higher timeframe zone.
We typically search for lower-timeframe confirmation between the M15 and H1 timeframes, since most of our higher-timeframe areas begin with the H4. Stops are usually placed 1-3 pips beyond confirming structures.
EUR/USD:
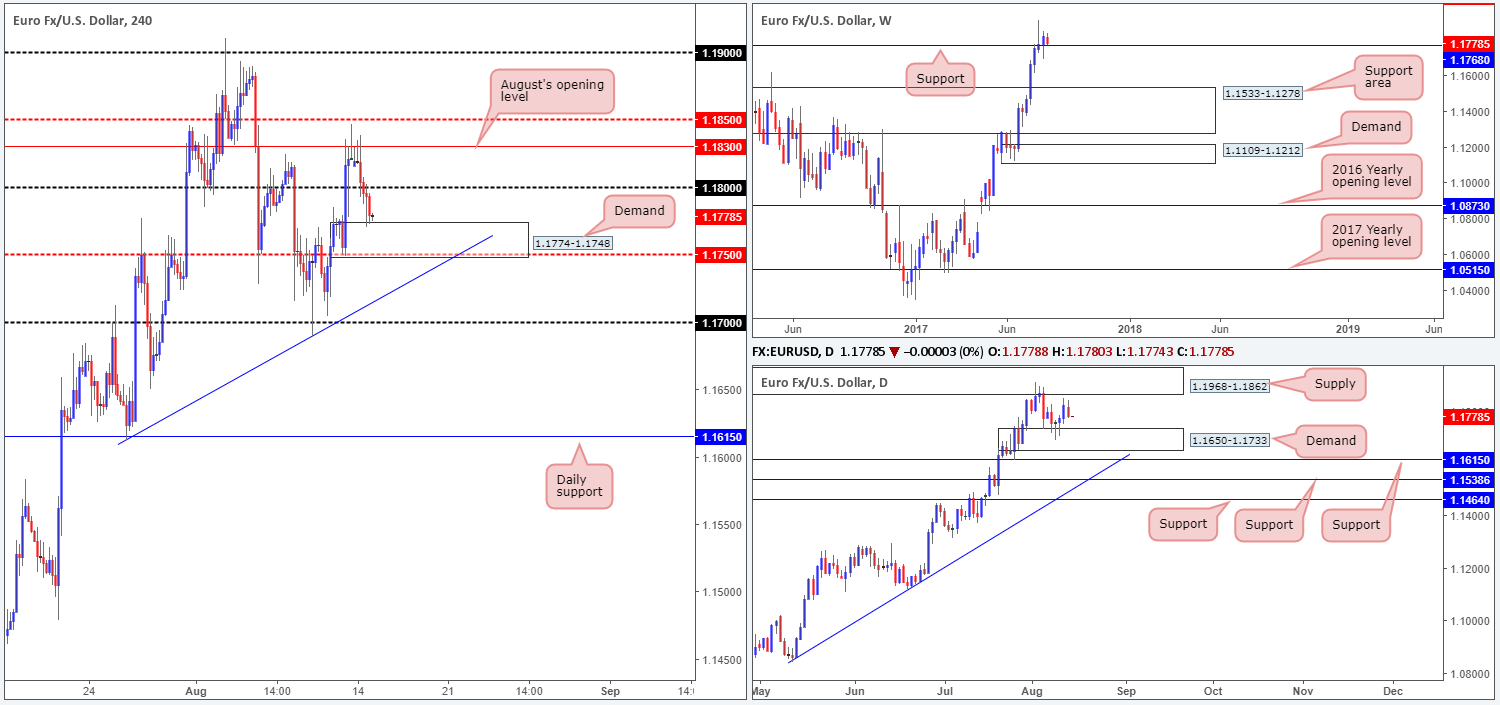
Try as it might, the single currency could not muster enough strength to close above August’s opening level at 1.1830 on Monday. In consequence to this, the pair fell away and eventually closed beneath the 1.18 handle, ending the day challenging a H4 demand pegged at 1.1774-1.1748. Perhaps the most compelling factor seen around this zone is the weekly support at 1.1768, which runs through the top edge of this area beautifully.
A long from the current H4 demand is tempting given the fusing weekly support and how strong the underlying trend on the EUR is at the moment. With that being said, however, there are two cautionary points to consider. The first being the 1.18 handle lurking just above the demand. The second point is the daily demand at 1.1650-1.1733 which happens to converge with a H4 trendline support etched from the low 1.1612. With this zone sited underneath the current H4 demand base, there’s a strong possibility that a fakeout may take shape.
Suggestions: The aforementioned H4 demand, even though it boasts weekly support at 1.1768, is not a place we will be looking to buy from today, largely because of the reasons stated above. To that end, our desk will remain on the sidelines until more favorable price action presents itself.
Data points to consider: German Prelim GDP q/q at 7am. US Core retail sales figures at 1.30pm GMT+1.
Levels to watch/live orders:
- Buys: Flat (stop loss: N/A).
- Sells: Flat (stop loss: N/A).
GBP/USD:
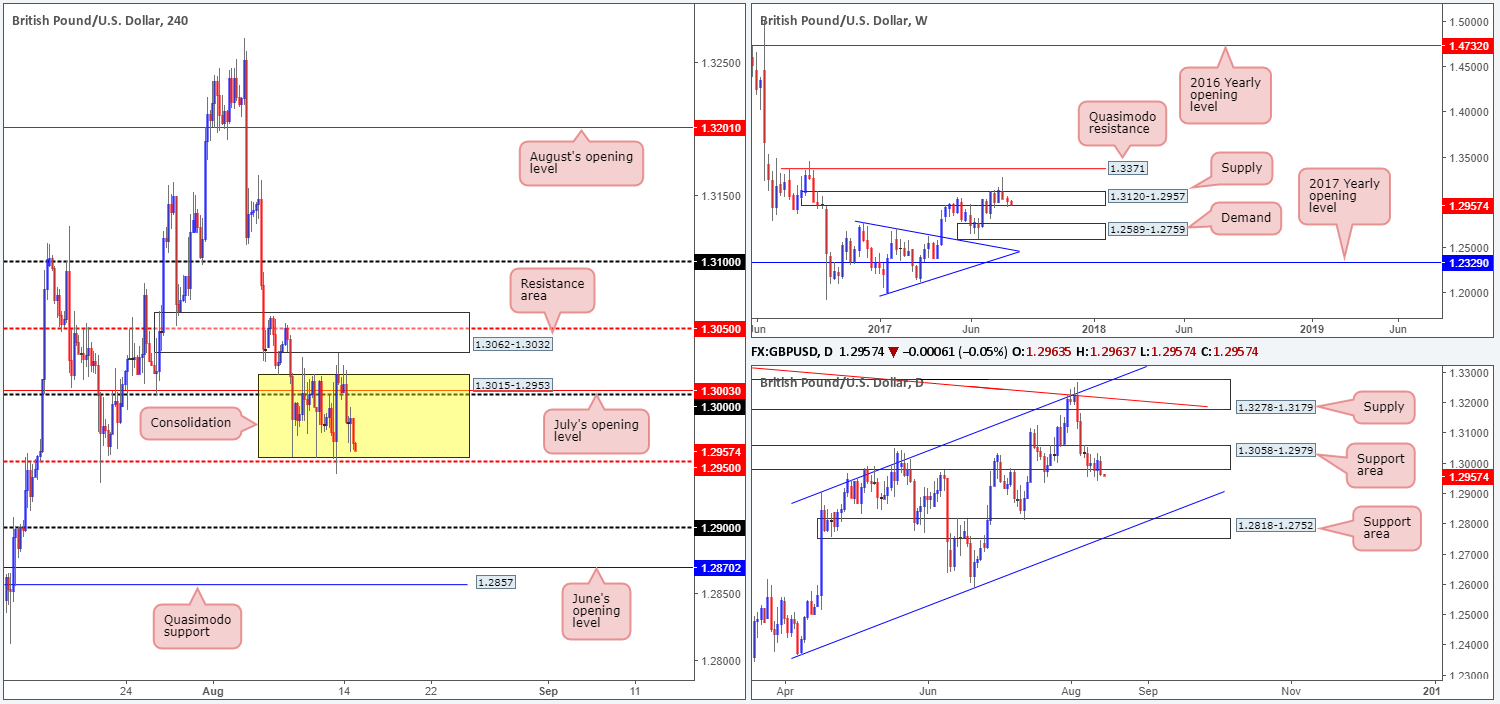
As can be seen on the H4 timeframe this morning, the GBP chewed its way through bids around the 1.30 neighborhood on Monday and proceeded to press back into the current consolidation drawn between 1.3015-1.2953 (yellow zone).
Yesterday’s move to the downside also forced daily price to strongly close beneath a support area at 1.3058-1.2979. With little bullish intent seen registered from this zone last week, we feel this base is now drained and lower prices could be on the cards. A continued move lower from here would likely expose another support area located at 1.2818-1.2752, which happens to fuse with a channel support etched from the low 1.2365 and is also seen glued to the top edge of a weekly demand at 1.2589-1.2759. In addition to this, let’s also remind ourselves where weekly price is trading from at the moment: a weekly supply area coming in at 1.3120-1.2957.
Suggestions: Despite what’s being seen on the higher timeframes at the moment, we will not become sellers in this market UNTIL a close below the 1.2950 neighborhood is seen. This – coupled with a successful retest of 1.2950, a short down to the 1.29 handle, followed closely by June’s opening line at 1.2870/H4 Quasimodo support at 1.2857, is a viable trade in our book.
Data points to consider: UK inflation figures scheduled for 9.30am. US Core retail sales figures at 1.30pm GMT+1.
Levels to watch/live orders:
- Buys: Flat (stop loss: N/A).
- Sells: Watch for H4 price to close below the 1.2950 region and then look to trade any retest seen thereafter ([waiting for a reasonably sized bearish candle to form following the retest – in the shape of either a full, or near-full-bodied candle – is advised] stop loss: ideally beyond the candle’s wick).
AUD/USD:
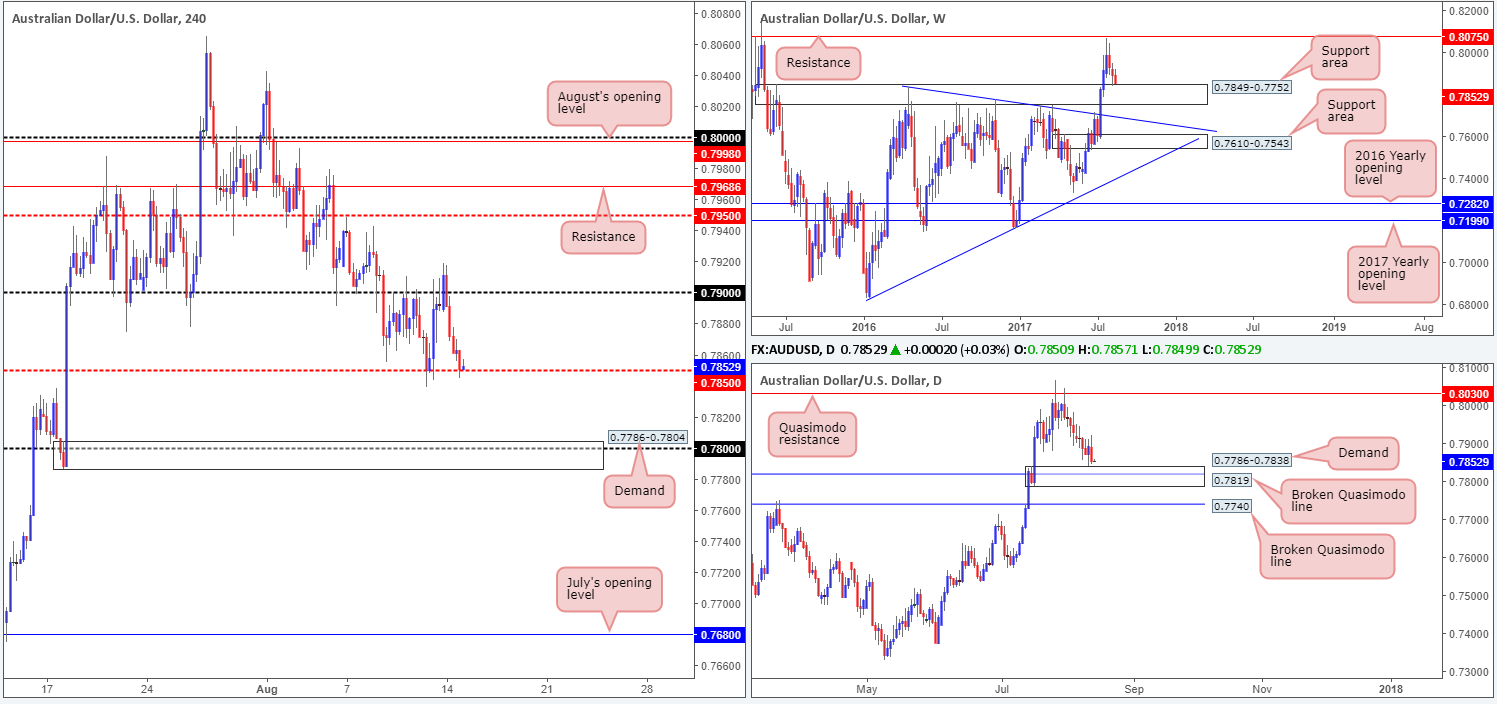
Kicking this morning’s report off with a look at the weekly timeframe, we can see that the candles recently came into contact with a support area marked at 0.7849-0.7752. There was, as noted in Monday’s report, a mild end-of-week correction seen from the top edge of this base. Looking down to the daily timeframe, the commodity currency is seen lurking just ahead of a demand at 0.7786-0.7838 (encases a daily broken Quasimodo level at 0.7819). The demand, as you can see, boasts a strong-looking base. This, alongside it being positioned within the current weekly support area, could see higher prices from here in the near future.
Recent activity on the H4 timeframe shows price failed to sustain gains beyond the 0.79 handle, and proceeded to fall sharply down to the mid-level support at 0.7850 (denotes the top edge of the aforesaid weekly support area). A violation of this line could lead to a move being seen down to the 0.78 handle, which is seen encased within a H4 demand area at 0.7786-0.7804.
Suggestions: With room being seen on the daily timeframe for price to stretch beyond the H4 mid-level support at 0.7850, we would not feel comfortable buying from this line. From our perspective, an ideal scenario would be for price to reach beyond 0.7850 today and cross swords with the aforementioned H4 demand area. As we believe this is a strong buy zone, our desk has set a pending buy order at 0.7805, with a stop-loss order tucked beneath at 0.7784.
Data points to consider: Australian Monetary policy meeting minutes at 2.30am. US Core retail sales figures at 1.30pm GMT+1.
Levels to watch/live orders:
- Buys: 0.7805 ([pending order] stop loss: 0.7784).
- Sells: Flat (stop loss: N/A).
USD/JPY:
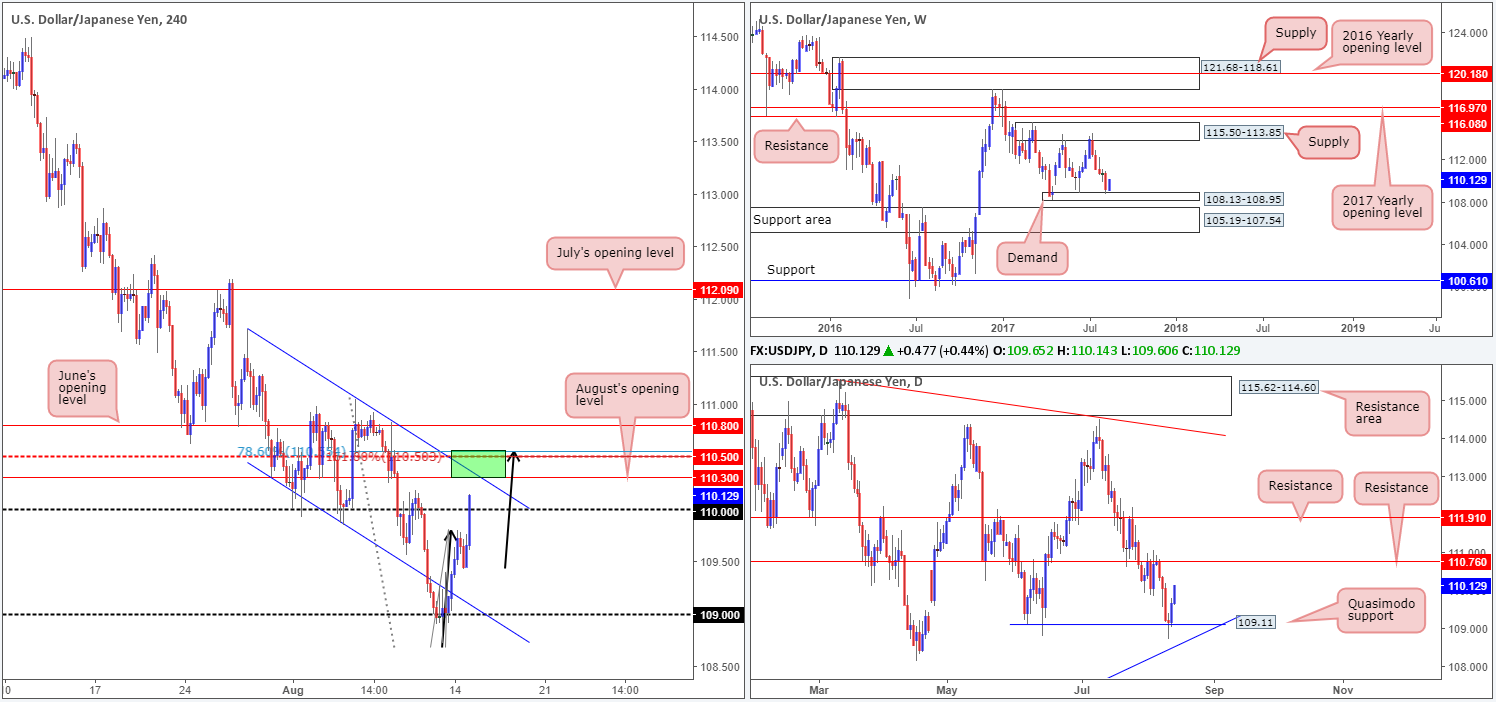
The US dollar made considerable ground against the Japanese yen on Monday, as geopolitical tensions eased between the US and North Korea (Bloomberg). As you can probably see, this has placed the H4 candles above the 110 handle and in-line for an attack of August’s opening level at 110.30, followed closely by the mid-level resistance at 110.50. What’s also notable from here is the AB=CD completion point at 110.50 (black arrows – 161.8% Fib ext.), the 78.6% Fib resistance at 110.55 (basically representing a Gartley Harmonic sell zone) and a channel resistance extended from the high 111.71.
While a short from the green H4 zone is incredibly tempting, traders may want to consider that weekly action is currently trading from demand at 108.13-108.95. Further adding to this, we do not see much in the way of resistance on the daily timeframe until we meet 110.76.
Suggestions: Despite weekly price trading from demand, a sell from the 110.50 neighborhood on the H4 timeframe is still interesting. Stops will, however, have to be positioned above June’s opening level at 110.80, thus clearing daily resistance at 110.76. The ultimate target from here would, from our perspective, be the neighboring channel support stretched from the low 110.30.
Data points to consider: US Core retail sales figures at 1.30pm GMT+1.
Levels to watch/live orders:
- Buys: Flat (stop loss: N/A).
- Sells: 110.50 region (stop loss: 110.80).
USD/CAD:
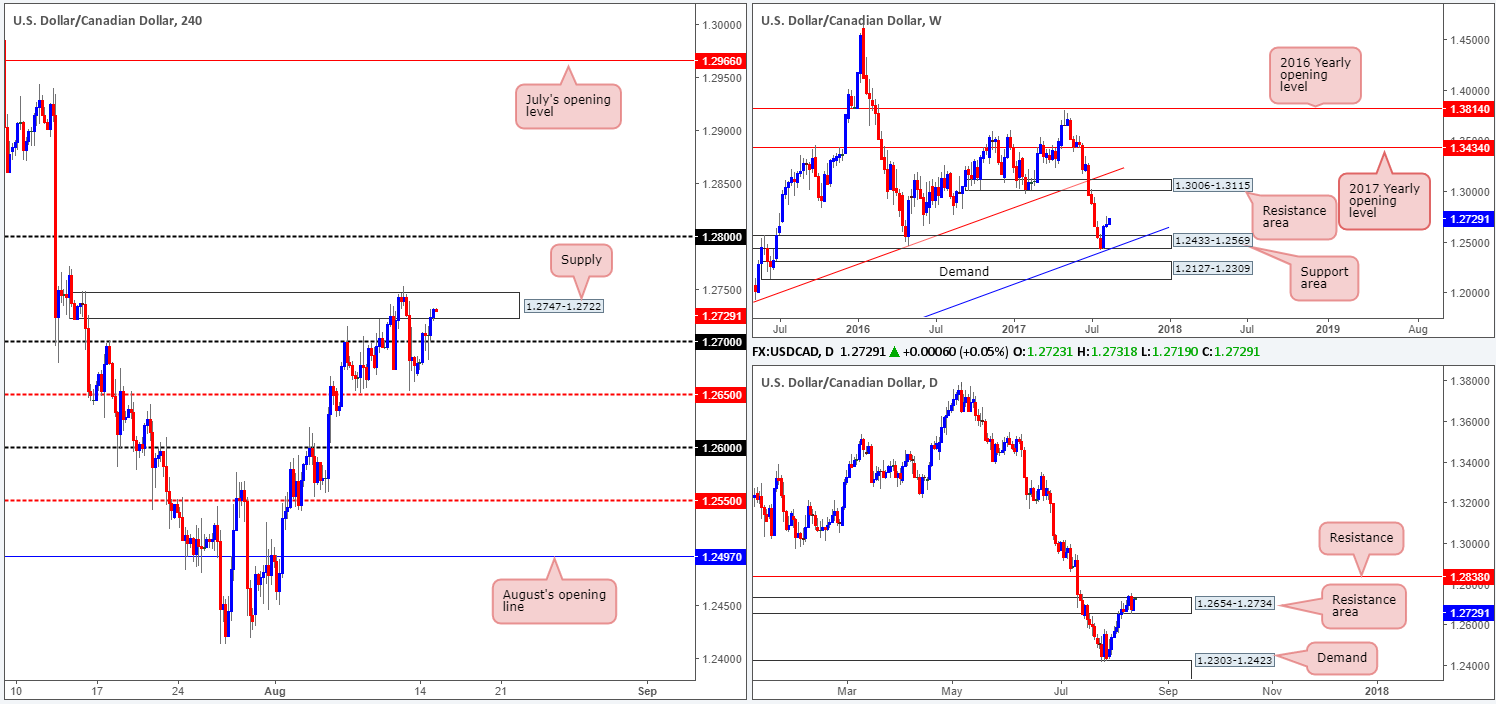
The US dollar advanced against its Canadian counterpart on Monday, consequently lifting the pair above the 1.27 handle and into the jaws of a H4 supply drawn from 1.2747-1.2722. As noted in Monday’s report, this supply area suffered a minor breach to the upside on Friday, which may have cleared the path north for the bulls to challenge the 1.28 region.
On the weekly timeframe, we do not see any obvious resistance on this scale until the resistance area planted at 1.3006-1.3115. The story on the daily timeframe shows price to be trading around a resistance area given at 1.2654-1.2734. The bears appear to lacking here, thus giving the impression we may see the unit stretch up to the resistance level penciled in at 1.2838.
Suggestions: Based on the above, we feel the current H4 supply zone will likely be taken out today. However, we would not be comfortable buyers in this market until a H4 close above this supply is seen. In order to press the buy button, however, we would require a retest of this area as support and a lower-timeframe buy signal (see the top of this report). The initial take-profit level for this setup would be 1.28, followed by the daily resistance at 1.2838, and quite possibly beyond given what the weekly timeframe shows.
Data points to consider: US Core retail sales figures at 1.30pm GMT+1.
Levels to watch/live orders:
- Buys: Watch for H4 price to close above 1.2747-1.2722 and then look to trade any retest seen thereafter ([waiting for a lower-timeframe buy signal to form following the retest is advised] stop loss: dependent on where one confirms this area).
- Sells: Flat (stop loss: N/A).
USD/CHF:
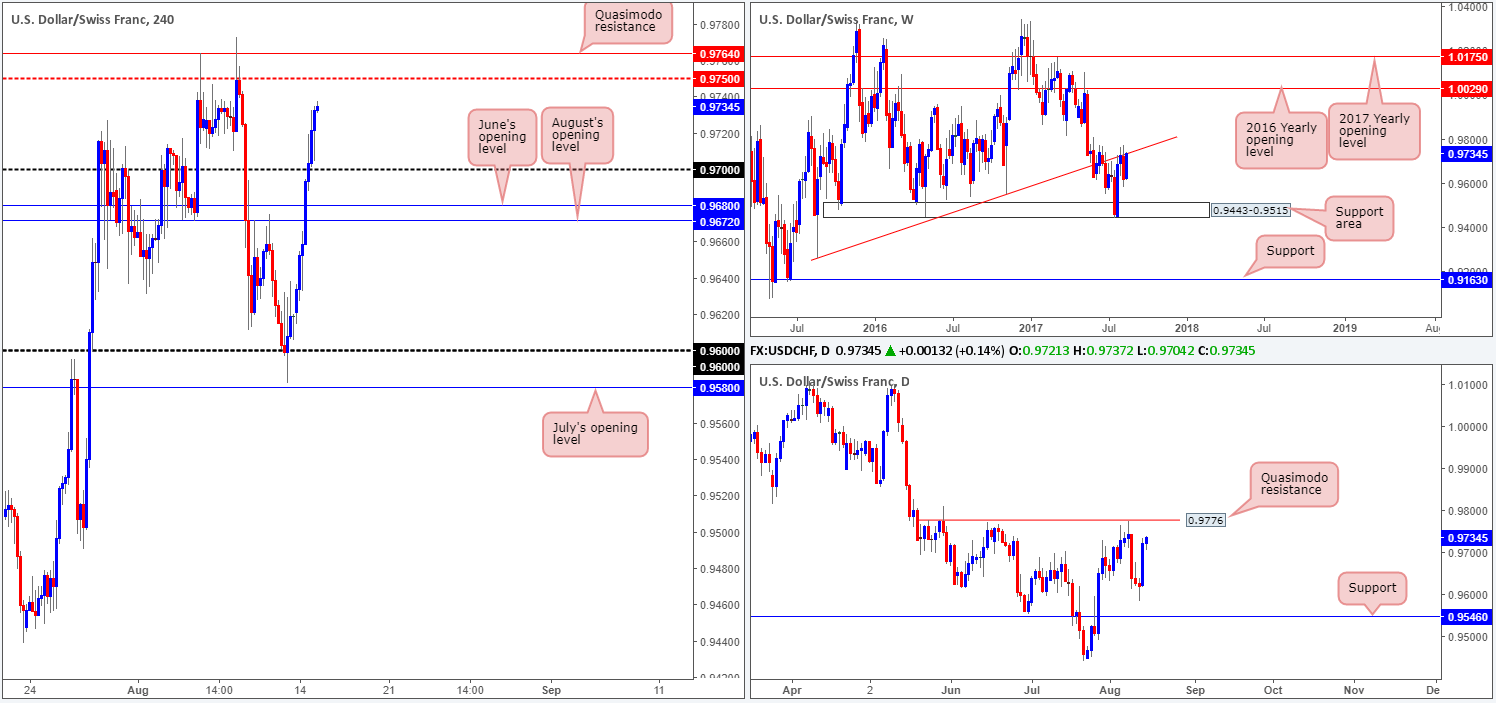
An improvement in risk appetite on Monday weakened the demand for safe-haven assets, pushing the US dollar above both August and June’s opening levels at 0.9672/0.9680 and the 0.97 handle. The next level of resistance on the H4 timeframe can be seen at 0.9750, shadowed closely by a Quasimodo resistance line at 0.9764.
Over on the bigger picture, we can see that weekly price reconnected with a weekly trendline resistance extended from the low 0.9257. On the daily timeframe, however, the unit is seen trading within striking distance of a Quasimodo resistance planted at 0.9776.
Suggestions: Technically speaking, this is not a market we would like to be buyers in at the moment. There’s just too much overhead structure to consider! What we are interested in, nonetheless, is a sell from the daily Quasimodo resistance mentioned above at 0.9776, largely because of how well price reacted when it came near to testing the boundary last week, and, of course, the converging weekly trendline resistance!
Data points to consider: US Core retail sales figures at 1.30pm. Swiss PPI numbers at 8.15am GMT+1.
Levels to watch/live orders:
- Buys: Flat (stop loss: N/A).
- Sells: 0.9776 region ([waiting for a reasonably sized bearish candle to form – in the shape of either a full, or near-full-bodied candle – is advised] stop loss: ideally beyond the candle’s wick).
DOW 30:
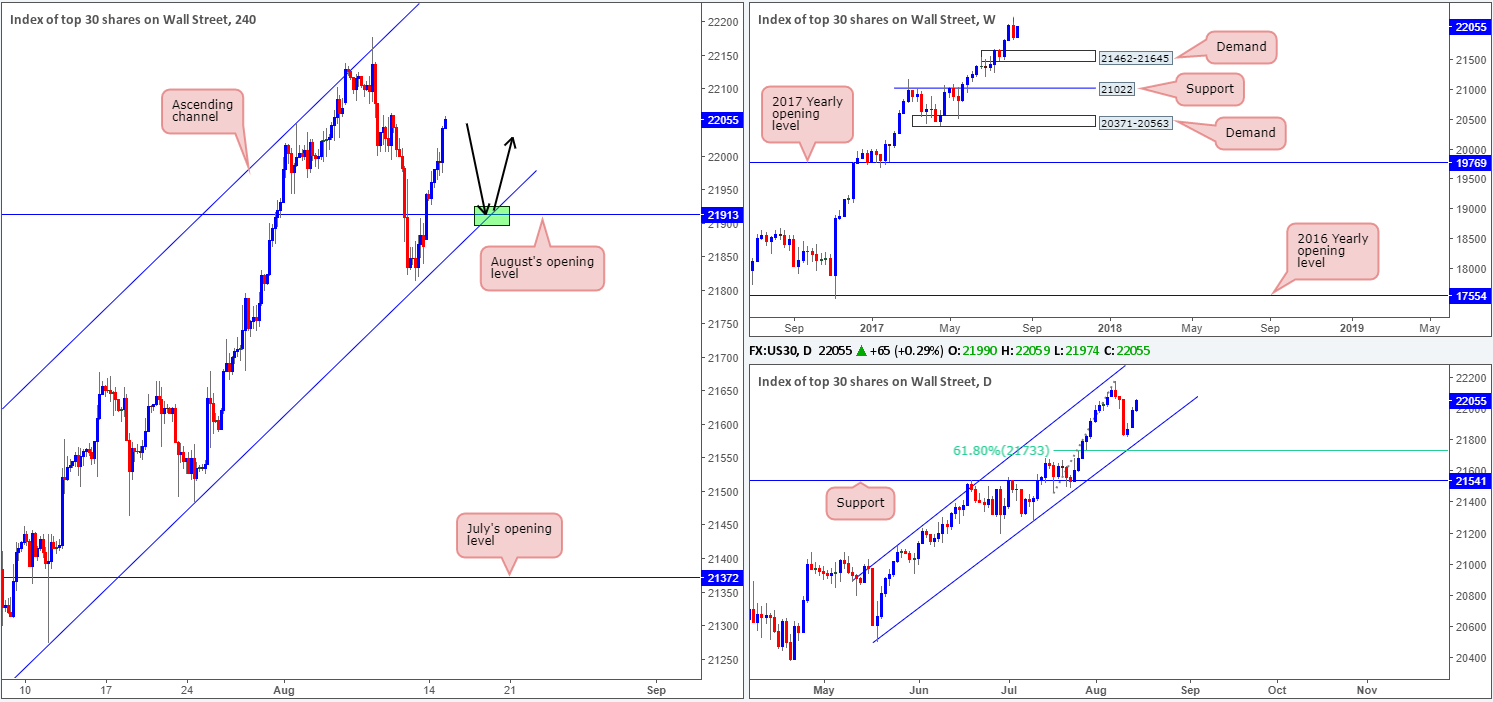
Leaving the H4 channel support line (extended from the low 21273) unchallenged on Monday, the US equity market advanced higher. Running through August’s opening level at 21913, the unit is now seen testing highs of 22059. With both the weekly and daily timeframes showing little resistance on the horizon, a retest of August’s opening level, alongside the aforementioned channel support would, in our humble view, be a nice area to consider entering long from (green zone). However, trendlines are prone to being faked so we would highly recommend being patient and waiting for a H4 bullish candle to take shape in the form of a full, or near-full-bodied candle. This will, of course, not guarantee that the level will hold, but what it will do is show buyer intent from a potential buy zone!
Our suggestions: Keep a close eye on the 21913 region for possible long opportunities.
Data points to consider: US Core retail sales figures at 1.30pm GMT+1.
Levels to watch/live orders:
- Buys: 21913 region ([waiting for a reasonably sized bullish candle to form – in the shape of either a full, or near-full-bodied candle – is advised] stop loss: ideally beyond the candle’s tail).
- Sells: Flat (stop loss: N/A).
GOLD:
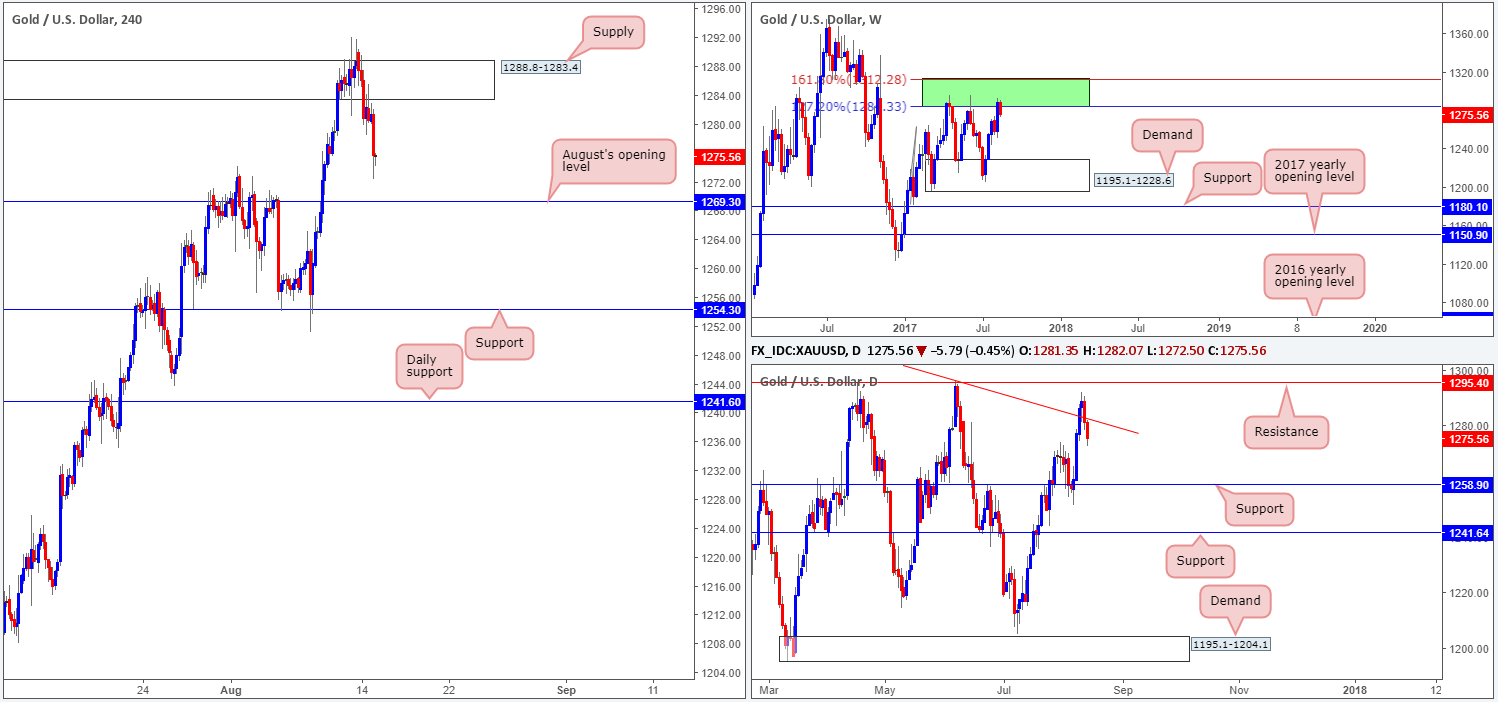
Demand for the safe-haven metal diminished on Monday as tensions between the US and North Korea eased. From a technical point of view, a selloff in this market was to be expected, as weekly price is seen trading from a resistance area comprised of two weekly Fibonacci extensions 161.8/127.2% at 1312.2/1284.3 taken from the low 1188.1.
Thanks to yesterday’s descent, daily price closed back below the trendline resistance etched from the high 1337.3, and has potentially opened the trapdoor down to a support level pegged at 1258.9. Near-term, however, we have August’s opening level at 1269.3 on the H4 chart to contend with.
Our suggestions: Until we see a H4 close print below August’s opening level, we will refrain from taking any shorts in this market. A close below this monthly line, followed up with a retest and a lower-timeframe sell signal (see the top of this report) would, in our opinion, be enough to confirm a sell trade down to the daily support mentioned above at 1258.9, followed closely by H4 support at 1254.3.
Levels to watch/live orders:
- Buys: Flat (stop loss: N/A).
- Sells: Watch for H4 price to close below 1269.3 and then look to trade any retest seen thereafter ([waiting for a lower-timeframe sell signal to form following the retest is advised] stop loss: dependent on where one confirms this level).


