
DXY:
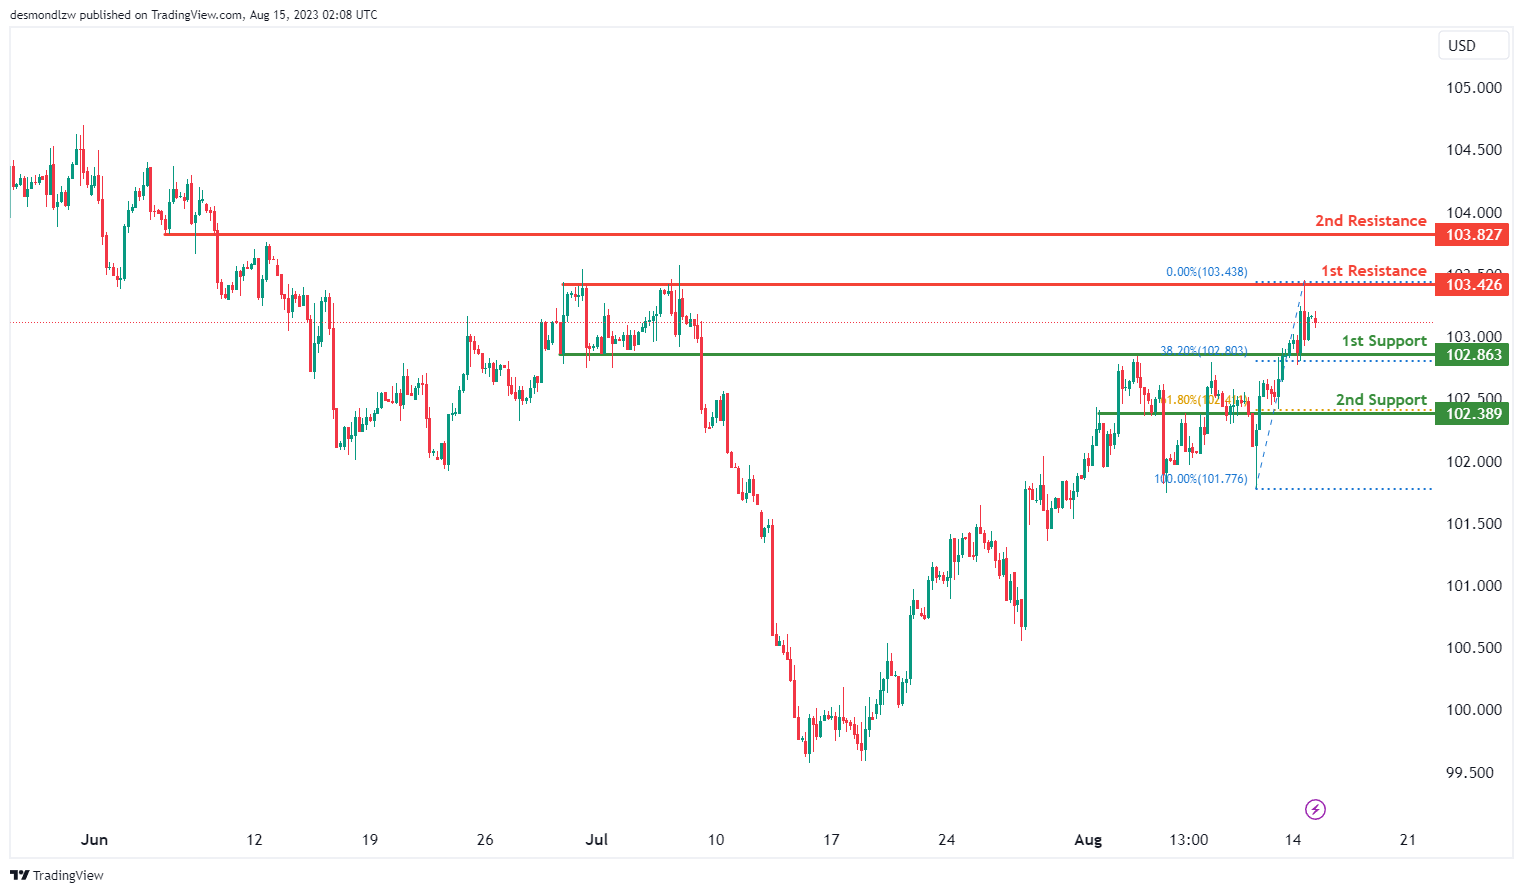
The DXY chart is currently showing a neutral momentum, suggesting a lack of clear direction. The price is expected to fluctuate between the 1st support and 1st resistance levels.
The 1st support level at 102.86 is important as it is an overlap support and also aligns with a 38.20% Fibonacci Retracement. Similarly, the 2nd support at 102.38 is significant as it is an overlap support and is also associated with a 61.80% Fibonacci Retracement.
On the upside, the 1st resistance at 103.42 is identified as a multi-swing high resistance. There is also a 2nd resistance level at 103.82, which is categorized as a pullback resistance.
EUR/USD:
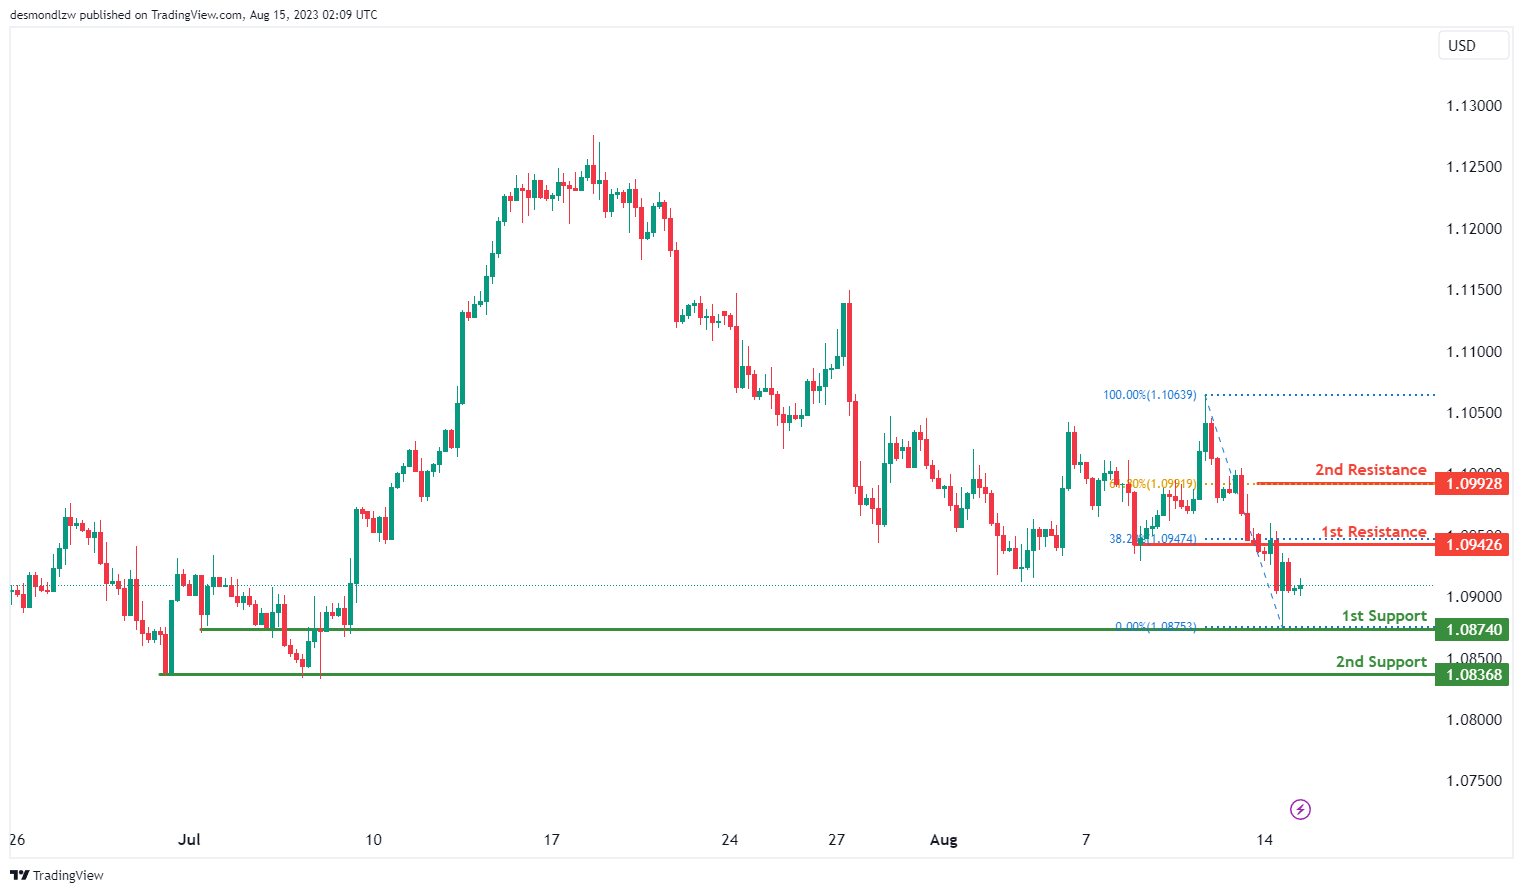
The EUR/USD chart is currently displaying a bullish momentum, indicating a prevalent upward trend. Within this context, there is potential for the price to continue its bullish movement towards the 1st resistance level.
The 1st support at 1.0874 is significant due to its alignment with a 38.20% Fibonacci retracement, reinforcing its role as a potential support level. Additionally, a 2nd support at 1.0836 is identified as a multi-swing low support.
On the other hand, the 1st resistance level at 1.0942 gains importance as it is an overlap resistance, while the 2nd resistance at 1.0992 aligns with a 61.80% Fibonacci retracement, further emphasizing its potential significance in controlling any upward movement.
EUR/JPY:
The current analysis of the EUR/JPY chart indicates a bullish momentum, suggesting a prevailing upward trend. Given this momentum, there is a possibility for the price to continue its bullish movement towards the 1st resistance level at 159.20.
The 1st support at 157.96 is significant as it serves as a pullback support. Another level of support is found at 157.32, which is further strengthened by the presence of a 23.60% Fibonacci Retracement.
Conversely, the 1st resistance level at 159.20 is considered a significant level due to its status as a swing high resistance. There is also a 2nd resistance at 159.89, which is noteworthy as it aligns with the 127.20% Fibonacci Extension level.

EUR/GBP:
The current analysis of the EUR/GBP chart suggests a bearish momentum, indicating a downward trend. In light of this momentum, there is a potential for the price to bounce off the 1st support and move towards the 1st resistance level.
The 1st support at 0.8586 is considered a strong support level as it also acts as a pullback support. Additionally, the 2nd support at 0.8549 provides further reinforcement due to its identification as a multi-swing low support.
On the other hand, the 1st resistance level at 0.8662 holds significance as an overlap resistance, and its importance is further accentuated by the presence of a 61.80% Fibonacci Retracement and a 61.80% Fibonacci Projection, indicating a confluence of technical factors.
There is also a 2nd resistance at 0.8701, which is noted as a swing high resistance.

GBP/USD:
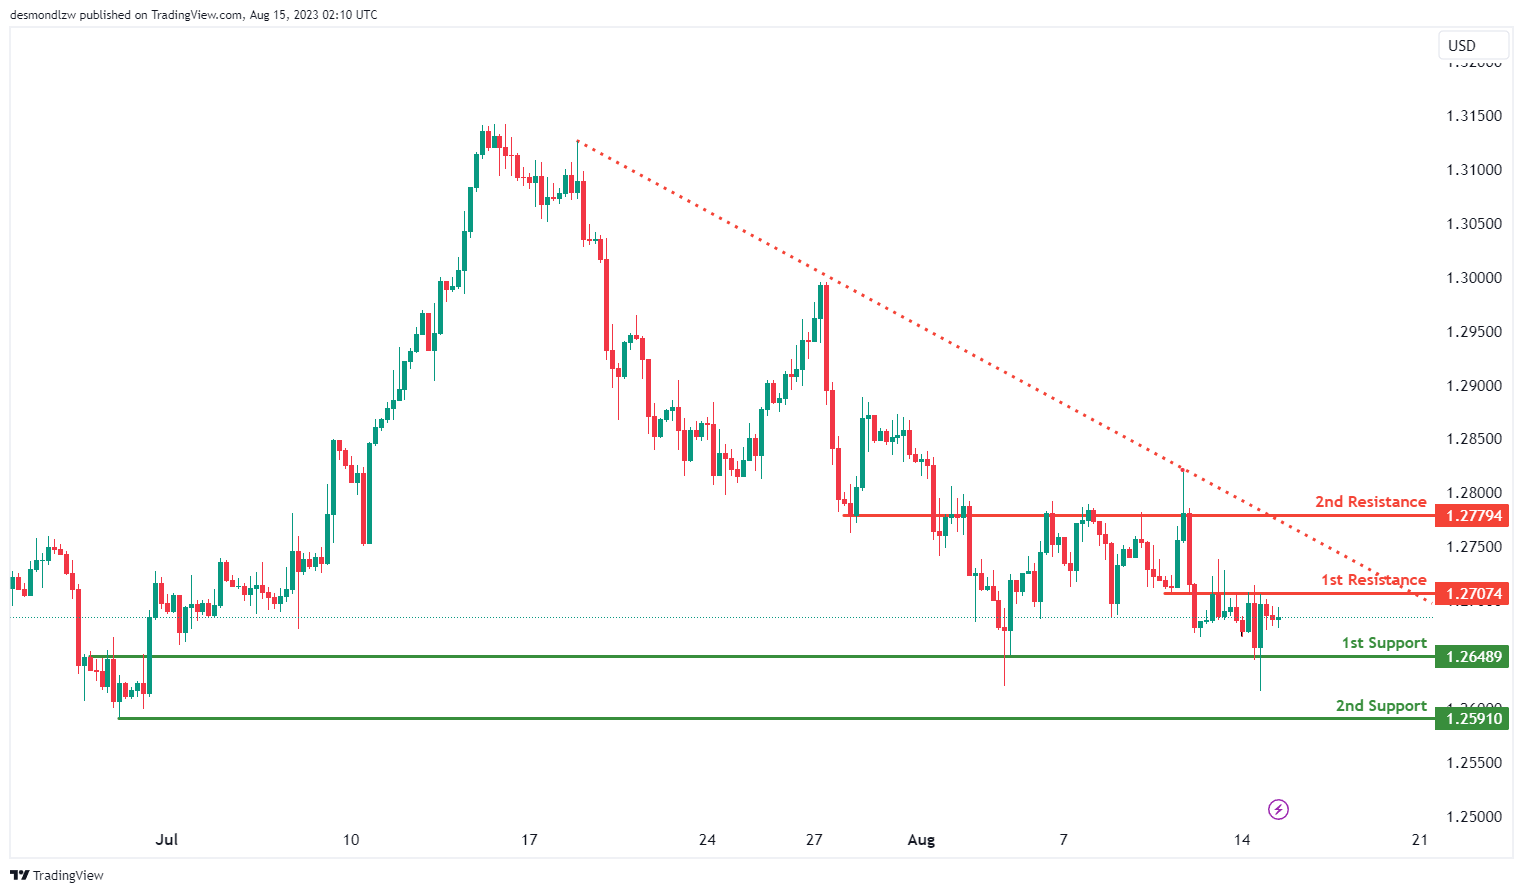
The GBP/USD chart currently indicates a neutral momentum, suggesting a lack of clear direction in the market.
In this scenario, the price may potentially move within a range between the 1st support level at 1.2648 and the 1st resistance level at 1.2707.
The significance of the 1st support at 1.2648 lies in its classification as an overlap support, while the 2nd support at 1.2591 is identified as a swing low support.
On the other hand, the 1st resistance level at 1.2707 is important as an overlap resistance, and a potential upward movement might be hindered by the 2nd resistance at 1.2779.
GBP/JPY:
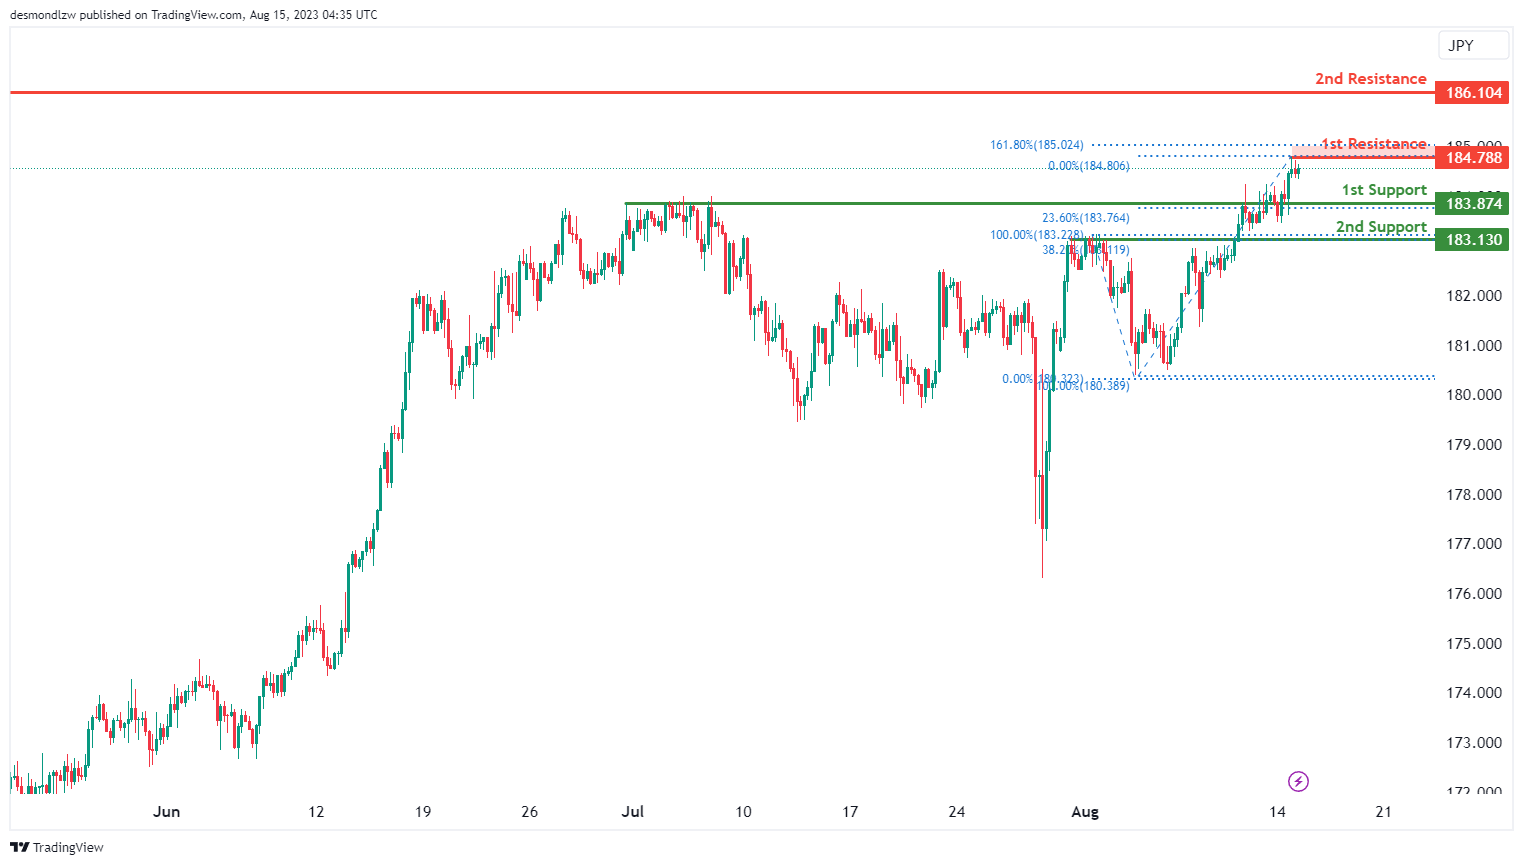
The GBP/JPY chart is currently showing a bullish momentum, indicating a potential upward trend. Given this positive momentum, there is a chance that the price will continue to rise towards the 1st resistance level.
The 1st support level at 183.87 is significant as it is an overlap support and is also aligned with a 23.60% Fibonacci Retracement. Additionally, the 2nd support at 183.13 is reinforced by a 38.20% Fibonacci Retracement.
On the other hand, the 1st resistance at 184.78 is noteworthy due to its association with a swing high resistance. The 2nd resistance at 186.10 also acts as a swing high resistance, which further strengthens its potential to impede upward movement.
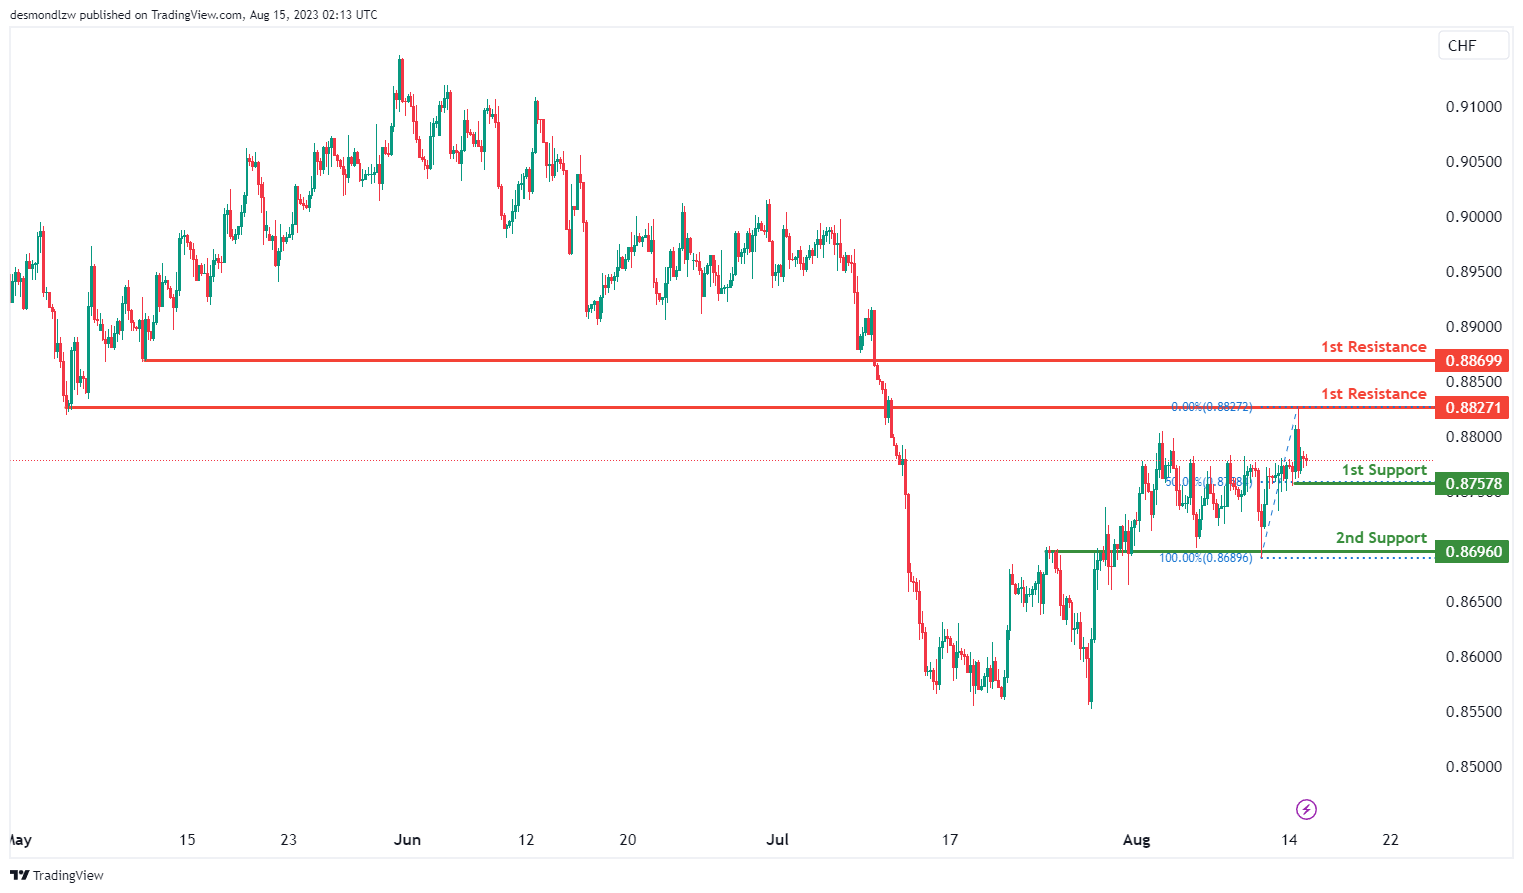
USD/CHF:
The USD/CHF chart currently shows a bearish momentum, indicating a prevailing downward trend.
Given this bearish momentum, there is a possibility that the price may continue to move lower towards the 1st support level.
The 1st support at 0.8757 is notable as it aligns with a 50% Fibonacci Retracement level. Additionally, the 2nd support at 0.8696 is identified as an overlap support.
On the flip side, the 1st resistance level at 0.8827 holds significance as an overlap resistance. Another resistance level at 0.8869 is identified as a pullback resistance, adding to its potential to prevent upward movement.
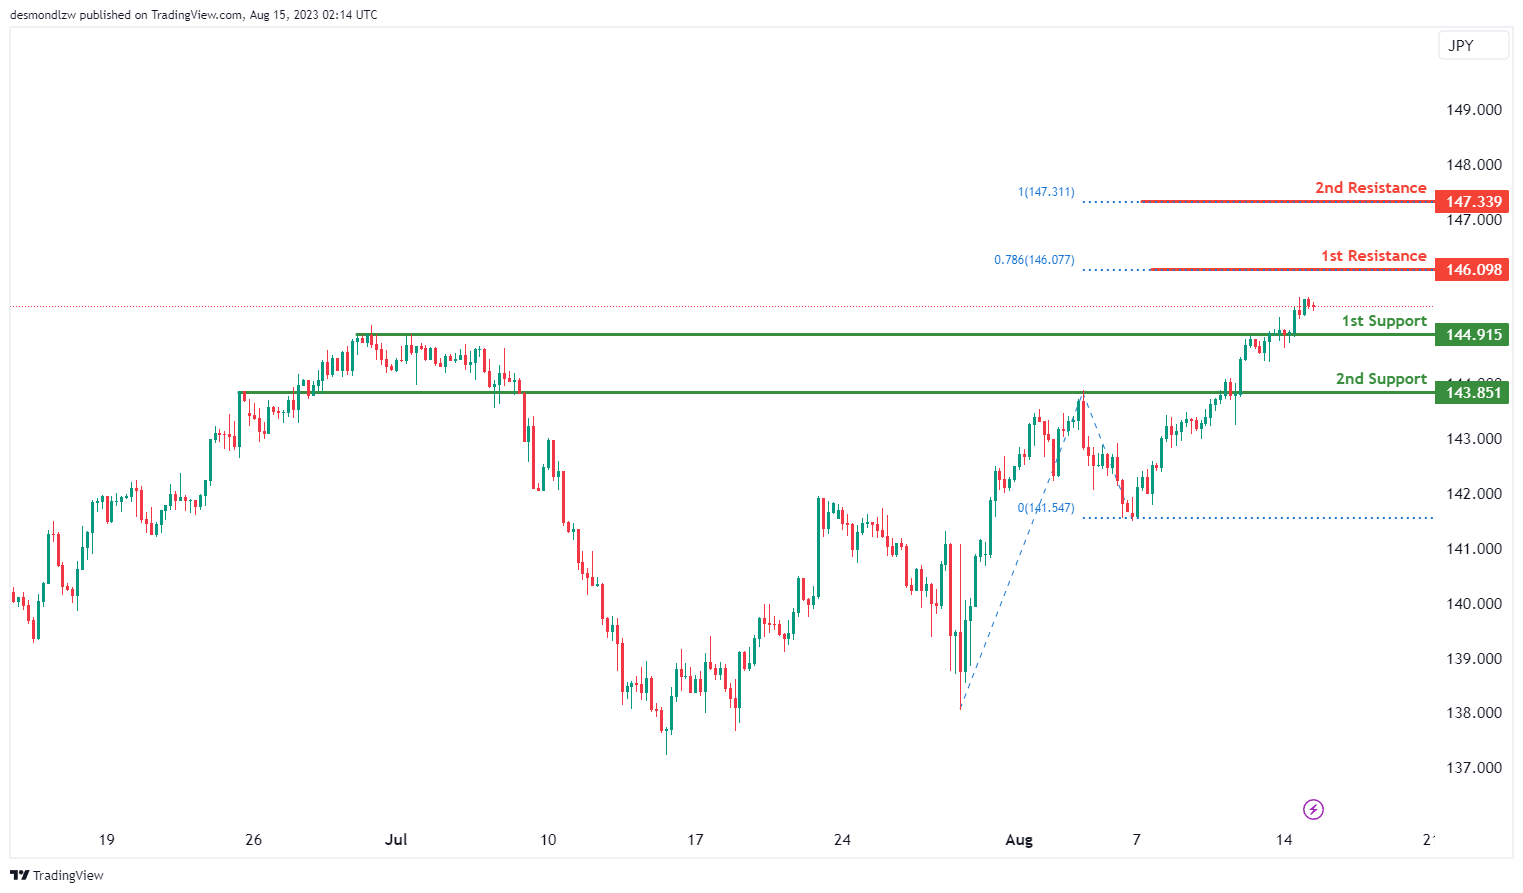
USD/JPY:
The USD/JPY chart indicates a bullish momentum, suggesting a potential upward trend.
Given this momentum, there is a possibility for the price to continue rising towards the 1st resistance level.
The 1st support at 144.91 is significant as it acts as a pullback support. Similarly, the 2nd support at 143.85 is also a pullback support.
On the other hand, the 1st resistance level at 146.09 is noteworthy as it aligns with a 78.60% Fibonacci Projection. Additionally, there is a 2nd resistance at 147.33, which is associated with a 100% Fibonacci Projection, enhancing its potential to resist upward movement.
USD/CAD:
The current chart analysis of USD/CAD suggests a bearish momentum, indicating a downward trend. This trend may lead to a potential continuation towards the 1st support level should the intermediate support at 1.3414, which corresponds to the 61.80% Fibonacci retracement level, be broken.
The 1st support level at 1.3387 is supported by an overlap support that aligns close to the 38.20% Fibonacci retracement level. Additionally, the 2nd support at 1.3322 holds significance as a pullback support that is aligned with the 50.00% Fibonacci retracement level.
To the upside, the 1st resistance at 1.3485 is an important level as it coincides with a swing high resistance and the 78.60% Fibonacci retracement level. Furthermore, there is a 2nd resistance at 1.3565, which acts as an overlap resistance, that adds to the potential resistance zone.

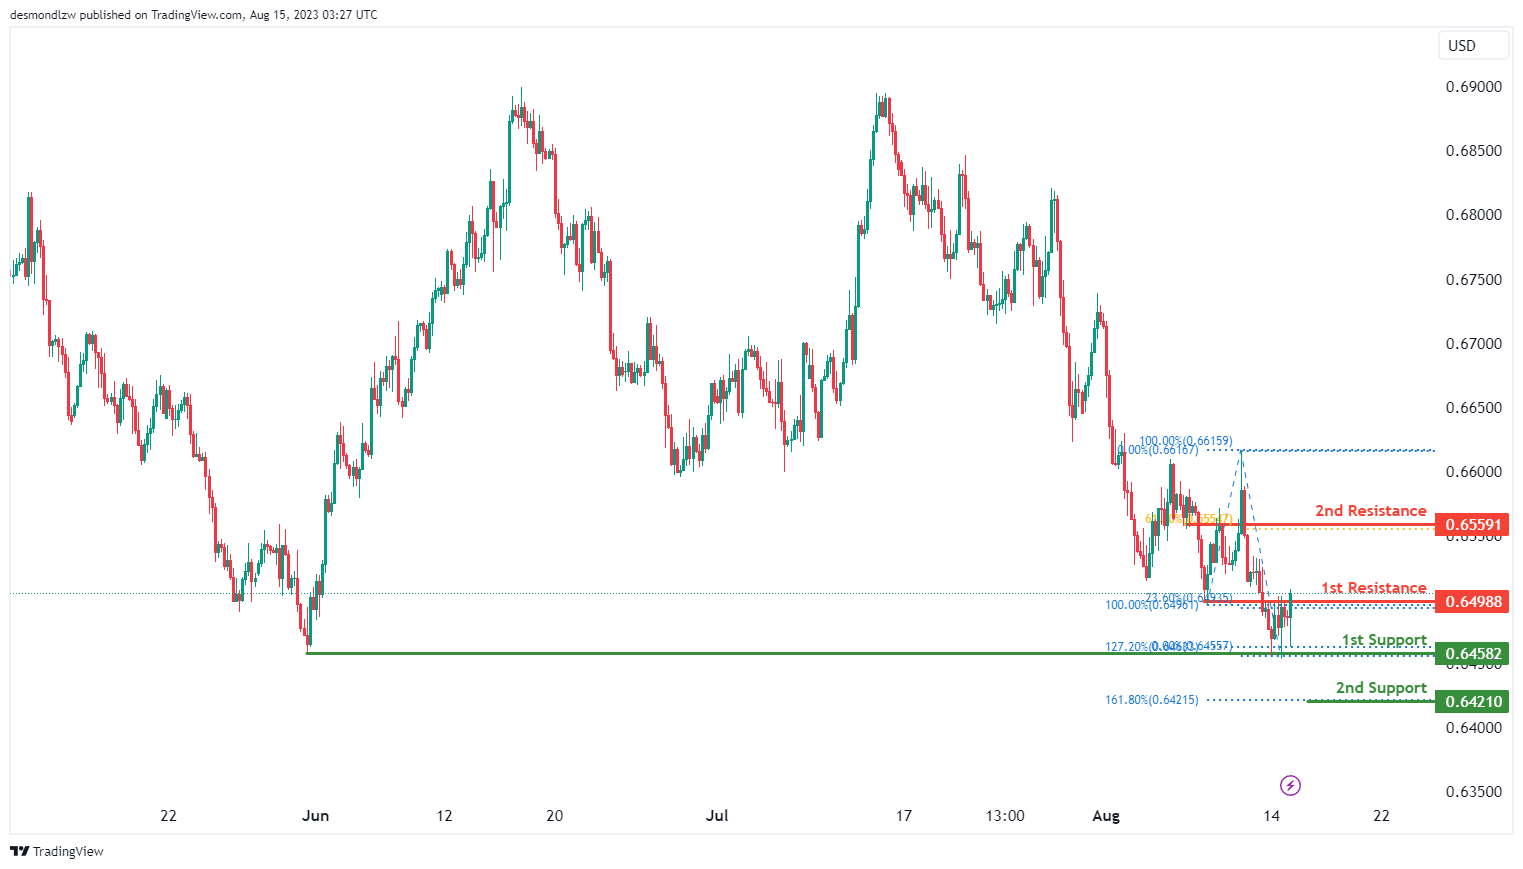
AUD/USD:
The current analysis of the AUD/USD chart indicates a bullish momentum, suggesting a potential upward trend. This momentum could lead to a bullish breakout above the 1st resistance level at 0.6499 and a potential move towards the 2nd resistance at 0.6559.
The 1st resistance at 0.6499 is significant due to its alignment with an overlap resistance and the 23.60% Fibonacci retracement level. Additionally, the 2nd resistance at 0.6559 holds importance as an overlap resistance that aligns with the 61.80% Fibonacci retracement level.
To the downside, the 1st support at 0.6458 is supported by an overlap support that aligns with the 127.20% Fibonacci extension level, while the 2nd support at 0.6421 is reinforced by a support level that aligns with the 161.80% Fibonacci extension level.
NZD/USD
The current trend on the NZD/USD chart is exhibiting a bullish momentum, suggesting the possibility of further upward movement towards the 1st resistance.
The 1st resistance level at 0.5993.is identified as an overlap resistance that aligns with the 23.60% Fibonacci retracement level. The 2nd resistance at 0.6037 is also identified as an overlap resistance that aligns with the 50.00% Fibonacci retracement level.
To the downside, the 1st support at 0.5944 is a swing-low support that aligns with the 127.20% Fibonacci extension level while the 2nd support at 0.5859 is also identified as a swing-low support.

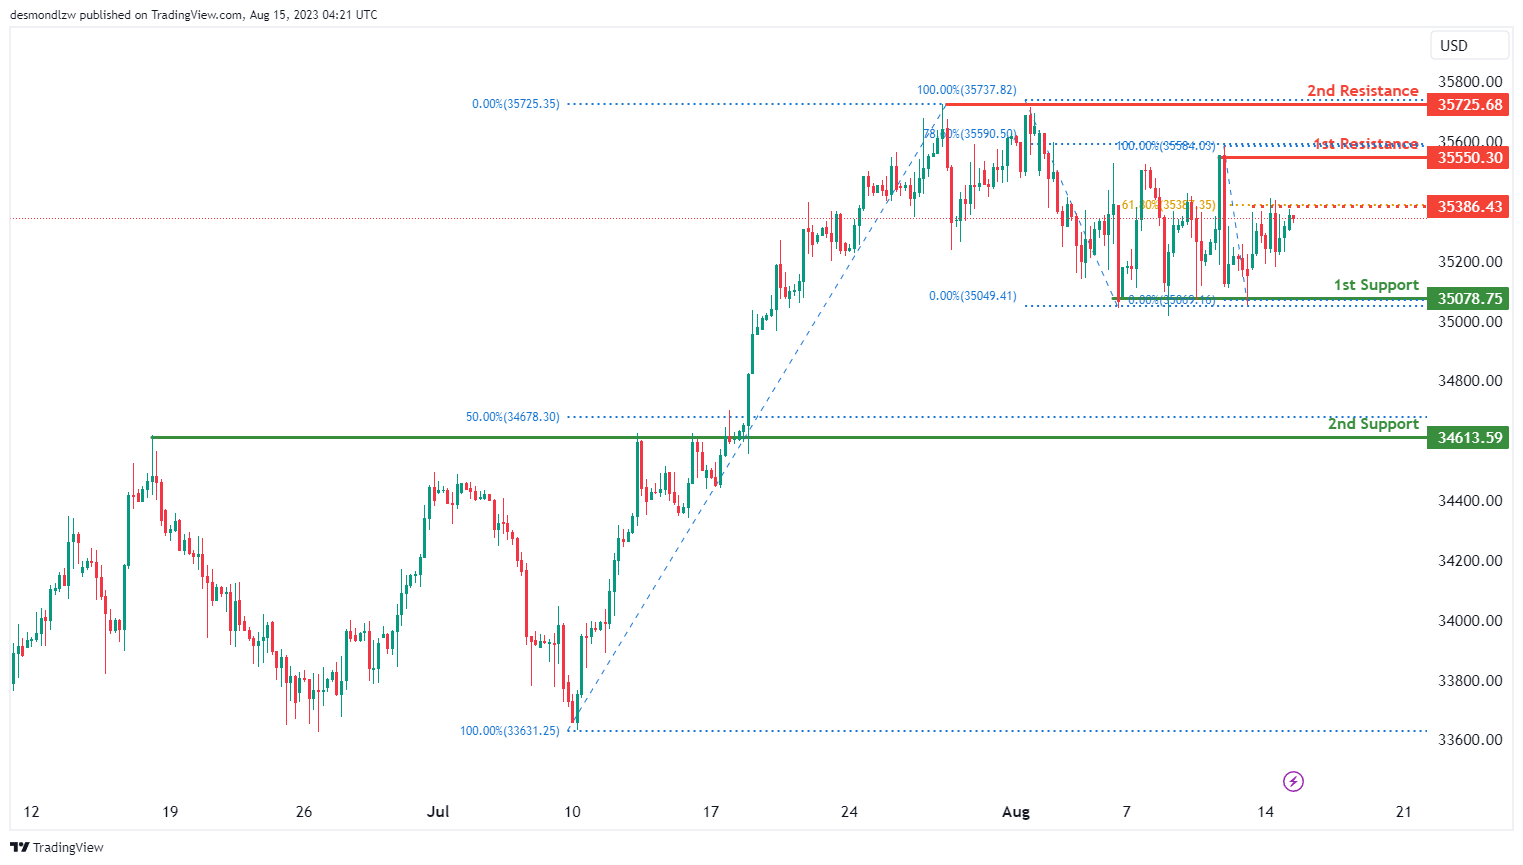
DJ30:
The current analysis of the DJ30 chart indicates a bullish momentum, reflecting an ongoing upward trend. Given this bullish outlook, there is a possibility for the price to continue its upward movement towards the 1st resistance level at 35550.30.
The 1st support level at 35078.75 is significant as it represents a multi-swing low support. Additionally, the 2nd support at 34613.59 reinforces the supportive structure.
On the contrary, the 1st resistance at 35550.30 holds significance as a swing high resistance, which could impede further upward movement.
Furthermore, the existence of a 2nd resistance at 35725.68, characterized as a multi-swing high resistance, further supports the potential for resistance against upward price movement. An intermediate resistance at 35386.43, coupled with a 61.80% Fibonacci retracement, further enhances the potential for resistance at this level.
GER30:
The current chart analysis for GER30 indicates a bullish momentum, suggesting a prevailing upward trend. With this positive momentum, there is a potential for the price to continue its bullish movement towards the 1st resistance level at 16002.87.
The 1st support level at 15772.40 is significant as it is a swing low support. Additionally, the 2nd support at 15643.90 serves as a reinforcement for the support structure.
On the other hand, the 1st resistance level at 16002.87 is important as it acts as a pullback resistance and aligns with both the 38.20% and 78.60% Fibonacci retracement levels, indicating potential resistance.
Moreover, there is a 2nd resistance at 16249.11 which also serves as an overlap resistance, further emphasizing its potential impact on price movement.

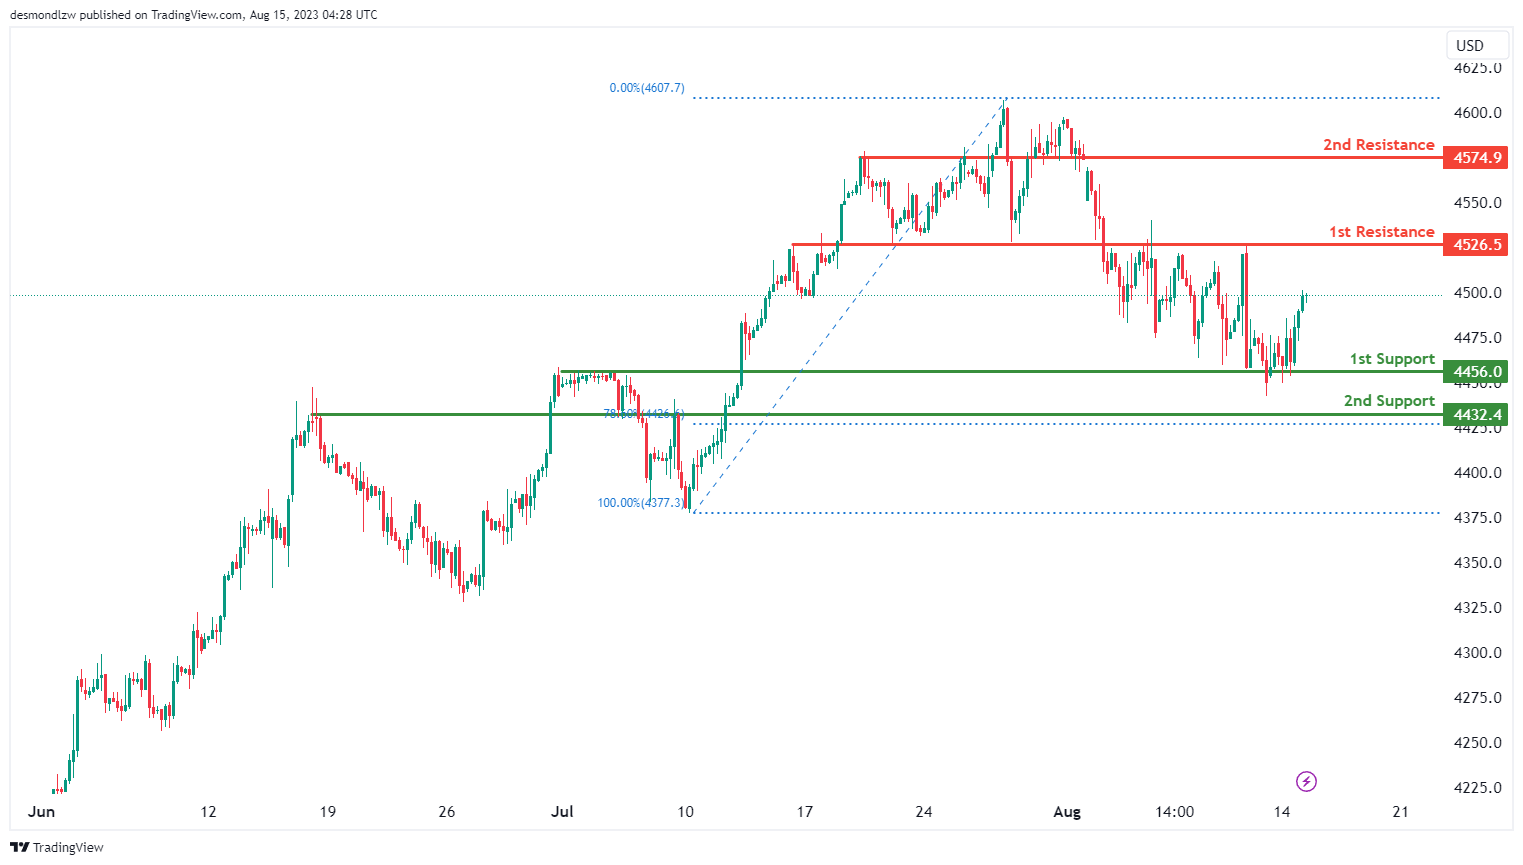
US500
The current analysis of the US500 chart suggests a bullish momentum, indicating a prevailing upward trend. With this momentum, there is a potential for the price to continue moving upwards towards the 1st resistance level at 4526.5.
The 1st support level at 4456.0 is considered strong due to its alignment with a pullback support and a 78.60% Fibonacci retracement. Additionally, the 2nd support at 4432.4 provides further reinforcement to the support structure.
On the flip side, the 1st resistance level at 4526.5 is important as it acts as an overlap resistance. Moreover, there is a 2nd resistance at 4574.9, which is also identified as an overlap resistance, adding to its potential to resist further upward movement.
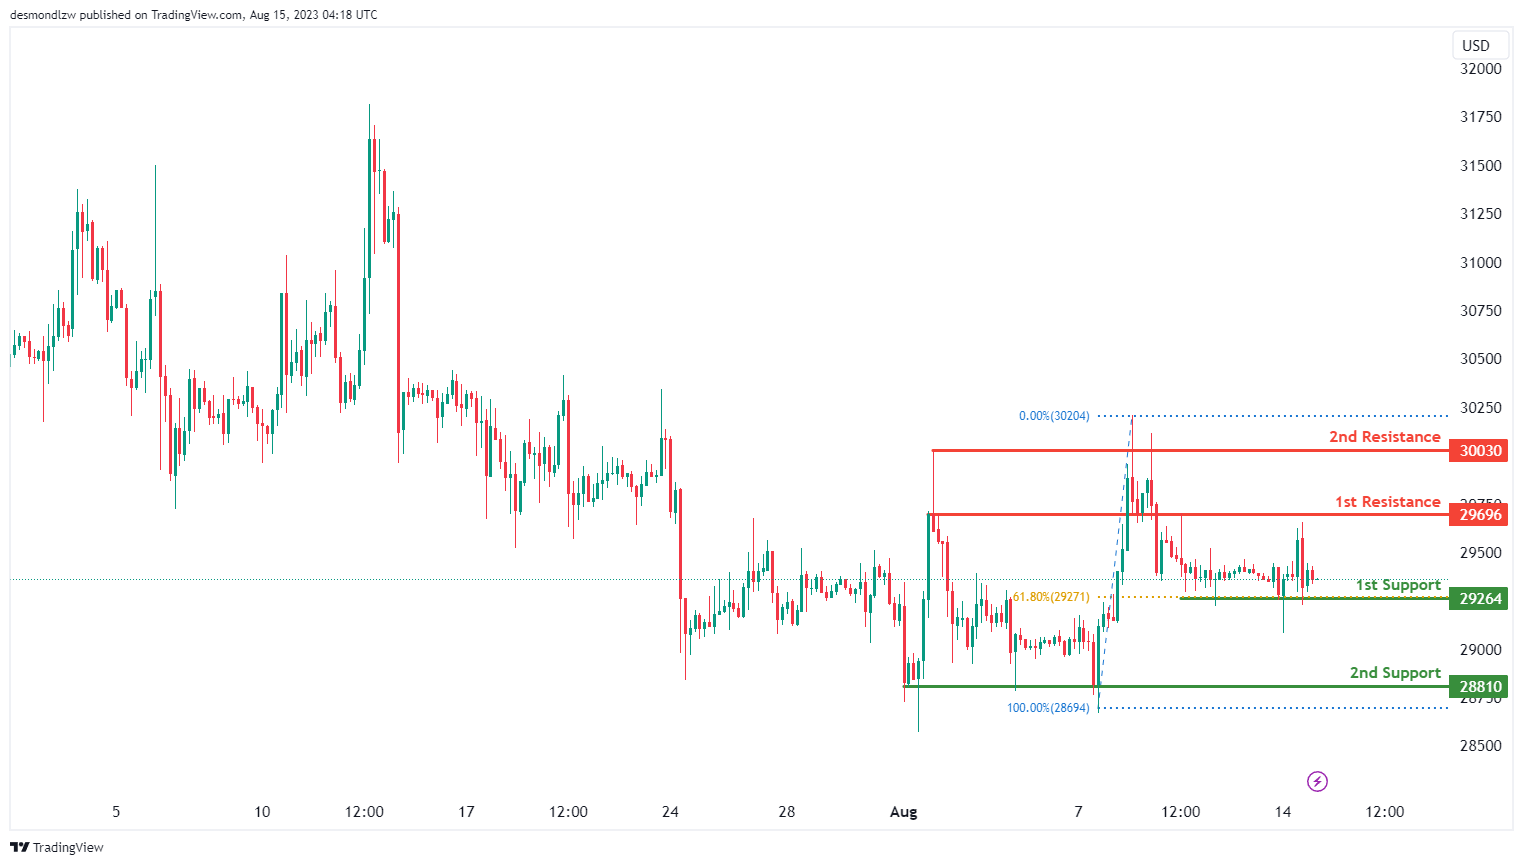
BTC/USD:
The current chart analysis of BTC/USD suggests a bullish trend, indicating an upward movement.
Given this bullish sentiment, there’s a possibility for the price to rebound from the 1st support level and continue its upward trajectory towards the 1st resistance at 29696.
The 1st support at 29264 gains significance due to its role as a pullback support, supported by a 61.80% Fibonacci Retracement. Additionally, a secondary support at 28810 enhances the support structure, identified as a multi-swing low support.
Conversely, the 1st resistance level at 29696 becomes notable as it is an overlap resistance. Furthermore, a 2nd resistance at 30030 is characterized as a multi-swing high resistance, contributing to its potential impact on the price movement.
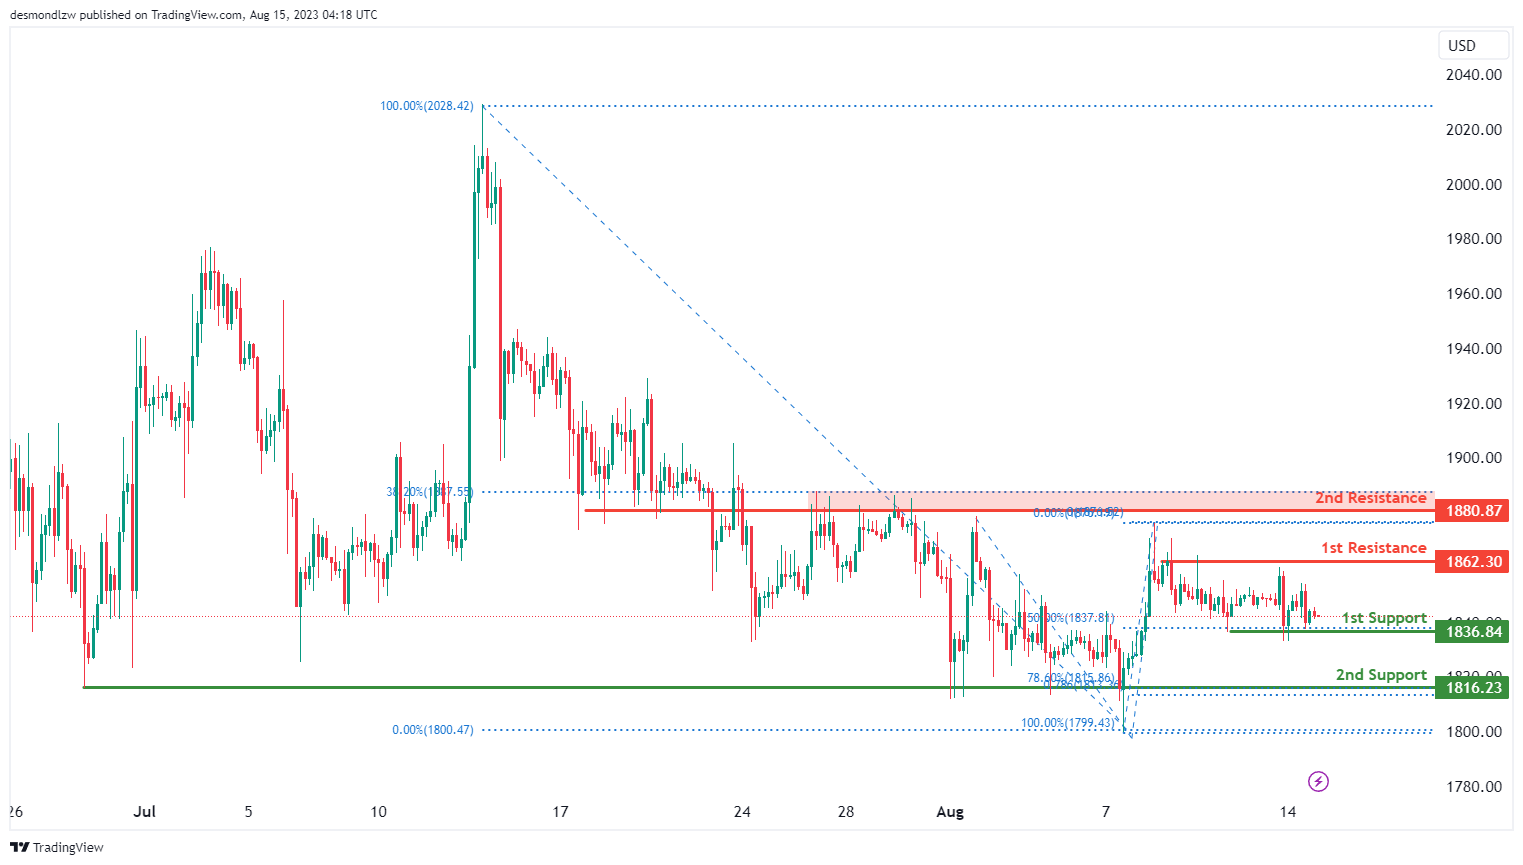
ETH/USD:
The current analysis of the ETH/USD chart shows a bullish momentum, indicating a prevailing upward trend.
Given this momentum, there is a potential scenario where the price could rebound from the 1st support level and move towards the 1st resistance at 1862.30.
The 1st support at 1836.84 gains importance as it serves as a pullback support, in addition to aligning with a 50% Fibonacci Retracement. Another layer of support is observed at 1816.23, identified as an overlap support.
On the flip side, the 1st resistance level at 1862.30 is significant due to its role as a multi-swing high resistance. Furthermore, a 2nd resistance at 1880.87 is identified as an overlap resistance, strengthening its potential to influence price movement.
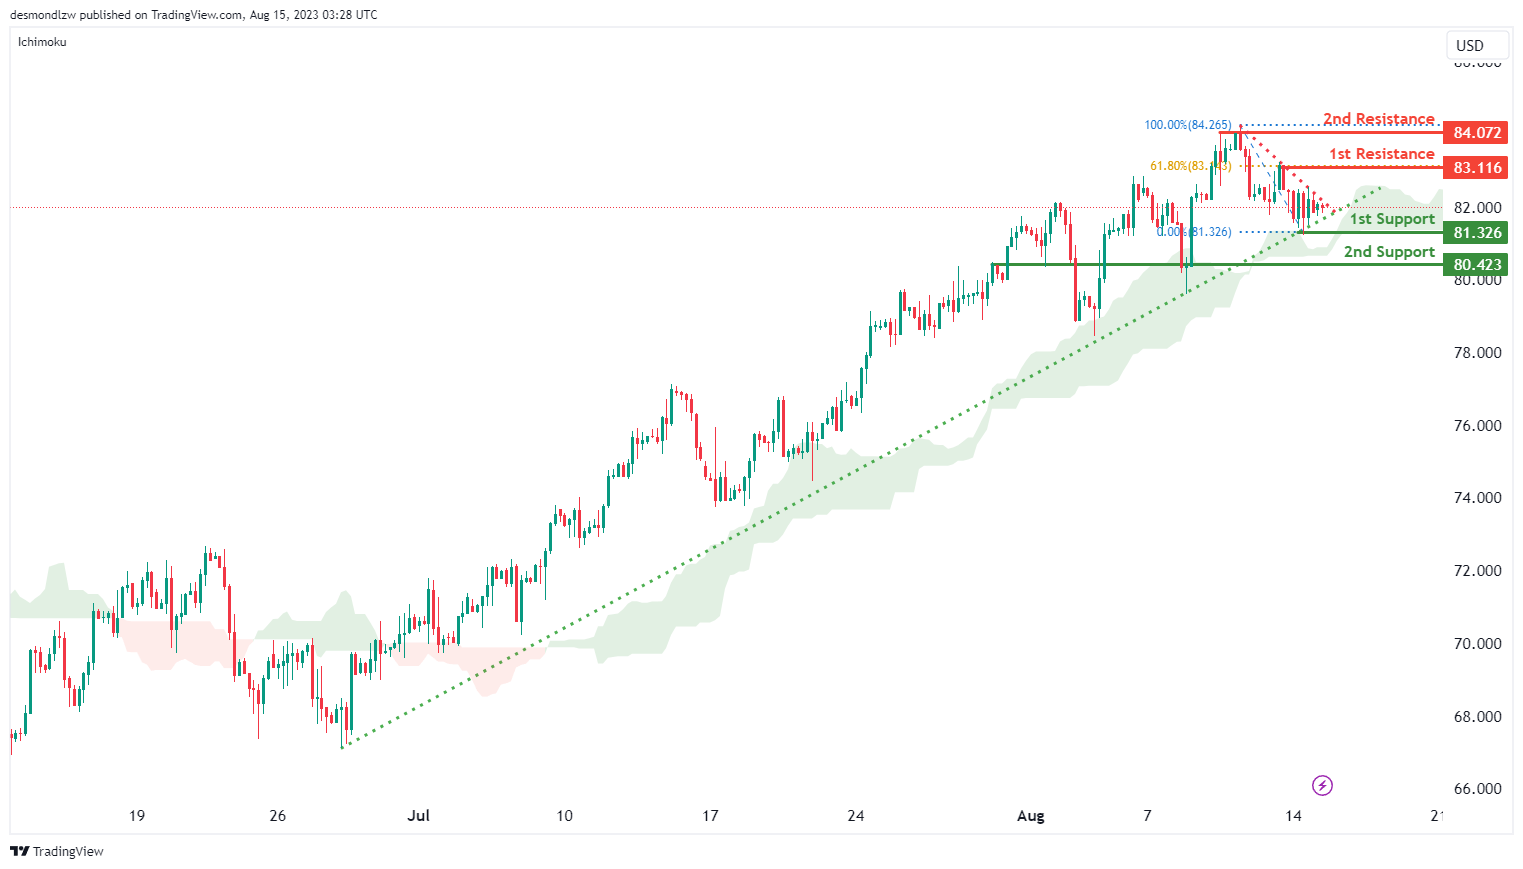
WTI/USD:
The current momentum of the WTI/USD chart is showing a weak bullish trend with low confidence. This suggests that the price is likely to continue moving higher, supported by the presence of a major ascending trend line and being above the bullish Ichimoku cloud.
There is a potential for the price to continue its bullish movement towards the 1st resistance level at 83.12 that is identified as a pullback resistance that aligns with the 61.80% Fibonacci retracement level. In addition, the 2nd resistance at 84.07 is identified as a swing-high resistance.
To the downside, the 1st support level at 81.33 is identified as a swing-low that intersects with the ascending trendline. Additionally, the 2nd support at 80.42 is identified as an overlap support level.
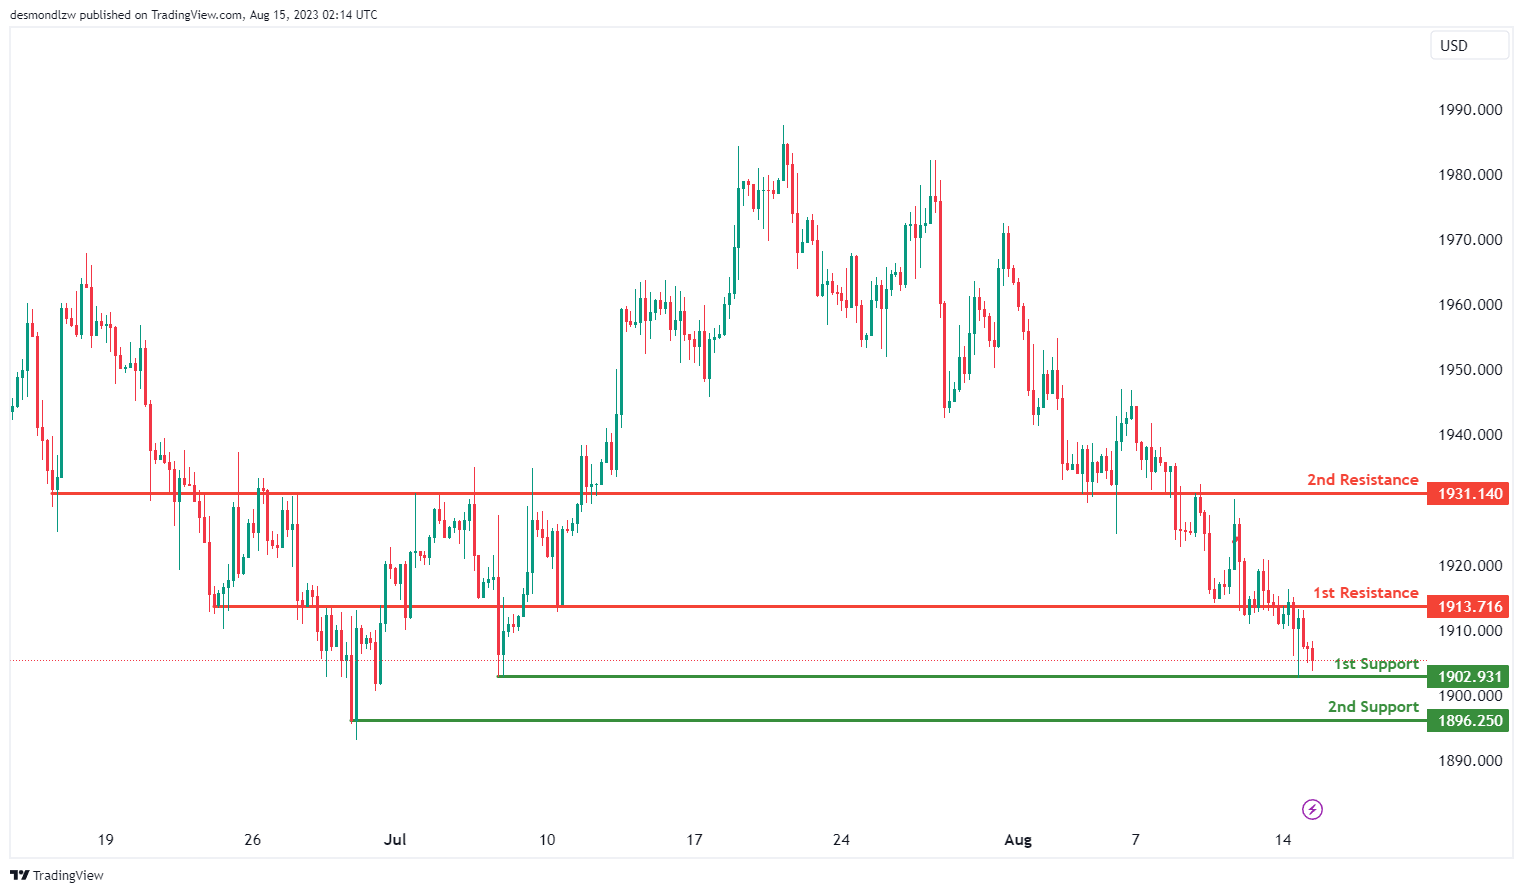
XAU/USD (GOLD):
The XAU/USD chart currently exhibits a bullish momentum, indicating a potential upward trend. Given this momentum, the price may continue to rise towards the 1st resistance level at 1913.71. The 1st support at 1902.93 is significant as it is a multi-swing low support, while the 2nd support at 1896.25 serves as a pullback support. On the other hand, the 1st resistance level at 1913.71 is considered an overlap resistance, and there is a 2nd resistance at 1931.14, which further supports potential upward movement.
The accuracy, completeness and timeliness of the information contained on this site cannot be guaranteed. IC Markets does not warranty, guarantee or make any representations, or assume any liability regarding financial results based on the use of the information in the site.
News, views, opinions, recommendations and other information obtained from sources outside of www.icmarkets.com, used in this site are believed to be reliable, but we cannot guarantee their accuracy or completeness. All such information is subject to change at any time without notice. IC Markets assumes no responsibility for the content of any linked site.
The fact that such links may exist does not indicate approval or endorsement of any material contained on any linked site. IC Markets is not liable for any harm caused by the transmission, through accessing the services or information on this site, of a computer virus, or other computer code or programming device that might be used to access, delete, damage, disable, disrupt or otherwise impede in any manner, the operation of the site or of any user’s software, hardware, data or property.


